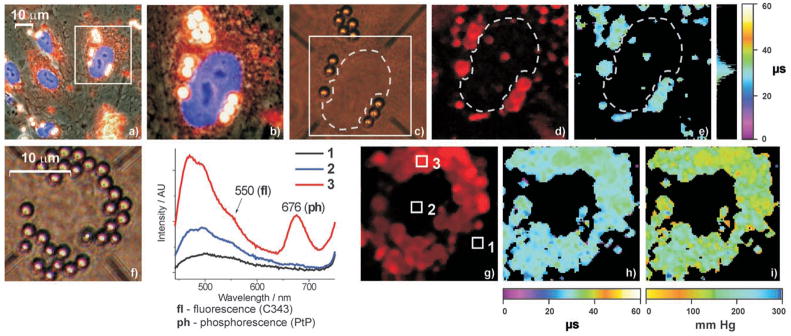
Figure 5.
Images of fixed (a–e) and live (f–i) human umbilical vein endothelial cells (EC) after induced co-internalization of 2 μm latex microspheres and PtP-C343. 87 ± 3 % of the total number of microspheres were internalized, of which 86 ±7 % contained PtP-C343. 2P excitation was the same as in the experiments (e, f) in Figure 4. a) Overlaid phase-contrasted and conventional fluorescence images show several cells with nuclei stained by a blue fluorescent dye (DAPI). The cell marked by the square contains several vesicles, where microspheres (white) are surrounded by the probe solution (red). b) Magnification (3.75-fold) of the perinuclear region of a selected cell. Small vesicles containing the probe, but no microspheres, appear as reddish dots around the nucleus. c) The same cell viewed through the eye-piece of the two-photon imaging microscope. The scanned area (square) and the nucleus (dashed line) are marked. d) Integrated intensity image of phosphorescence (50 × 50 pixels2). e) Phosphorescence lifetime image. f) Nucleus of a cell surrounded by internalized micro-spheres. g) Integrated intensity image of phosphorescence and the emission spectra (to the left) collected from the areas 1–3 (marked by the squares). h) Phosphorescence lifetime image. i) pO2 image calculated from the lifetime image (h).

