Abstract
The statistical properties of the spontaneous background electrocorticogram (ECoG) were modeled, starting with random numbers, constraining the distributions, and identifying characteristic deviations from randomness in ECoG from subjects at rest and during intentional behaviors. The ECoG had been recorded through 8 × 8 arrays of 64 electrodes, from the surfaces of auditory, visual, or somatic cortices of 9 rabbits, and from the inferotemporal cortex of a human subject. Power spectral densities (PSD) in coordinates of log10 power versus log10 frequency of ECoG from subjects at rest usually conformed to noise in power-law distributions in a continuum. PSD of ECoG from active subjects usually deviated from noise in having peaks in log10 power above the power-law line in various frequency bands. The analytic signals from the Hilbert transform after band pass filtering in the beta and gamma ranges revealed beats from interference among distributed frequencies in band pass filtered noise called Rayleigh noise. The beats were displayed as repetitive down spikes in log10 analytic power. Repetition rates were proportional to filter bandwidths for all center frequencies. Resting ECoG often gave histograms of the magnitudes and intervals of down spikes that conformed to noise. Histograms from active ECoG often deviated from noise in Rayleigh distributions of down spike intervals by giving what are called Rice (Mathematical analysis of random noise—and appendixes—technical publications monograph B-1589. Bell Telephone Labs Inc., New York, 1950) distributions. Adding power to noise as signals at single frequencies simulated those deviations. The beats in dynamic theory are deemed essential for perception, by gating beta and gamma bursts at theta rates through enhancement of the cortical signal-to-noise ratio in exceptionally deep down spikes called null spikes.
Keywords: Black noise, Null spike, Power-law PSD, Random noise, Rayleigh distribution, Rice distribution, Spontaneous background activity, Theta–gamma linkage
Introduction
The brain continually exhibits neural activity whether its body is behaving or at rest. At rest or in expectancy this activity is called spontaneous or background activity. When the brain initiates intentional behavior and receives an expected stimulus, the appearance of brain activity changes from this background in directions that are related to the kind of stimulus and what sort of intentional behavior emerges (Freeman 2006b, 2007d). The obvious evolutionary advantage of having the background activity, despite its high metabolic cost, lies in the readiness of the brain to respond to any environmental threat or opportunity with minimal delay. The problem addressed here is to describe the biophysical properties of the cortical background activity, so as to explain how the brain can so abruptly transit from rest to intentional action. The proposed solution is to ascribe to the brain the state of criticality. This is a term borrowed from physics to designate a state in which the brain is on the edge of a transition between states, such that a small push by microscopic activation energy, can initiate a large-scale, high-energy change of state in the brain. That process is at the heart of perception, by which the action potentials relaying a microscopic conditioned stimulus (CS) to a sensory cortex can quickly galvanize the brain and body into intentional action.
The hypothesis is proposed here that the brain at rest or in expectancy holds itself in a state of self-organized criticality (SOC). The archetype for this state is the cone of sand in an hourglass that by avalanches (sudden state transitions) maintains its critical slope under continuous increase in height (Jensen 1998). Many physicists regard the concept as lacking in theoretical substance; nevertheless it usefully describes the spatiotemporal appearance of the ECoG on the surface of sensory cortex, which resembles a pan of boiling water holding itself at its critical temperature (Freeman 2004b, 2007b). That brain state of readiness can also be described as metastable (Kelso 1995; Bressler and Kelso 2001) and itinerant (Tsuda 2001). The transition from rest or expectancy to action can be triggered by a stimulus or by unknown brain processes, but with an unpredictable endogenous delay (Freeman 2007c). The focus in this report is on the properties of an event manifested in a recurrent discontinuity in the analytic phase derived from band pass filtered ECoG. The event is a repetitive abrupt decrease in the analytic power in filtered ECoG called a down spike. The down spikes occur by interference among continuously distributed frequencies. The mixing gives Rayleigh noise from intermittent cancellation and summation. The deepest of the down spikes <10−4 from the maximal power are called null spikes (Freeman et al. 2008).
This report is focused on the questions raised by (Rice 1950): what is the repetition rate of down spikes, and how is it related to the width of the pass band for signals in the ECoG? The questions are important, because these beats may be closely related to the speed of perception. It is already known that beats in band pass filtered EEG (Freeman et al. 2003) and ECoG (Freeman 2004a, b) tend to recur at theta frequencies, and that beta and gamma bursts likewise recur in what is known as the theta–gamma linkage in activity which is found in allocortical ECoG (Freeman 1975; Fell et al. 2003; Lisman 2005), neocortical ECoG (Chrobak and Buzsáki 1998; Freeman 2005b), and human scalp EEG (Schack et al. 2002; Freeman et al. 2003; Canolty et al. 2006). Success in simulations of this cross-spectral linkage with filtered noise would provide strong evidence that the background activity of brains emerges from noise. If it could be shown how the background activity in brains originates in random noise, that finding would facilitate the detection of brain signals and help to define the elusive and uncertain state of rest in the brain. It would aid in the detection of distortions and artifacts in data analysis, by giving a canonical form for the PSD of resting ECoG. Deviations from that form would constitute either signals or non-random artifacts.
Most importantly, the triggering by null spikes from narrow band carrier frequencies of transitions could then be explored in terms of a remarkably simple neural mechanism for cinematographic framing in perception (Freeman 2007c): beats with intervals in what is called the Rice distribution (after Rice 1950) may trigger phase transitions that form beta and gamma bursts in frames at theta rates. Their durations are longer than can be expected from randomness (Freeman 2004a, b). The Rice statistics may explain that finding and provide parameters with which to search for and identify behaviorally related spatial amplitude modulated (AM) patterns with narrow band carrier frequencies (Freeman 2005b).
Methods
The ECoG data used in this study were from 9 rabbits (Barrie et al. 1996) in a classical conditioning paradigm for reinforcement learning in perceptual discrimination, and a neurosurgical patient (Freeman et al. 2006) at rest, asleep, or engaged in various intentional behaviors. ECoG were recorded with 8 × 8 arrays of electrode on the surface of sensory cortex (visual, auditory or somatic in rabbit) or right inferior temporal gyrus in human. Digitizing rates were 500/s for rabbit and 200/s for human; analog filtering was 0.1–100 Hz. The signals were stored in 6 s blocks conforming to defined behavioral states of rest and arousal, expectancy and action, as well as slow wave sleep in human. For statistical purposes sets of 10 blocks (60 s) were concatenated.
Brown noise (PSD with slope = −2, 1/f2) was constructed by cumulative summation of random numbers in the normal density distribution with zero mean and unit SD (Schroeder 1991; Freeman et al. 2008). Black noise (PSD having slopes < −2) was generated by summing simulated impulse responses of an excitatory population (Freeman 1975; Freeman and Zhai 2009), which were approximated by the sum of two exponential terms corresponding to the rates of rise and decay of the transitory increase in firing rates displayed in post stimulus time histograms of action potentials from excitatory neurons. The rate of rise determined the slope of the PSD; the rate of decay determined the break frequency at which the flat spectrum changed to the linear decrease in log10 power with increasing log10 frequency. The kernel was initiated repeatedly by a simulated Poisson pulse process with an exponential distribution of pulse intervals and terminated when it fell to 10−9 of its maximum.
Simulated noise was generated in sets of 10 blocks (60 s) after a transient period of approaching the steady state. It was ‘digitized’ (truncated) and band pass filtered in simulation of the acquisition of the ECoG. The ECoG and simulated signals were filtered in 60 s epochs with a finite-impulse-response band pass filter (MATLAB fir1). Spectra were calculated with the multitaper window (Percival and Walden 1993) (MATLAB pmtm) and displayed in log-log coordinates. Conformance to a straight line in the range of interest (3–100 Hz) was better than with the Welch method (MATLAB pwelch). The choice of the order of the filter depended on the digitizing step of 2 or 5 ms and the width of the pass band. Empirically order 500 gave invariance of the distribution of minimal amplitudes in null spikes over wide pass bands (>8 Hz). For pass bands ≤8 Hz order 4,000 was needed irrespective of center frequency to mitigate filter noise. For ease of comparison across wide frequency bands, four combined center frequencies and bandwidths were defined and applied in geometric ratios roughly corresponding to clinical decompositions (Table 1 in Freeman et al. 2008). Otherwise the bandwidth was fixed at widths from 4 to 32 Hz with center frequencies stepped upward in 2–8 Hz steps from 8 to 80 Hz.
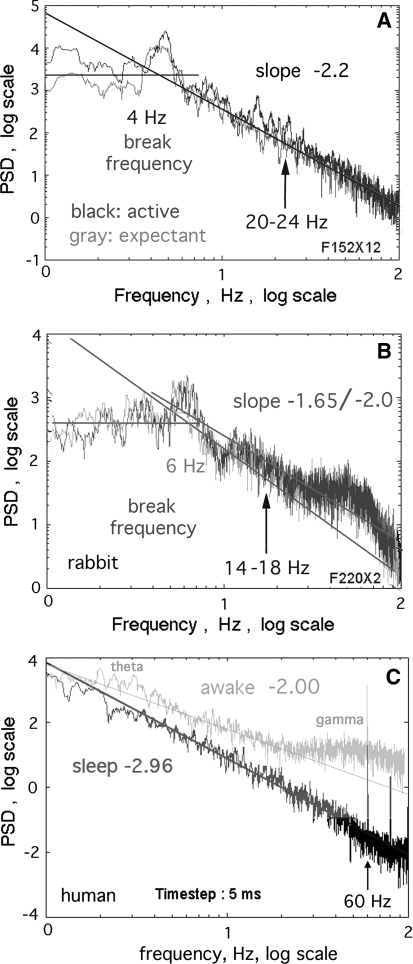
The ECoG and noise signals generated in sets of 64 were inspected as time series and as PSD in the range of 1–100 Hz (Fig. 1). The PSD slope of brown noise was uniformly −2 over the whole range. The PSD of black noise and ECoG had a low frequency segment that was treated as flat on average (assumed to conform to white noise 1/f0) up to an inflection at the break frequency between 2 and 7 Hz. Above that point the log power in most PSD fell nearly linearly with increasing log frequency (Fig. 1a). The slopes of PSD were determined by linear regression in the upper range or by fitting a line by eye to a perceived trend through the troughs of irregular PSD (Fig. 1b) to identify peaks above the trend line (Freeman and Zhai 2009).
Fig. 1.
a Power spectral density (PSD) in coordinates of log10 frequency versus log10 power in most resting ECoG conformed to a power-law distribution in the range of ~7–100 Hz with a plateau at lower frequencies. Lines were fitted visually through troughs in order to estimate the location of peaks and the slope of an embedding continuous distribution of power. b The empirical estimates of slope were consistently steeper than estimates from linear regression. c The human PSD had steeper slopes in sleep (dark curve) than in awake (light curve) states (Freeman et al. 2006). Arrows show the locations of the pass bands used in Fig. 6 and Fig. 7
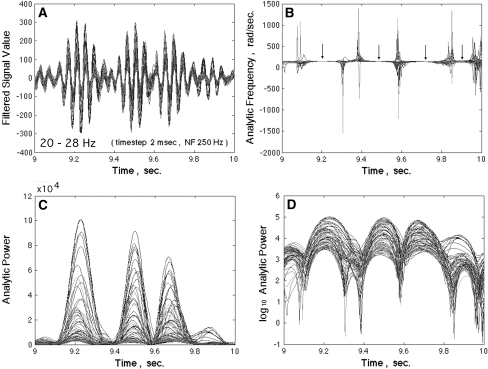
A band pass filter was applied to every signal in each 60 s block. Sets of 64 signals or noise were displayed superimposed (Fig. 2a). The Hilbert transform (Freeman 2007a) was applied to every filtered signal to calculate the analytic signal for each pass band at each time step. The analytic phase was given by the arctangent of the ratio of the imaginary part to the real part. After unwrapping, the analytic phase difference was calculated for each step by subtracting the preceding value of phase as the reference. The difference in radians was divided by the digitizing step in s to give the analytic “instantaneous” frequency in radians/s (Fig. 2b). The analytic power (c) was given by the sum of squares of the real part (the ECoG) and imaginary part (from the Hilbert transform). The log10 analytic power was used to display the down spikes as -v- (d). The time intervals between successive down spikes in ms were determined by calculating successive differences in analytic power as an approximation for the time derivative. Down spikes were identified by the change in sign of successive power differences from negative to positive.
Fig. 2.
a The 64 ECoG signals were band pass filtered and superimposed. b The analytic frequencies spiked at times when the analytic power approached zero in c. The spatial dispersion of the analytic frequencies also spiked, as measured by the spatial standard deviation of the analytic frequency, SDX(t) (not shown). The arrows indicate the approximate location of the minima in SDX(t). d The log10 of analytic power showed down spikes that were clustered but not synchronized at zero lag. Those <10−4 were labeled null spikes (Freeman et al. 2008)
The distributions of values for log10 power and the time intervals between successive upturns at minima were displayed in histograms. The designation of null spike was reserved to those with power <10−4 from maximal in the interval, on the basis of the repetition rate of AM patterns that could be classified with conditioned stimuli (CS), giving the expected number of down spikes in the length of the epoch analyzed (Fig. 4d in Freeman et al. 2008). The interval histograms were bimodal. The longer durations forming the main peak corresponded to the intervals between null spikes. The lesser peak was fixed close to twice the digitizing step with an exponential tail. The number of ultra short durations increased with decrease in the width of the pass band. They were treated as filter artifacts on the following grounds. Simulated analog pre-filtering at 1 Hz and truncation to 12 bits as by the ADC for the ECoG reduced them in brown and black noise. They were further reduced in all data by increasing the order of the filter in inverse relation to the bandwidth, e.g., from order 500 for 16 Hz bandwidth to 4,000 for 4 Hz bandwidth. Modal values of the histograms were estimated from the maxima after exclusion of values in the lower mode by a threshold dependent on bandwidth, e.g., 17 ms at 16 Hz, 51 ms at 2 Hz.
Results
Spectral analysis of ECoG
The typical form of the PSD from the ECoG in rest or expectancy was linear fall-off in log10 power with increasing log10 frequency above a break frequency (Fig. 1a). One rabbit gave peaks and troughs that consistently deviated from the power-law form in both expectancy and action (b). The segments above and below the break displayed irregular deviations as peaks and troughs from a trend line. Comparison of PSD from rabbits in the expectant control state versus the active test state showed that peaks were more likely to appear or be enhanced in the active state but in different spectral locations. The brute force method for estimating the slope of the PSD was to fix a range from 3 to 100 Hz above an estimated break frequency and fit a straight line by the criterion of least mean square residuals. The mean slope for the 9 subjects, −2.04 ± 0.32, was close to the value of the slope for brown noise (1/f2). At frequencies lower than the break point the PSD fluctuated about a slope near zero on average.
The alternative method used here to estimate slope was to postulate that the resting dynamics was a random process (Freeman and Zhai 2009), from which deviations emerged as non-random excess power above the power-law relation. Then a straight line was drawn by hand (Fig. 1) to conform to a perceived trend through troughs, so as to highlight peaks. Power at lower frequencies was assumed to be uniformly distributed with a slope of 0, white noise, 1/f0, as the basis for determining the break frequency. The 9 subjects gave a mean value of 4.6 ± 1.8 Hz with a range of 2–7 Hz. In the upper segment the estimated average slope over the 9 rabbits was −2.37 ± 0.22, which was significantly steeper than the slope for brown noise and the values from regression. Slopes steeper than −2 conformed to black noise (Schroeder 1991; Freeman and Zhai 2009). This approach often failed to highlight the emergence of excess power in theta, beta and gamma peaks in the transition from the control state to the active state in rabbits (Fig. 1a, b) but did so consistently in the transition from sleep to awake in the human subject (c). In all subjects the distribution of power was continuous across the spectral ranges of interest.
Appearance of the Rayleigh distribution
The sum of two sine waves differing only in frequency gives beats at the difference frequency. Rice (1950) displayed the distributions of beats that occurred on the application of a band pass filter to white noise and proved that the modal beat frequency was 0.641 times the filter bandwidth, independently of the central frequency of the pass band, owing to the self-similarity in the continuous spectrum. Here the same phenomenon of beats was found in brown and black noise and in ECoG.
In the example in Fig. 2a the pass band set at 20–28 Hz (bandwidth 8 Hz) gave the 64 superimposed ECoG signals that also gave the PSD in Fig. 1a. The analytic power of the signals (c) quantified the interference that gave the bursts. The log10 of the analytic power, A2(t), gave sharper temporal resolution of the epochs of low power (d). At these transient minima in each ECoG signal the analytic phase was undefined, so the values deviated widely. The successive phase differences in radians divided by the digitizing step in s gave the analytic frequency in rad/s. Division by 2π gave the frequency in Hz. The indeterminacy at down spikes gave a high spatial standard deviation, SDX(t), in analytic frequency. The low values of A2(t) and high values of SDX(t) tended to repeat in coordinated analytic phase differences (CAPD) at which a discontinuity was observed in analytic phase (Freeman et al. 2003, 2008; Freeman 2005b). Between the down spikes the analytic frequency fluctuated near the spectrally weighted mean of the pass band (here 23 Hz, 145 rad/s). The SDX(t) was narrowly distributed in each interspike segment, as reflected in the tight clustering of superimposed 64 analytic frequencies indicated by the 4 arrows in Fig. 2b.
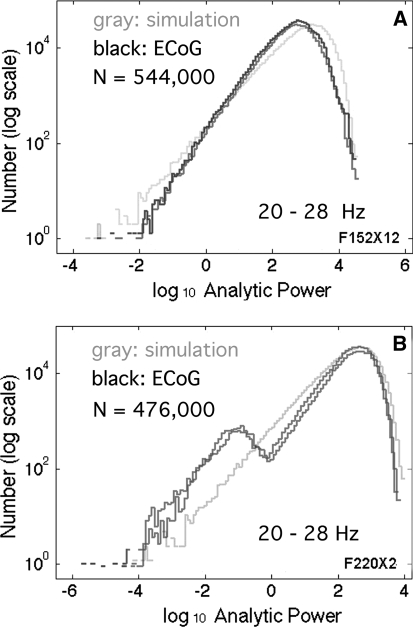
Time series of log10 A2(t) from the filtered resting ECoG (Fig. 2d) were often indistinguishable from the simulated time series by visual inspection. Self-similarity was verified across the four pass bands examined corresponding to theta, alpha, beta and low gamma (Table 1 in Freeman et al. 2008) by adjusting the segment time duration to match the wavelength of the center frequency of the pass band of the power-law PSD. Likewise the histograms of the analytic power were invariant across the four ranges for both ECoG and simulated noise, when the PSD conformed to the power-law distribution (Fig. 3a). When the PSD did not conform (Fig 1b), then histograms of the ECoG analytic power deviated from the simulated brown or black noise in proportion to the magnitude of deviations from 1/f in the PSD (Fig. 3b).
Fig. 3.
a The histograms of log10 analytic power, A2(t) (dark curves), which came from rabbit and human ECoG that had power-law PSD (Fig. 1a, c), closely conformed to the histogram (light curve) from black noise generated from random numbers. b Histograms from ECoG (dark curves) with PSD that deviated from power-law (Fig. 1b) deviated from the histogram (light curve) of black noise. Deviations occurred at either high, low, or both ends of the distributions
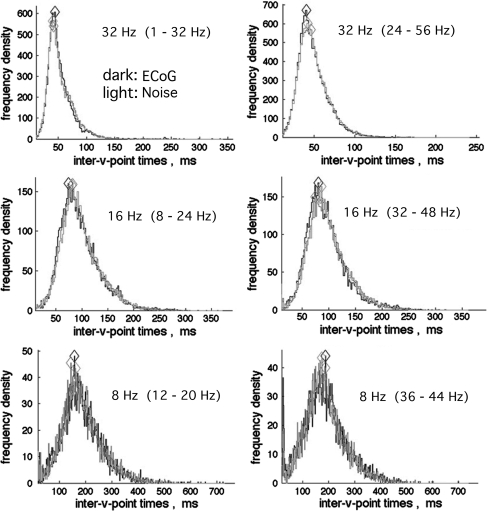
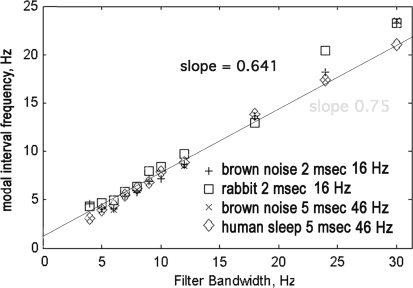
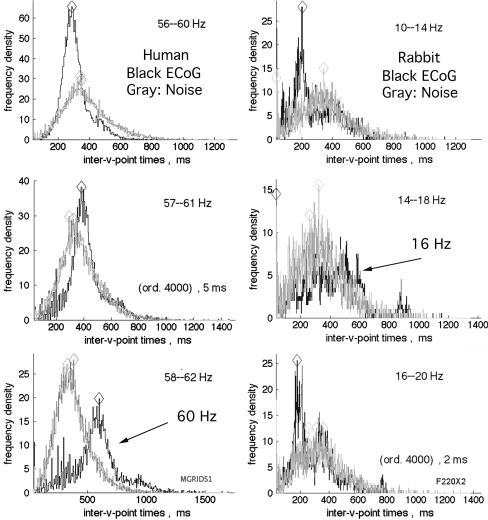
The histograms of the intervals between down spikes (Fig. 4) were likewise invariant after scaling in accordance with the center frequencies of the pass bands. The distributions for intervals from most ECoG signals in broad pass bands both at rest and in action were indistinguishable from brown and black noise. These distributions were designated as Rayleigh distributions. The modal intervals decreased in proportion to the bandwidth. In contrast, they were independent of center frequency. For any fixed duration of analysis (here 17 s, 9,500 samples on 64 signals) the number of down spikes diminished with decreasing interval; correspondingly the precision of estimates in histograms decreased. The modal intervals in ms determined from the maxima in the expected range (diamond symbols in Fig. 4) were re-expressed as modal frequencies in Hz. When the bandwidth was fixed and the center frequency was stepped in 2 or 4 Hz increments from 12 to 80 Hz, the modal frequencies were independent of center frequency. The test was repeated with pass bands of 4, 8, 16, and 32 Hz with center frequencies of 16, 32, and 48 Hz. The relation of modal frequency to bandwidth was tested for 11 pass bands 4–32 Hz wide at center frequencies of 16, 32, 48, and 64 Hz. Modal frequencies in Hz were proportional to the bandwidth in Hz by a factor of 0.641 (Fig. 5), as predicted by Rice (1950, Sect. 3.8, p 90, Eqs. 3.8–15). The same relation was found for both real and simulated data from human and rabbit, but with higher modal values than predicted for rabbit ECoG at larger bandwidths (here 24 and 32 Hz).
Fig. 4.
The histograms of time intervals between down spikes from rabbit and human ECoG were indistinguishable from interval histograms of simulated brown noise and black noise, here superimposed, for pass bands exceeding 8 Hz. The modal values of intervals (diamonds) decreased in proportion to increasing bandwidths at all center frequencies tested in the beta–gamma ranges. The lower right histogram shows part of the leftpeak of the bimodal distribution, which was attributed to filter noise and removed from the displays by truncation
Fig. 5.
The modal frequency (1,000/modal interval in ms) varied with the bandwidth of the filter in Hz for center frequencies of 16, 31, and 46 Hz, for rabbit and human, active and asleep, ECoG and simulations with random noise. The proportionality of modal frequency to bandwidth in Hz was 1:0.641 (Rice 1950). This summary diagram includes 2 species, 2 digitizing rates, and 2 center frequencies. The deviation for rabbit data at 24 and 32 Hz bandwidth might have been caused by a deficit in short durations from the non-ideal band pass filter noise
Appearance of the Rice distribution
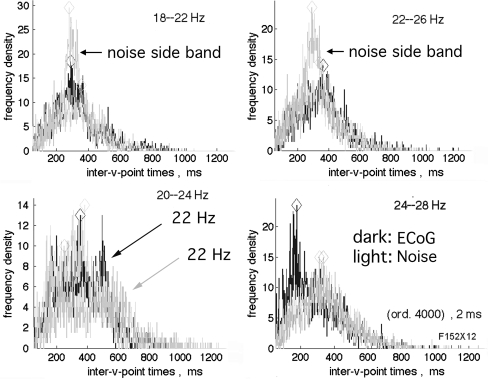
The histograms of the intervals between down spikes from ECoG for pass bands at and near 4 Hz occasionally showed a characteristic pattern, in which there was a deficit of values near the modal interval for Rayleigh distributions and an excess of long intervals. On either side of that narrow pass band symmetrically there were side bands in which a deficit at the modal interval was accompanied by an excess of short intervals. This pattern was first noted in human ECoG with a 4 Hz pass band centered at the 60 Hz spectral spike known to be line noise (Fig. 6, left 3 frames) and also at a subsidiary spectral spike at 80 Hz (Fig. 1c). The pattern was thereafter identified in the ECoG from all 9 rabbits at least once and in 6/9 at 2–4 center frequencies, ranging across the beta–gamma spectrum from 16 to 88 Hz (Fig. 6, right 3 frames). This pattern was more easily detected by the side lobes of shorter durations than by the central mode of long durations. The pattern, now designated as the Rice distribution, was more clearly seen in ECoG giving PSD with prominent peaks in the beta and gamma ranges (comparing Fig. 1b with Fig. 6, right and Fig. 1a with Fig. 7). The pattern of modal shifts was easily replicated at any frequency, for example 22 Hz by adding a 22 Hz cosine with power ~10× the prevailing level of brown or black power at that frequency (Fig. 7). This demonstration was by adding a steady state oscillation at one frequency and fixed amplitude. The modal shifts in the ECoG appeared to be transient and in narrow but changing spectral bands. Reducing the duration of analysis below 17 s decreased the resolution; increasing the bandwidth of analysis increased the number of data points but with unacceptable loss of resolution of the modal shifts, so the events forming the Rice distribution remained close to the limits of detection by this method.
Fig. 6.
Left frames The interval histograms of inter-v-times for human ECoG in sleep conformed to those for the Rayleigh distribution for all center frequencies except for some of those within a 4 Hz pass band. When the narrow pass band was centered at a non-random peak, here 60 Hz line noise, the modal interval was nearly doubled, giving the Rice distribution (Rice 1950). Symmetric side lobes gave modal intervals shorter than those from Rayleigh noise. Dark ECoG. Light noise. Right frames The Rice distribution with side lobes was most clearly found in ECoG data giving PSD most strongly deviating from power-law (Fig. 1b). Rice distributions were found in the ECoG from the 9 rabbits at least once and usually several times. The side lobes were more easily found than the central longer durations
Fig. 7.
The Rice distribution in a rabbit ECoG centered at 22 Hz was simulated with either brown or black noise by adding a cosine with frequency fixed at 22 Hz and amplitude 0.02 SD of the white noise before summing. The PSD for the histograms is in Fig. 1a
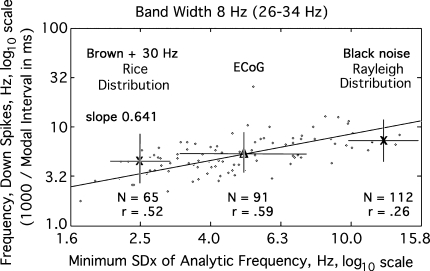
An alternative approach was devised, taking advantage of the spontaneous variation in the spatial variation of the analytic frequency (Fig. 2b). The minimal value of SDX(t) in each interval between down spikes was chosen as a measure of the self-determined bandwidth of the carrier frequency shared by the population during that interval and displayed by the synchronized oscillations (Fig. 2a). The minimal value in each interval between spikes (arrows) was calculated in Hz as the independent variable and plotted against modal frequency in Hz from 1,000/duration of the interval in ms (Fig. 8). The fixed bandwidth was initially set at 8 Hz, because it was the lower threshold for conformance of the interval histograms to random noise (Fig. 4), and it gave the widest distribution of the values of the minimum in SDX(t), SDXm, about the mean (Δ), with the least variation in modal frequency. The slope of the relation in log–log coordinates was again near 0.641 as predicted by Rice for white noise (Rice 1950). Black noise and brown noise both gave constricted Rayleigh distributions at the upper end of the range of minimal SDXm(t) values (Fig. 8, right X) that had no correlation with variation in interval durations. These patterns were seen for center frequencies ranging from 20 to 80 Hz. The highest correlation between minimum SDXm and modal frequency was found with a pass band center frequency of 30 Hz.
Fig. 8.
The reciprocal of the duration of each interval between down spikes is expressed in Hz and plotted (dots) as a function of the minimal spatial standard deviation, SDXm, of the analytic frequency in Hz (mean Δ), serving as a measure of the intrinsic bandwidth of the oscillations centered at 30 Hz. The slope of the line is 0.641. The variation in SDXm (bars) was greater for ECoG than for either brown or black noise (right X). A 30 Hz cosine was added to the brown noise (left X). The modal shift was modeled by adding a sine wave to random noise (Fig. 6; Rice 1950, Sect. 3.10, pp. 104–113)
The hypothesis that the recurrence rate was dependent on the bandwidth was tested by calculating the correlation between the minimum, SDXm, of the spatial standard deviation of the analytic frequency, SDX(t), in each interval between down spikes, as a measure of the width of the endogenous pass band, and the reciprocal of the interval. The test was replicated on data from 9 rabbits, yielding a group mean correlation coefficient by z-transform, r = 0.60 ± 0.06. A significant negative correlation (−0.75 ± 0.06) was also found in all subjects between the minimal dispersion of frequencies, SDXm, and the maximal analytic power, A2(t) in successive intervals (Table 1).
Table 1.
Modal frequencies (MF), bandwidths (SDX), and analytic power (AP), A2 (t) are shown for three bandwidths of the filtered ECoG of rabbits centered at 30 Hz
| Modal frequency (MF) | Number (N) | Frequency dispersion SDXm (Hz) | Correlation r(MF,SDXm) | Analytic power (AP) | Correlation r(AP,SDXm) |
|---|---|---|---|---|---|
| 4 Hz band | |||||
| 2.1 Hz | 67 | 6.1 Hz | 0.68 | 102 | −0.75 |
| ±0.7 | ±7 | ±2.2 | ±0.14 | ±49 | ±0.10 |
| 8 Hz band | |||||
| 3.8 Hz | 110 | 7.3 Hz | 0.60 | 235 | −0.75 |
| ±1.4 | ±1.2 | ±0.06 | ±120 | ±0.06 | |
| 16 Hz band | |||||
| 7.4 Hz | 189 | 10.8 Hz | 0.58 | 501 | −0.77 |
| ±2.6 | ±4 | ±0.3 | ±0.03 | ±268 | ±0.04 |
Group means ± SD are from 9 rabbits at the three fixed bandwidths. MF is modal frequency from 1,000/inter-v-spike interval in ms. SDXm is the minimum of the spatial standard deviation of the 64 analytic frequencies in each interval in Hz. AP is the mean analytic power in arbitrary units. Mean correlation values are by z-transform
Simulation by adding a cosine at 30 Hz to black or brown noise produced the Rice distribution (Fig. 8, left X), which showed that the minimal values, SDXm, of SDX(t) were reduced well below the ECoG mean (Δ). The low repetition rates of down spikes reflected the long durations of the interspike intervals that contained power at a fixed frequency embedded in the brown or black noise. Four salient features were found in Fig. 8. The distribution of bandwidths along the abscissa was broad compared to the narrow distribution of the modal frequencies of the down spikes along the ordinate. The modal frequencies were concentrated in the theta range (3–7 Hz) and lower part of the alpha range (8–12 Hz). The Rayleigh distributions for both black and brown noise were concentrated at the upper end of the ECoG distribution. The Rice distributions for both black and brown noise were concentrated near the lower end of the ECoG distribution. These features are consistent with prior findings that the longer ECoG frames between down spikes have carrier oscillations at nearly fixed frequencies (Fig. A1.08 in Freeman 2004a; Sect. 3.4 and Fig. 2.06, E in Freeman 2004b, 2005b).
The analysis was repeated for fixed bandwidths of 4 and 16 Hz. The same four features emerged as in Fig. 8 but with differing mean frequencies (Table 1). However, filtrates in the 4 Hz bandwidth gave repetition rates mainly below the theta range, while filtrates in the 16 Hz bandwidth gave rates mainly above the theta range. Given the strong evidence for theta–gamma linkage, the implication is that the endogenous frequency dispersion in carrier waves is within the range of 6–10 Hz, and that the dispersion cumulatively can account for the strong negative correlation between SDX(t) and analytic power, A2(t), and for the gradual termination of the synchronized oscillations in the carrier waves of AM patterns.
Discussion
Two salient findings emerged in this study. First, the power in oscillatory mesoscopic cortical activity was distributed in a continuum across the clinical spectrum, so that beats in the amplitude of band pass filtered ECoG appeared at varying intervals with a modal value that was governed by the bandwidth whatever the center frequency. Second, the modal value was lengthened at the frequency of an imposed fixed frequency, while the modal values in the sidebands were shortened. Rice (1950) predicted the prolongation for white noise and proposed that it might be used to find narrow band signals embedded in noise. His proposal might be realized for ECoG, if the neural mechanism for these phenomena in the brain can be explained. To that end four questions need answers. What is the mechanism by which cortex generates self-stabilized ECoG conforming to black noise with power-law PSD slopes of −2 to −4? What is the neural mechanism for band pass filtering in the beta–gamma range? How does that mechanism give beats in beta and gamma oscillations repeating in the theta range? What role might the beats play in perception?
The origin and stabilization of black noise in mutual excitation
The continuously distributed microscopic background noise in cortex is familiar to everyone who has recorded extracellular action potentials constituting background firing, which on audio display has the sound of waterfalls, and which is easily simulated with normally distributed random numbers about zero mean. Cumulative summing white noise (1/f0) gives brown noise (1/f2). However, that is not a realistic model for background ECoG, because the sustained excitatory activity that is essential for neural oscillations is always above zero, and its steady state is maintained by refractory periods (Freeman 1975) that limit the pass band. The summing of incoming pulse trains, each of which in the background state resembles a Poisson process that is modified by the refractory periods (the exponential distribution in an interval histogram has a brief dead time at zero), is performed by the dendrites. The kernel of integration is not that of the microscopic postsynaptic potential of the single isolated neuron. It is the mesoscopic population impulse response to electrical stimulation, which has a rapid exponential increase and a prolonged exponential decay (Freeman 1975; Freeman and Zhai 2009). Modeling the population impulse responses to electrical stimulation with differential equations has shown that mutual excitation in a cortical population of excitatory neurons can explain the steady state and its stabilization by refractory periods. When the background activity is high with respect to the activity evoked by input, the PSD has a slope near −2 (brown noise). When the amplitude of the background activity is low with respect to the amplitude of the input-dependent activity, the PSD has a slope averaging near −3 (black noise), as seen in human ECoG in slow wave sleep (Freeman et al. 2006). This method for generating black noise gives time series, analytic power histograms, and down spike interval histograms that are indistinguishable from those of brown noise and resting ECoG in all respects, except that the slope of brown noise is fixed at −2, and those for black noise range from −2 to −4. Hence resting ECoG is not completely random; it is homeostatically self-regulated noise with a variable set point under neurohumoral control (Freeman 2005a).
Cortical synaptic interactions provide distributed band pass filters
The interaction among excitatory and inhibitory neurons operates like a band pass filter. The filtering operation is performed in cortex through the negative feedback that is provided to pyramidal cells by inhibitory interneurons. The proof is provided by showing that the oscillatory impulse responses (averaged evoked potentials and post stimulus time histograms) of the excitatory and inhibitory populations oscillate with the same frequency and decay rate, but with phase lag on average of inhibitory output behind excitatory output by π/2 radians (90°) (Freeman 1975). The basal frequencies in the gamma range are determined by the passive membrane rate constants, because local axonal propagation delays are negligible. Beta frequencies are lower because the interconnections are more widespread and include significant axonal conduction delays among more widely distributed populations (Freeman 1975, 2006a, 2007b; Freeman and Burke 2003; Freeman and Rogers 2003). The variations in the microscopic sizes, numbers and states of polarization of neurons, the distances and velocities of communication, and the strengths of mutual excitation and mutual inhibition relative to negative feedback strength all contribute to the breadth of distributions and variations in the center frequencies of the mesoscopic oscillations. At rest the cortical dynamics tends to symmetry, in which the three types of feedback (negative, mutual excitation, mutual inhibition) are balanced, giving the power-law PSD observed in resting ECoG that contains power at all frequencies in a spectral continuum (Freeman 1975). How that symmetry is stabilized and maintained long-term by cortical growth processes remains to be determined.
Determinants of beat frequencies
The mix of two frequencies gives beats at the difference frequency. Rice (1950) proved that the mix of the continuous distribution of frequencies across the pass band of a filter applied to white noise gave beats at a distribution of intervals, for which the mode was inversely proportional to the band width in Hz. The demonstration was here empirically extended to brown and black noise, despite interference from ultra short intervals of fluctuations introduced by the non-ideal FIR filter. These fluctuations appeared equally in processed ECoG and noise, so that the pre-emption of long intervals by the short intervals may have systematically reduced the estimates of the modal repetition rates of down spikes below putative true values (e.g., Fig. 5). Further developments are needed in mathematics to derive equations with which to predict the forms of the empirical Rayleigh and Rice distributions for black noise, and to devise a band pass filter closer to the desired ideal filter of Rice. The immediate problems are to specify the determinants of the theta–gamma linkage in terms of the width of the pass band that causes the beats. Is a Gaussian distribution the best description of the frequency distribution in a pass band? Is the minimal spatial SDXm of the analytic frequency in a frame the optimal measure? Can the null spikes in multiple frequency bands be related to the theta oscillation in the ECoG, to account for observed phase relationships in theta–gamma linkage? How can the apparent periodicity of theta waves be simulated? Can the analysis be extended to alpha waves, which were not found in the rabbit data nor investigated in this study of the human data?
The proposed role of beats in perception
The theoretical significance of the exceptionally deep down spike (the null spike) in perception has been developed elsewhere in the context of many-body physics (Freeman and Vitiello 2006), random graph theory (Freeman et al. 2008), renormalization group theory (Freeman and Cao 2008), and nonequilibrium thermodynamics (Freeman 2008). The evidence from many laboratories has proved that the relayed action potentials from an expected CS excite a Hebbian nerve cell assembly in cortex formed in prior learning. The firing of neurons in the microscopic assembly is sustained for tens of ms, perhaps up to half a second or more. In that time period one to three spatial patterns of amplitude modulation (AM) patterns emerge in the ECoG, which are classifiable with the class of stimulus that the animal has been trained to expect (Barrie et al. 1996; Freeman 2005b). However, the times of onset vary unpredictably, so they must be endogenously determined. Detailed examination has shown that the onset of each AM pattern is demarcated by a discontinuity in the analytic phase that is accompanied by a down spike in CAPD. That suggests that a down spike can trigger a phase transition. The recurrence rates of classifiable AM patterns in the gamma range in comparison to the histograms of analytic power (Fig. 3) suggest that the threshold for a null spike triggering a new AM pattern may be <10−4 below the sustained power levels (Fig. 4 in Freeman et al. 2008). The null spike raises the signal-to-noise ratio of the evoked power to the background power dramatically in the pass band. As the noise drops, cortex drives itself inexorably to a singularity (Fig. 6.30, p. 388 in Freeman 1975) and to spontaneous symmetry breaking (Freeman and Vitiello 2006). When the power in that pass band returns to pre-spike levels, the AM pattern corresponding to the stimulus-selected Hebbian assembly is correlated with a correct CR, which implies that the CS has been recognized by recall of a memory.
According to this hypothesis the ECoG is the epiphenomenal manifestation of the order that masses of neurons impose on themselves by their widespread synaptic interactions, so it is an order parameter (Haken 1983). The null spike initiates a brief period of disorder, in which the population freed from mesoscopic order can respond to the input provided by an activated Hebbian assembly. The attractive feature of this hypothesis is that the gate to each new phase transition is an intrinsic property of the background noise. The observed distribution of minimal SDXm (Fig. 2) supports the empirical hypothesis that the theta–gamma linkage is modeled by Rice statistics, when sustained oscillation seen as the carrier wave from narrow-band, neural negative feedback enables an AM pattern to emerge from the background noise. The parameters of long interval duration and low SDXm (Fig. 8) may serve as markers in the search for AM patterns, as Rice proposed. Further testing of this hypothesis will be facilitated by new ECoG data acquired at higher spatial and temporal resolution (larger windows provided by dense arrays with more electrodes and faster digitizing rates) than those available at the time the present data were collected.
Acknowledgments
The author is grateful to Brian Burke and William Redfearn for programming in MATLAB.
Open Access This article is distributed under the terms of the Creative Commons Attribution Noncommercial License which permits any noncommercial use, distribution, and reproduction in any medium, provided the original author(s) and source are credited.
References
- Barrie JM, Freeman WJ, Lenhart M (1996) Modulation by discriminative training of spatial patterns of gamma EEG amplitude and phase in neocortex of rabbits. J Neurophysiol 76:520–539 [DOI] [PubMed]
- Bressler SL, Kelso JAS (2001) Cortical coordination dynamics and cognition. Trends Cogn Sci 5:2–36. doi:10.1016/S1364-6613(00)01564-3 [DOI] [PubMed]
- Canolty RT, Edwards E, Dalal SS, Soltani M, Nagarajan SS, Kirsch HE, Berger MS, Barbaro NM, Knight RT (2006) High gamma power is phase-locked to theta oscillations in human neocortex. Science 313(5793):1626–1628. doi:10.1126/science.1128115 [DOI] [PMC free article] [PubMed]
- Chrobak JJ, Buzsáki G (1998) Gamma oscillations in the entorhinal cortex of the freely behaving rat. J Neurosci 18(1):388–393 [DOI] [PMC free article] [PubMed]
- Fell J, Klaver P, Elfadil H, Schaller C, Elger CE, Fernández G (2003) Rhinal–hippocampal theta coherence during declarative memory formation: interaction with gamma synchronization? Eur J NeuroSci 17(5):1082–1088. doi:10.1046/j.1460-9568.2003.02522.x [DOI] [PubMed]
- Freeman WJ (1975) Mass action in the nervous system. Academic Press. © 2004, New York. http://sulcus.berkeley.edu/MANSWWW/MANSWWW.html
- Freeman WJ (2004a) Origin, structure, and role of background EEG activity. Part 1. Analytic amplitude. Clin Neurophysiol 115:2077–2088. doi:10.1016/j.clinph.2004.02.029. http://repositories.cdlib.org/postprints/1006 [DOI] [PubMed]
- Freeman WJ (2004b) Origin, structure, and role of background EEG activity. Part 2. Analytic phase. Clin Neurophysiol 115:2089–2107. doi:10.1016/j.clinph.2004.02.028. http://repositories.cdlib.org/postprints/987 [DOI] [PubMed]
- Freeman WJ (2005a) NDN, volume transmission, and self-organization in brain dynamics. J Integr Neurosci 4(4):407–421. doi:10.1142/S0219635205000963 [DOI] [PubMed]
- Freeman WJ (2005b) Origin, structure, and role of background EEG activity. Part 3. Neural frame classification. Clin Neurophysiol 116(5):1118–1129. http://repositories.cdlib.org/postprints/2134/. doi:10.1016/j.clinph.2004.12.023 [DOI] [PubMed]
- Freeman WJ (2006a) Origin, structure, and role of background EEG activity. Part 4. Neural frame simulation. Clin Neurophysiol 117:572–589. doi:10.1016/j.clinph.2005.10.025 [DOI] [PubMed]
- Freeman WJ (2006b) Definitions of state variables and state space for brain-computer interface. Part 1. Multiple hierarchical levels of brain function. Cogn Neurodyn 1(1):13–14. http://dx.doi.org/10.1007/s11571-006-9001-x [DOI] [PMC free article] [PubMed]
- Freeman WJ (2007a) Hilbert transform for brain waves. Encyclopedia for computational neuroscience In: Izhikevich E (ed) http://www.scholarpedia.org/article/Hilbert_transform_for brain_waves
- Freeman WJ (2007b) Scale-free neocortical dynamics. Encyclopedia for computational neuroscience In: Izhikevich E (ed) http://www.scholarpedia.org/article/Scale-free_neocortical_dynamics
- Freeman WJ (2007c) Proposed cortical “shutter” mechanism in cinematographic perception. In: Perlovsky L, Kozma R (eds) Neurodynamics of cognition and consciousness. Springer, Heidelberg, pp 11–38
- Freeman WJ (2007d) Definitions of state variables and state space for brain-computer interface. Part 2. Extraction and classification of feature vectors. Cogn Neurodyn 1(2):85–96. doi:10.1007/s11571-006-9002-9 [DOI] [PMC free article] [PubMed]
- Freeman WJ (2008) A thermodynamic model of the action-perception cycle in brain dynamics. Chap. 29. In: Wang R et al (eds) Advances in cognitive neurodynamics ICCN 2007. Springer, Heidelberg, pp 165–170
- Freeman WJ, Burke BC (2003) A neurobiological theory of meaning in perception. Part 4. Multicortical patterns of amplitude modulation in gamma EEG. Int J Bifurcat Chaos 13:2857–2866. doi:10.1142/S0218127403008302 [DOI]
- Freeman WJ, Cao Y (2008) Proposed renormalization group analysis of nonlinear brain dynamics at criticality. Chap. 27. In: Wang R et al (eds) Advances in cognitive neurodynamics ICCN 2007. Springer, Heidelberg, pp 147–158
- Freeman WJ, Erwin H (2008) Freeman K-set. Scholarpedia 3(2):3238. http://www.scholarpedia.org/article/Freeman_K-set
- Freeman WJ, Rogers LJ (2003) A neurobiological theory of meaning in perception. Part 5. Multicortical patterns of phase modulation in gamma EEG. Int J Bifurcat Chaos 13:2867–2887. doi:10.1142/S0218127403008296 [DOI]
- Freeman WJ, Vitiello G (2006) Nonlinear brain dynamics as macroscopic manifestation of underlying many-body field dynamics. Phys Life Rev 3:93–118. http://dx.doi.org/10.1016/j.plrev.2006.02.001. doi:10.1016/j.plrev.2006.02.001
- Freeman WJ, Zhai J (2009) Simulated power spectral density (PSD) of background electrocorticogram (ECoG). Cogn Neurodyn 3(1). doi:10.1007/s11571-008-9064-y [DOI] [PMC free article] [PubMed]
- Freeman WJ, Burke BC, Holmes MD (2003) Aperiodic phase re-setting in scalp EEG of beta–gamma oscillations by state transitions at alpha–theta rates. Hum Brain Mapp 19(4):248–272. doi:10.1002/hbm.10120 [DOI] [PMC free article] [PubMed]
- Freeman WJ, Holmes MD, West GA, Vanhatalo S (2006) Fine spatiotemporal structure of phase in human intracranial EEG. Clin Neurophysiol 117:1228–1243. doi:10.1016/j.clinph.2006.03.012 [DOI] [PubMed]
- Freeman WJ, Bollobás B, Kozma R (2008a) Scale-free cortical planar networks. Handbook of large-scale random networks. Bolyai Math Soc Springer, Budapest. http://www.springer.com/math/numbers/book/978-3-540-69394-9
- Freeman WJ, Kozma R, Bollobás B, Riordan O (2008b) Scale-free cortical planar networks. Handbook of large-scale random networks. Bolyai Mathematical Society of Budapest, Springer. http://www.springer.com/math/numbers/book/978-3-540-69394-9
- Freeman WJ, O’Nuillain S, Rodriguez J (2008c) Simulating resting cortical background activity with filtered noise. J Integr Neurosci 7(3):337–344. doi:10.1142/S0219635208001885 [DOI] [PubMed]
- Haken H (1983) Synergetics. An introduction. Springer, Berlin
- Jensen HJ (1998) Self-organized criticality: emergent complex behavior in physical and biological systems. Cambridge University Press, New York
- Kelso JAS (1995) Dynamic patterns: the self organization of brain and behavior. MIT Press, Cambridge
- Lisman J (2005) The theta/gamma discrete phase code occuring during the hippocampal phase precession may be a more general brain coding scheme. Hippocampus 15(7):913–922. doi:10.1002/hipo.20121 [DOI] [PubMed]
- Percival DB, Walden AT (1993) Spectral analysis for physical applications: multitaper and conventional univariate techniques. Cambridge University Press, Cambridge
- Rice SO (1950) Mathematical analysis of random noise—and appendixes—technical publications monograph B-1589. Bell Telephone Labs Inc., New York
- Schack B, Vath N, Petsche H, Geissler H-G, Möller E (2002) Phase-coupling of theta–gamma EEG rhythms during short-term memory processing. Int J Psychophysiol 44(2):143–163. doi:10.1016/S0167-8760(01)00199-4 [DOI] [PubMed]
- Schroeder M (1991) Fractals, chaos, power laws. Minutes from an infinite paradise. WH Freeman, San Francisco
- Tsuda I (2001) Toward an interpretation of dynamics neural activity in terms of chaotic dynamical systems. Behav Brain Sci 24: 793–847 [DOI] [PubMed]


