

Abstract
Conventional NMR approaches to detect weak protein binding and aggregation are hindered by the increased viscosity brought about by crowding. We describe a simple and reliable NMR method to distinguish viscosity effects from binding and aggregation under crowded conditions.
In cells, the concentration of macromolecules can reach ~400g/L, which makes the cell interior a heterogeneous and crowded environment.1 Two consequences of crowding are high viscosity and more occupied space (excluded volume), both of which can affect the protein folding, ligand binding and protein-protein interactions.2 Excluded volume effects on protein folding, stability and function have been studied under artificial crowded conditions by using high concentrations of synthetic polymers or proteins.3–7 In such studies, the crowding agent must be chemically inert with respect to the test protein. Without this property, effects attributed to excluded volume may be the result of weak interactions between the crowding molecule and the test protein or interactions of the test protein with itself. Therefore, it is important to characterize these weak interactions to distinguish crowding effects from non-specific binding.
NMR is well suited to study weak, transient complex formation in dilute solution.8 Under crowded conditions, however, the increased viscosity interferences with these NMR-based approaches. Here, we describe an NMR method that distinguishes viscosity effects from binding and self association in crowded solutions using a model system that contains milimolar concentrations (2–9 mg/ml) of chymotrypsin inhibitor 2 (CI2, 7.2 kDa, pI, 6.5) in 200 g/L bovine serum albumin (BSA, 66.4 kDa, pI, 4.7).
Two-dimensional heteronuclear single quantum correlation spectroscopy (HSQC) is widely used to detect weak protein interactions.8, 9 Crowley et al. applied this approach to show that cytochrome c interacts with the crowding agent poly(ethylene glycol).9 For CI2, although some small chemical shift changes are detected in BSA (Supporting information, Figure S1), this experiment does not tell us whether the changes reflect CI2-BSA binding, CI2-CI2 association, or small structural perturbations. The translational diffusion coefficient is widely used to characterize protein binding and aggregation in dilute solutions.10–12 Under crowded conditions, diffusion is determined by the solution viscosity (Table S1).
Heteronuclear spin-relaxation is a powerful tool for probing both the overall and the internal dynamics of proteins in dilute solution.13,14 It is also utilized to characterize protein-ligand interactions, protein-protein interactions, and aggregation in dilute solution through measurement of the rotational correlation time, τc.15–18 In crowded solutions, however, high viscosity, binding or self association will also increase τc, making it difficult to distinguish these instances. Kneller et al. show that the product of the longitudinal and transverse relaxation rates (R1 and R2) for a single population of protein is a constant that is independent of tc and anisotropic motion.19 A protein without conformational exchange has a maximum R1R2 value, which is defined as the rigid limit. When a protein binds another protein, simulation shows that the product of R1R2 exceeds the rigid limit even in the absence of conformational exchange.
Simulated values of R1R2 for CI2 in 200 g/L BSA as function of monomer mole fraction of CI2 are shown in Figure 1. R1R2 for the CI2•BSA heterodimer is sensitive to the mole fraction, even when the dimer fraction is small. The maximum R1R2 value of 65 s−2 occurs when the solution contains half monomer and half heterodimer. The CI2•CI2 homodimer shows the same trend, but the amplitude is smaller. Thus, the value of R1R2 appears to be a sensitive method that distinguishes binding from the effects of viscosity.
Figure 1.

Simulated product of R1R2 for CI2 in 200 g/L BSA, assuming only CI2•BSA heterodimers (black squares) or CI2•CI2 homodimers (red circles) as a function of the monomer fraction of CI2. The rigid limit is shown as a dashed line. The smooth curves are polynominal fits of no theoretical significance. These data are valid at 600 MHz for τc values ≥ 7 ns.
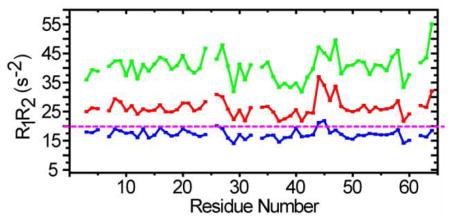
To test this idea, R1R2 values for CI2 in 42% glycerol (to satisfy the criterion ωτc≫1), and in 200 g/L BSA at pH 5.4 and 6.8 were measured as a function of residue number (Figure 2). The R1R2 values for most residues in glycerol are below the rigid limit line, but a few experience conformational exchange. The R1R2 values in BSA at pH 5.4 and 6.8 show similar patterns to those acquired in 42% glycerol, but all values are above the rigid limit line. The values at pH 6.8 are larger than those at pH 5.4, suggesting increased complex formation at the higher pH. In the simulation, the maximum value of R1R2 is 23 s−2 for the CI2 monomer-dimer equilibrium. The experimentally observed average value is 40 s−2 at pH 6.8 and 27 s−2 at pH 5.4. Comparing these observations to the simulation suggest that the increase of R1R2 is mainly caused by the interaction of CI2 with BSA. The pH dependence suggests that the interaction is electrostatic.
Figure 2.

Histograms of R1R2 values as a function of residue number for CI2 at 25 °C in 42% glycerol (blue) and 200 g/L BSA at pH 5.4 (red) and pH 6.8 (green). The rigid limit is also shown.
Although formation of a CI2•BSA complex appears to be the main cause of the high R1R2 values, there might also be a contribution from CI2 homodimer formation20,21 To investigate this possibility, we examined R2 as a function of CI2 concentration in dilute solution and in 200 g/L BSA at pH 5.4. The averaged R2 values for all residues at each of four CI2 concentrations are shown in Figure 3. R2 increases with concentration in both dilute solution and in 200 g/L BSA, as expected for protein self association. In dilute solution the behavior is consistent with formation of a CI2 homodimer with a Kd of 50 mM. If CI2 only binds BSA, simulation shows that R2 should decrease with CI2 concentration. On the other hand, the simulated R2 values increase with concentration when CI2 forms both homodimers and a CI2•BSA heterodimer. This increase in R2 values is also observed experimentally, suggesting that CI2 form a homodimer, but that BSA has only a small effect on formation of the CI2 dimer compared to dilute solution.
Figure 3.

Simulated (curves) and measured (points) R2 values as a function of CI2 concentration in 200 g/L BSA (green and blue) and in buffer (cyan and orange) at pH 5.4 in sodium acetate buffer. The dashed green curve represents a CI2 homodimer (Kd = 15 mM) plus a CI2•BSA heterodimer (Kd = 35 mM). The red curve represents a CI2•BSA heterodimer (Kd = 35 mM). The dashed cyan curve represents a CI2 homodimer in (Kd = 50 mM).
Histograms of R2 values as a function of concentration are shown in Figure 4. The R2 patterns along the sequence in buffer and 200 g/L BSA are similar, suggesting that no additional intra-molecular conformational exchange occurs under crowded conditions.
Figure 4.

Histograms of R2 values as a function of residue number for 0.2 mM (black), 0.4 mM (blue), 0.8 mM (green) and 1.2 mM (red) CI2 at pH 5.4 in sodium acetate buffer (bottom) and in 200g/L BSA (top). The uncertainties ≤ 2% and are not shown.
We described and demonstrated here an NMR method to differentiate viscosity and binding effects under crowded conditions. The method is based on the fact that R1R2 is independent of viscosity and the fact that the R2 concentration dependence responds differently and sensitively to binding and self-association. The requirement that ωτc ≫ 1 is satisfied for most proteins in crowded conditions at high magnetic fields, so the method is general and can identify interactions of a 15N enriched test protein in cells or in artificial crowding environments.
Experiments aimed at quantifying the effects of excluded volume on protein chemistry must be insensitive to the unavoidable increase in viscosity brought about by crowding. At the same time such experiments must remain sensitive to non-specific binding brought about by such large solute concentration. The product of R1 and R2 provides a simple and reliable way to screen for truly inert crowding agents and test proteins.
In addition, binding affinities can be estimated by combining relaxation data with results from hydrodynamic calculations. CI2 self-association is enhanced slightly in 200g/L BSA compared to dilute solution. We cannot, however, quantify the enhancement because of the inherent uncertainties in the parameters used in the hydrodynamics calculations. It is likely that the observed CI2-BSA binding mitigates the increase in CI2 self-association expected from excluded volume effects. This conclusion shows the importance of choosing an “inert” crowding agent to study the effects of macromolecular crowding.9
Supplementary Material
Sample preparation, NMR measurements, hydrodynamics calculations and simulations. This material is available free of charge via the Internet at http://pubs.acs.org.
Acknowledgments
This research was supported by a National Institutes of Health Director’s Pioneer Award (5DP10D783) and a grant from National Science Foundation (MCB 0516547). We thank Asha Lakkavaram for help preparing CI2 samples.
References
- 1.Zimmerman SB, Trach SO. J Mol Biol. 1991;222:599–620. doi: 10.1016/0022-2836(91)90499-v. [DOI] [PubMed] [Google Scholar]
- 2.Minton AP, Wilf J. Biochemstry. 1981;20:4821–6. doi: 10.1021/bi00520a003. [DOI] [PubMed] [Google Scholar]
- 3.Ai X, Zhou Z, Bai Y, Choy WY. J Am Chem Soc. 2006;128:3916–7. doi: 10.1021/ja057832n. [DOI] [PubMed] [Google Scholar]
- 4.Charlton LM, Barnes CO, Li C, Orans J, Young GB, Pielak GJ. J Am Chem Soc. 2008;130:6826–30. doi: 10.1021/ja8005995. [DOI] [PMC free article] [PubMed] [Google Scholar]
- 5.Jiang M, Guo Z. J Am Chem Soc. 2007;129:730–1. doi: 10.1021/ja065064+. [DOI] [PubMed] [Google Scholar]
- 6.Totani K, Ihara Y, Matsuo I, Ito Y. J Am Chem Soc. 2008;130:2101–7. doi: 10.1021/ja077570k. [DOI] [PubMed] [Google Scholar]
- 7.Zhou HX, Rivas GN, Minton AP. Ann Rev Biophys. 2008;37:375–397. doi: 10.1146/annurev.biophys.37.032807.125817. [DOI] [PMC free article] [PubMed] [Google Scholar]
- 8.Vaynberg J, Qin J. Trends Biotechnol. 2006;24:22–7. doi: 10.1016/j.tibtech.2005.09.006. [DOI] [PubMed] [Google Scholar]
- 9.Crowley PB, Brett K, Muldoon J. Chembiochem. 2008;9:685–8. doi: 10.1002/cbic.200700603. [DOI] [PubMed] [Google Scholar]
- 10.Lin M, Larive CK. Anal Biochem. 1995;229:214–20. doi: 10.1006/abio.1995.1405. [DOI] [PubMed] [Google Scholar]
- 11.Ilyina E, Roongta V, Pan H, Woodward C, Mayo KH. Biochemistry. 1997;36:3383–8. doi: 10.1021/bi9622229. [DOI] [PubMed] [Google Scholar]
- 12.Nesmelova IV, Fedotov VD. Biochim Biophys Acta. 1998;1383:311–6. doi: 10.1016/s0167-4838(97)00224-0. [DOI] [PubMed] [Google Scholar]
- 13.Korzhnev DM, Kay LE. Acc Chem Res. 2008;41:442–51. doi: 10.1021/ar700189y. [DOI] [PubMed] [Google Scholar]
- 14.Palmer AG, 3rd, Massi F. Chem Rev. 2006;106:1700–19. doi: 10.1021/cr0404287. [DOI] [PubMed] [Google Scholar]
- 15.Bernado P, Akerud T, Garcia de la Torre J, Akke M, Pons M. J Am Chem Soc. 2003;125:916–23. doi: 10.1021/ja027836h. [DOI] [PubMed] [Google Scholar]
- 16.Blobel J, Schmidl S, Vidal D, Nisius L, Bernado P, Millet O, Brunner E, Pons M. J Am Chem Soc. 2007;129:5946–53. doi: 10.1021/ja069144p. [DOI] [PubMed] [Google Scholar]
- 17.Su XC, Jergic S, Ozawa K, Burns ND, Dixon NE, Otting G. J Biomol NMR. 2007;38:65–72. doi: 10.1007/s10858-007-9147-9. [DOI] [PubMed] [Google Scholar]
- 18.Chen K, Bachtiar I, Piszczek G, Bouamr F, Carter C, Tjandra N. Biochemstry. 2008;47:1928–37. doi: 10.1021/bi701984h. [DOI] [PMC free article] [PubMed] [Google Scholar]
- 19.Kneller JM, Lu M, Bracken C. J Am Chem Soc. 2002;124:1852–1853. doi: 10.1021/ja017461k. [DOI] [PubMed] [Google Scholar]
- 20.Snoussi K, Halle B. Biophys J. 2005;88:2855–66. doi: 10.1529/biophysj.104.055871. [DOI] [PMC free article] [PubMed] [Google Scholar]
- 21.Cann JR, Coombs RO, Howlett GJ, Jacobsen MP, Winzor DJ. Biochemstry. 1994;33:10185–90. doi: 10.1021/bi00199a047. [DOI] [PubMed] [Google Scholar]
Associated Data
This section collects any data citations, data availability statements, or supplementary materials included in this article.
Supplementary Materials
Sample preparation, NMR measurements, hydrodynamics calculations and simulations. This material is available free of charge via the Internet at http://pubs.acs.org.