

Abstract
Background
Oxidative stress (OS) and inflammatory mediators increase with aging. The levels of advanced glycation endproducts (AGEs), prooxidant factors linked to chronic diseases such as diabetes, cardiovascular disease, and renal disease, also increase with aging. AGEs are readily derived from heat-treated foods. We propose that the excess consumption of certain AGEs via the diet enhances OS and inflammatory responses in healthy adults, especially in elderly persons.
Methods
We examined 172 young (<45 years old) and older (>60 years old) healthy individuals to determine whether the concentration of specific serum AGEs (Nε-carboxymethyl-lysine [CML] or methylglyoxal [MG] derivatives) were higher in older compared to younger persons and whether, independent of age, they correlated with the intake of dietary AGEs, as well as with circulating markers of OS and inflammation.
Results
Body weight, body mass index (BMI), and serum AGE, CML, and MG derivatives were higher in older participants, independent of gender. Serum CML correlated with levels of 8-isoprostanes (r =0.448, p =.0001) as well as with Homeostasis Model Assessment index (HOMA), an index of insulin resistance (r = 0.247, p = .044). The consumption of dietary AGEs, but not of calories, correlated independently with circulating AGEs (CML: r =0.415, p = .0001 and MG: r = 0.282, p = .002) as well as with high sensitivity C-reactive protein (hsCRP) (r = 0.200, p = .042).
Conclusions
Circulating indicators of AGEs (CML and MG derivatives), although elevated in older participants, correlate with indicators of inflammation and OS across all ages. Indicators of both AGEs and OS are directly influenced by the intake of dietary AGEs, independent of age or energy intake. Thus, reduced consumption of these oxidants may prove a safe economic policy to prevent age-related diseases, especially in an aging population.
There is clear evidence that oxidative stress (OS) increases with aging (1,2) and plays a pathophysiologic role in chronic diseases highly prevalent in older persons, such as cardiovascular disease (CVD), renal disease, and diabetes (3–6). Although the causes of increased OS in aging are not clear, excessive production of reactive oxygen species (ROS), and thus elevated OS, has been associated with several metabolic factors, including hyperglycemia, hyperlipidemia, and high levels of advanced glycation endproducts (AGEs).
AGEs, also termed glycotoxins, are well-known triggers of excess ROS and abnormally high OS (7,8). They also stimulate the synthesis and release of proinflammatory cytokines, setting the stage for sustained activation of innate immunity responses through the activation of transcriptional factors such as nuclear factor-kappa B (NF-κB) (9,10). AGEs are spontaneously produced in human tissues and the circulation as a part of normal metabolism, but are especially elevated in diabetic patients. Elevated levels of AGEs are clinically important because they are associated with CVD, with and without diabetes (11,12). Although standardized AGE assays are not yet available in most clinical laboratories, specific immunoassays exist for the detection of several representative types of AGEs that are present in human serum, urine, tissues, as well as in dietary products (13,14). The assays most frequently used are based on immunoreactivity probes for Nε-carboxymethyl-lysine (CML) or methylglyoxal (MG) derivatives (13–15). Although it has been proposed that environmentally induced chronic OS can be attributed to many factors (2), such as a high-fat diet, recent evidence suggests that OS may be affected by oxidants present in standard nonfat diets (10,16). High levels of oxidants, such as AGEs, are spontaneously generated in standard diets, where proteins and lipids, mixed with reactive sugars are routinely processed under elevated temperatures, as in broiling, roasting, or grilling (17–19). AGEs such as CML and MG derivatives are prime examples of dietary oxidants (13). Recently, the levels of inflammatory molecules such as tumor necrosis factor-alpha (TNF-α) and high sensitivity C-reactive protein (hsCRP) were reported to be reduced in diabetic and nondiabetic uremic patients fed a diet which had a low content of AGEs, obtained by applying reduced heat during preparation (10,20). Long-term reduction of heat-enhanced dietary AGEs in mice attenuates insulin resistance and prevents the development of diabetes and diabetic vascular and renal complications, and improves impaired wound healing (21–26). Furthermore, life-long exposure of normal mice to an isocaloric diet with modestly reduced AGEs (by 50%) prevented the anticipated age-linked OS and insulin resistance, resulting in a significantly extended life span (27).
Based on the potential prooxidant effects of standard diets with high AGE content, and the observation that OS often antedates the clinical manifestations of age-related chronic disorders (28,29), we reasoned that systemic glycotoxins accumulate with age probably as a result of life-long exposure to high levels of AGEs in the diet. This hypothesis had not been previously explored in healthy persons. We thus proposed that AGE intake correlates with circulating glycotoxin levels and that both serum glycotoxins and dietary AGE intake correlate with markers of OS and inflammation, independent of age. The results presented in this study lend support to these hypotheses.
Participants and Methods
Main Study
The study included 172 clinically healthy volunteers, 70 men and 102 women, distributed in two age groups, a younger (aged 18–45 years; n = 116) and an older (aged 60–80 years; n =56). Overall, 69% of the participants were Caucasian (n =118), 17% Asian (n =30), and 14% African American (n = 24). Exclusion criteria included a history of diabetes, hypertension, renal disease, CVD, and diseases that are associated with inflammation or excessive OS. All participants were healthy by routine physical examination, medical history, anthropometry, and routine clinical chemistry measurements. Demographic data, body weight, height, percentage of body fat, fasting blood samples, 24-hour urine collection, and 3-day dietary food records were obtained at baseline. Participants maintained their usual diet and level of physical activity. The Mount Sinai School of Medicine Institutional Review Board approved the study protocol and consent form. All participants were given a detailed description of the study and provided written informed consent.
Body mass index (BMI) was calculated from body weight and height by the standard formula: BMI = (weight in kg/height in m2). Percent body fat was estimated by measuring body bioimpedance using the Tanita Bodyfat Analyzer TBF-105 (Arlington Heights, IL). In this method, the participants stand barefoot over a small platform; the analyzer generates weight, lean body mass, and % body fat. Creatinine clearance in mL/min/1.73m2 was calculated by the standard formula: creatinine clearance = (amount creatinine excreted in 24-hour urine/plasma creatinine) and normalized for 1.73 m2.
Blood glucose, fasting plasma insulin (FI), plasma lipids, and plasma and urinary creatinine were measured in the hospital clinical laboratory. Serum samples were tested for two common protein-derived and lipid-derived AGEs—a stable glycoxidative product, εN-carboxymethyl-lysine (CML) (4G9 MAb; Alteon, Inc., Northvale, NJ), and an AGE precursor, less stable derivative of methylglyoxal (MG) (MG3D11), as previously described (13–15). Unless otherwise stated, the term AGEs indicates CML immunoreactivity associated with both proteins and lipids. FI, 8-isoprostane, and vascular cell adhesion molecule (VCAM-1) were measured using commercial enzyme-linked immunosorbent assay (ELISA) kits (30,31). TNF-α was measured in peripheral blood mononuclear cells isolated from freshly drawn blood using a commercial ELISA kit (10). We measured hsCRP by using nephelometry and an IMMAGE Protein Analyzer (Beckman Coulter, Brea, CA) (31). Insulin resistance was calculated according to the Homeostasis Model Assessment (HOMA) index as: FI × Fasting glucose/22.5, where FI is insulin in microunits/mL and fasting glucose is expressed in mmol/L (32).
Daily dietary intake of AGEs was estimated from 3-day food records, which emphasized information on cooking modalities, and used a database of > 250 foods with known AGE values (17). Data were expressed as AGE Equivalents per day (Eq/d) (1000 AGE kU is equal to 1 AGE equivalent) (17). Nutrient intake was estimated using a nutrient software program (Food Processor version 7.6; ESHA Research, Salem, OR).
Statistical Analysis
The Kolmogorov–Smirnov goodness-of-fit test was used to test for normal distribution. Because hsCRP, VCAM-1, 8-isoprsotanes, and TNF-α had a skewed distribution, they were used log transformed in the analyses. Data are presented as mean ± standard error of the mean (SEM) in the tables and figures. Differences of mean values between groups were tested by unpaired Student t test or analysis of variance (ANOVA) (followed by Bonferroni correction for multiple comparisons), depending on the number of groups. Correlation analyses were evaluated by Pearson’s correlation coefficient. Stepwise multiple regression analysis was performed to assess variables that were independently associated with AGEs in the diet: serum CML (sCML), hsCRP, VCAM-1, TNF-α, 8-isoprostane, and HOMA. Linear regression models were used to examine the relationship of age and gender to each biochemical parameter measured. Significant differences were defined as a p value < .05 and are based on two-sided tests. Data were analyzed using the SPSS statistical program (SPSS 14.0 for Windows, Chicago, IL).
Results
General Characteristics
The mean body weight and BMI, FI, fasting plasma glucose, lipids, and renal function were all within the accepted normal range (Table 1). The percentage of body fat was higher in older participants, although no age-related change of caloric intake was noted. Results are presented separately for men and women because in many hypothetical models we found a significant AGE and gender interaction, and men were heavier than women. Although women as a group had a higher percentage of body fat than men had, there was a significant age-related increase in percent body fat in men. Older age was associated with significantly higher fasting blood glucose and low-density lipoprotein cholesterol as well as with inflammatory markers hsCRP and fibrinogen (Table 1). Compared to men, women had significantly higher serum high-density lipoprotein cholesterol and lower low-density lipoprotein cholesterol. Also, women had a lower intake of calories, proteins, and carbohydrates than men did. In general, older age was associated with lower renal function, based on creatinine clearance, and lower daily AGE intake (Table 1).
Table 1.
Selected Demographics and Clinical and Biochemical Parameters in the Study Population
| Parameters | Men <45 y | Men >60 y | Women <45 y | Women >60 y | Age × Effect | Gender × Effect |
|---|---|---|---|---|---|---|
| Age, y | 31 ± 0.8 | 69 ± 1.5 | 31.3 ± 0.7 | 70 ± 1.5 | NA | NA |
| Weight, kg | 78 ± 1.5 | 82 ± 4.0 | 66 ± 1.7 | 63 ± 2.0 | .859 | .001 |
| BMI, kg/m2 | 25 ± 0.5 | 27 ± 1.0 | 24.3 ± 0.6 | 24.6 ± 0.9 | .256 | .210 |
| Body fat, % | 18 ± 2.0 | 25.5 ± 1.5 | 31 ± 1.4 | 32.7 ± 1.7 | .044 | .001 |
| Glucose, mg/dL | 72 ± 3.0 | 82 ± 4.0 | 71 ± 1.7 | 86 ± 4.0 | .002 | .823 |
| Insulin, μU/mL | 8.3 ± 1.1 | 6.9 ± 1.0 | 8 ± 0.6 | 7.4 ± 0.8 | .511 | .820 |
| HOMA | 1.4 ± 0.2 | 1.4 ± 0.2 | 1.4 ± 0.1 | 1.5 ± 0.1 | .740 | .736 |
| HDL cholesterol, mg/dL | 48 ± 3.0 | 53 ± 4.0 | 63 ± 2.0 | 74 ± 3.0 | .182 | .001 |
| LDL cholesterol, mg/dL | 121 ± 6.5 | 111 ± 7.0 | 104 ± 5.0 | 121 ± 5.9 | .001 | .249 |
| Triglycerides, mg/dL | 107 ± 15.0 | 99 ± 12.0 | 65 ± 4.6 | 98 ± 11.0 | .208 | .057 |
| Creat cl, mL/min/1.73m2 | 116 ± 7.0 | 89 ± 8.0 | 118 ± 8.3 | 86 ± 5.4 | .001 | .572 |
| Serum CML, U/mL | 8.5 ± 0.9 | 9.9 ± 1.5 | 7.9 ± 0.7 | 10.7 ± 1.1 | .001 | .333 |
| Serum MG, nmol/mL | 0.7 ± 0.1 | 1.1 ± 0.1 | 0.7 ± 0.1 | 0.91 ± 0.1 | .001 | .012 |
| hsCRP, mg/L | 2.3 ± 0.9 | 5.0 ± 1.9 | 2.2 ± 0.5 | 2.7 ± 0.8 | .016 | .220 |
| TNF-α, ng/mg | 8.4 ± 0.5 | 10.4 ± 1.1 | 9.8 ± 0.7 | 10.6 ± 0.8 | .307 | .428 |
| Fibrinogen, mg/dL | 310 ± 16.0 | 376 ± 13.0 | 329 ± 11.0 | 363 ± 11.0 | .001 | .729 |
| Caloric intake, cal/d | 2437 ± 94 | 2252 ± 224 | 1858 ± 63 | 2042 ± 214 | .254 | .0001 |
| Protein intake, g/d | 110 ± 8 | 96 ± 11 | 77 ± 4 | 80 ± 7 | .109 | .001 |
| Fat intake, g/d | 87 ± 4 | 77 ± 13 | 71 ± 4 | 79 ± 11 | .647 | .159 |
| Saturated fat intake, g/d | 27 ± 2 | 24 ± 5 | 25 ± 2 | 24 ± 4 | .451 | .326 |
| AGE intake, Eq/d | 20 ± 2 | 14 ± 2 | 15± 1 | 14 ± 2 | .012 | .007 |
Notes: Population was separated by gender and age < 45 and > 60 years. Values of p were obtained by using general linear model (GLM) analysis of covariance. An Age × Gender interaction term tested in all models was never statistically significant.
NA =not applicable; BMI =body mass index; HOMA =Homeostasis Model Assessment index; HDL =high-density lipoprotein; LDL =low-density lipoprotein; Creat cl =creatine clearance; CML =carboxymethyl-lysine; MG =methylglyoxal; hsCRP =high sensitivity C-reactive protein; TNF-α =tumor necrosis factor-alpha; AGE = advanced glycation endproduct.
Serum AGEs, CML and MG Derivatives, and Age
Older (aged >60 years) participants, both male and female, had significantly higher serum levels of two AGEs, CML and MG derivatives, compared to younger participants (aged <45 years) (Table 1, Figure 1). The association between age and serum CML (sCML), but not between age and serum MG (sMG), persisted after adjusting for BMI, gender, and caloric intake (Table 2).
Figure 1.

Levels of serum advanced glycation endproducts (AGEs), carboxymethyl-lysine (sCML) and methylglyoxal (sMG) derivatives are elevated in older men and women. Fasting blood was obtained in older (60–80 years old [y.o.]) and younger (18–45 y.o.) healthy participants for measurement of CML and MG derivatives, by enzyme-linked immunosorbent assay, as described. Data, representing the average of triplicate values, are shown as mean ± standard error of the mean, *p < .05.
Table 2.
Linear Regression Models Testing the Relationship of Circulating Levels of AGEs With Age, Gender, BMI, and Dietary Caloric Intake
| Serum CML |
Serum MG |
|||
|---|---|---|---|---|
| Independent Variables | β ± SE | p | β ± SE | p |
| Age, y | 0.010 ± 0.027 | .701 | 0.002 ± 0.002 | .172 |
| Gender | −758 ± 1.121 | .500 | 0.087 ± 0.071 | .225 |
| BMI | 0.094 ± 0.112 | .401 | 0.012 ± 0.007 | .088 |
| Caloric intake, kcal/d | 0.002 ± 0.001 | .009 | 0.005 ± 0.000 | .794 |
Note: AGEs = advanced glycation endproducts; BMI = body mass index; CML = carboxymethyl-lysine; MG = methylglyoxal; SE = standard error.
Serum AGEs (CML and MG) Correlate With Markers of OS (8-Isoprostane) and of Insulin Resistance (HOMA)
A significant correlation was observed between circulating levels of two AGEs, CML and MG (r =0.66, p < .0001) (Figure 2). A significant relationship was also noted between the levels of sCML and plasma 8-isoprostane, a marker of endogenous lipid peroxidation (Figure 3). The levels of CML but not MG derivatives were significantly associated with 8-isoprostane, after adjusting for age, gender, BMI, and caloric and dietary AGE intake. A similar association was noted between sCML levels and HOMA, an indicator of insulin resistance (Table 3).
Figure 2.

Serum carboxymethyl-lysine (sCML) levels are highly associated with levels of serum methylglyoxal derivatives (sMG). Fasting fresh blood samples obtained from study participants were used for assessment of CML and MG derivatives, by enzyme-linked immunosorbent assay. Data, representing triplicate values, are shown as linear correlations.
Figure 3.
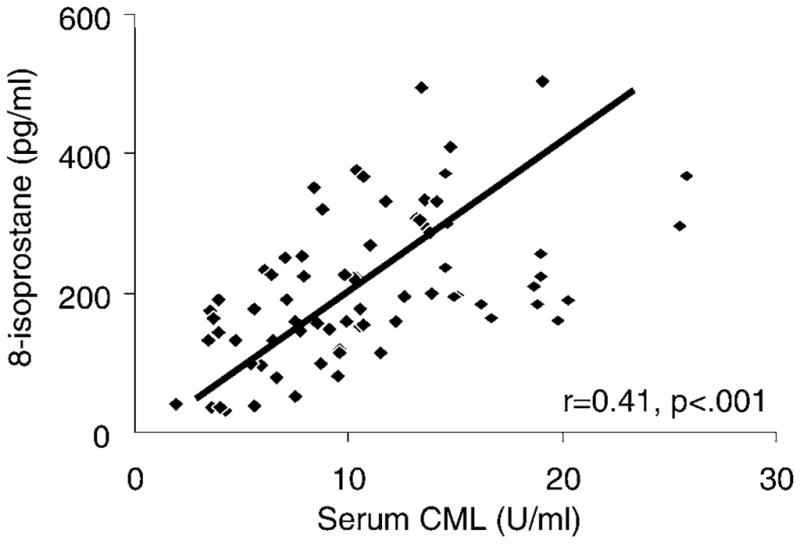
Serum carboxymethyl-lysine (sCML) levels are associated with plasma 8-isoprostane. Fasting fresh blood samples obtained from study participants were used for assessment of CML and plasma 8-isoprostanes, as described. Data are shown as linear correlations.
Table 3.
Linear Regression Models Testing the Relationship of Dietary AGE Intake With hsCRP, 8-Isoprostanes, and HOMA
| Log hsCRP |
Log 8-Isoprostane |
HOMA |
||||
|---|---|---|---|---|---|---|
| Independent Variables | β ± SE | p | β ± SE | p | β ± SE | p |
| Age, y | 0.007 ± 0.003 | .010 | −0.104 ± 0.619 | .867 | 0.002 ± 0.004 | .629 |
| Gender | 0.040 ± 0.995 | .703 | −0.107 ± 0.074 | .152 | 0.026 ± 0.182 | .886 |
| BMI | 0.066 ± 0.011 | .001 | −0.001 ± 0.007 | .894 | 0.014 ± 0.018 | .452 |
| Caloric intake, kcal/d | −0.001 ± 0.000 | .091 | −0.015 ± 0.000 | .749 | 0.001 ± 0.000 | .129 |
| AGE intake, Eq/d | 0.018 ± 0.007 | .007 | 0.002 ± 0.005 | .733 | −0.007 ± 0.011 | .498 |
| Serum CML, U/mL | −0.004 ± 0.012 | .745 | 0.210 ± 0.007 | .002 | 0.049 ± 0.020 | .019 |
| Serum MG, nmol/mL | 0.048 ± 0.184 | .795 | 0.134 ± 0.140 | .343 | −0.429 ± 0.326 | .193 |
Note: AGE = advanced glycation endproduct; hsCRP = high sensitivity C-reactive protein; HOMA = Homeostasis Model Assessment index; BMI = body mass index; CML = carboxymethyl-lysine; MG = methylglyoxal; SE = standard error.
Relationship of Serum AGEs (CML and MG) to Levels of Dietary AGE Intake
The intake of dietary AGEs was significantly associated with sCML (r =0.46, p =.0001) (Figure 4A) and sMG (r = 0.37, p = .001) (Figure 4B). Both of these associations remained significant after adjustment for age, gender, BMI, as well as caloric intake (Table 4). Neither age nor caloric intake influenced the relationships between dietary AGE intake and circulating levels of CML or MG derivatives.
Figure 4.

Dietary intake of advanced glycation endproducts (AGEs) is associated with circulating levels of carboxymethyl-lysine (CML) and methylglyoxal (MG) derivatives. Fasting fresh blood samples obtained from study participants were used for assessment of CML (A) and MG derivatives (B). Daily consumption of AGEs was assessed based on 3-day food records as described, and data are expressed as equivalents of AGE/d (1 Eq = 1 × 10³ kU AGE). Data, indicating triplicate values, are shown as linear correlations.
Table 4.
Linear Regression Models Testing the Relationship of Intake of AGEs via the Diet With Circulating Levels of AGEs (Serum CML and Serum MG)
| Serum CML |
Serum MG |
|||
|---|---|---|---|---|
| Independent Variables | β ± SE | p | β ± SE | p |
| Age, y | 0.032 ± 0.03 | .227 | 0.004 ± 0.002 | .019 |
| Gender | −1.13 ± 0.100 | .299 | 0.060 ± 0.067 | .372 |
| BMI | 0.033 ± 0.110 | .759 | 0.008 ± 0.007 | .255 |
| Caloric intake, kcal/d | 0.001 ± 0.001 | .246 | 0.000 ± 0.000 | .077 |
| AGE intake, Eq/d | 0.204 ± 0.064 | .002 | 0.015 ± 0.004 | .001 |
Note: AGEs = advanced glycation endproducts; BMI = body mass index; CML = carboxymethyl-lysine; MG = methylglyoxal; SE = standard error.
Relationship of Intake of Dietary AGEs to Inflammatory hsCRP
The intake of dietary AGEs correlated positively with serum levels of hsCRP (r = 0.200, p = .042) (Table 3). This relationship remained significant after adjusting for age, gender, BMI, caloric intake, sCML, and sMG (Table 3). We found no independent association between AGE intake and log 8-isoprostane or HOMA.
Stability of Dietary Calorie and AGE Intake
Thirty-nine participants were restudied after 6 ± 1 months. We found that caloric (1909 ± 92 vs 1886 ± 103 kcal/d, p = nonsignificant [NS]), AGE intake via the diet (15.1 ± 1.5 vs 13.8 ± 1.3 AGE Eq/d, p = NS), and sCML (9.6 ± 0.7 vs 10.2 ± 0.6 U/mL (p =NS) at the second time point were very similar to the initial evaluation, with the exception of a slight, but significant increase in sMG values (0.60 ± 0.03 vs 0.78 ± 0.05 nmol/mL, p =.02).
Discussion
Enhanced OS and elevation of markers of inflammation often occur with aging (1,2,33). We hypothesized that this age-associated trend is caused by increased levels of AGEs, which are molecules that have been found to cause OS and by this mechanism contribute to diseases such as diabetes, CVD, and renal disease (3,6,9–12). The current study demonstrates that serum levels of common AGEs, such as CML and MG derivatives, are elevated in older persons. Independent of age, the levels of glycotoxins correlated with the levels of established markers of OS and inflammation. Furthermore, the dietary intake of AGEs is an independent correlate of sCML and sMG derivatives as well as of hsCRP. These findings point to the potential role of dietary and circulating AGEs in age-related diseases, especially of older adults.
We and other groups have used CML and MG derivatives as markers of a complex array of AGEs, or glycotoxins (10,11,13–15). The highly significant correlation found between circulating levels of CML and of MG derivatives in this group of normal participants is consistent with the previous hypothesis that these derivatives represent markers of the same biological process, namely the nonenzymatic protein and lipid glycoxidation (7,34). Our data suggest that immunoassays can be used in the clinical setting, although methods of wider applicability need to be established.
The strong and direct association of serum levels of CML with those of 8-isoprostane, an indicator of endogenously generated lipid peroxidation products and a marker of OS (35,36), could be interpreted as evidence that highly reactive carbonyl intermediates such as glyoxal or MG can contribute not only to CML formation but also to lipid peroxidation (3,7,34), which could enhance 8-isoprostane formation. This association has not been previously shown in healthy humans. AGEs, attributed largely to high glycemic levels or impaired renal function (8,37), have been known to promote ROS and a wide range of inflammatory responses, via cell surface receptors, under disease conditions (10,12). Our study supports the notion that AGE-activated signal pathway(s) may affect OS levels in healthy adults. These findings would be consistent with evidence pointing to serum AGEs as a powerful risk factor for cardiovascular mortality in nondiabetic women (11). Thus, sCML may be considered as a new indicator of an underlying imbalance of OS and innate immune responses.
Based on several epidemiologic studies, a rise in OS among clinically normal individuals may be important in the pathogenesis of insulin resistance and the metabolic syndrome (28,29,33,38). The association found between sCML and HOMA levels of normal persons is suggestive of a link between metabolic processes, which may antedate insulin resistance, diabetes mellitus, or vascular dysfunction at any age (11,39). A similar relationship between high levels of circulating AGEs and insulin resistance was observed in mice, in connection to high-fat and high-AGE diet–induced diabetes (21), but not in the low-AGE–fed controls. In view of the significant correlation between sCML and consumption of dietary AGEs found in this study, together with relevant animal and human studies (10,11,20–27), an elevated sCML level may indicate a need for preventive measures. In this context, the fact that we found dietary AGE consumption to be an independent determinant of serum AGEs, CML and MG, as well as of hsCRP suggests that dietary modification may be the intervention of choice. Dietary AGEs in fact emerged as the best predictors of levels of sCML and hsCRP, even after adjusting for confounders such as age, gender, BMI, and caloric intake. These findings are in agreement with previous evidence in humans suggesting that the usual adult diet contains excessive amounts of AGEs (10,16,20) and that, when ingested in excess, they can be readily reflected in circulation and can cause systemic vascular changes (40).
AGEs are excreted by the kidneys, the normal capacity of which may be easily exceeded, especially in the presence of renal disease, diabetes, or high AGE intake. When AGEs accumulate, a large portion of ingested AGEs is retained in tissues (16,41), contributing to increased OS and ultimately, to impaired organ function. As renal function slowly diminishes with age, the ability to excrete AGEs could be further impeded (42–44), resulting in an expanded total AGE burden, especially in elderly persons. This postulate may explain the mechanism by which serum AGE levels were significantly higher in the older group than in the younger group, even though the intake of dietary AGEs by the older age group was reduced.
The content of AGEs in the food is strongly influenced by the methods of preparation, particularly, the amount and duration of exposure to heat and by the associated amount of water (17–19). Thus, methods such as frying or broiling greatly augment the AGE content of common foods, compared to boiling and steaming (17). Restricting the use of high temperature in food preparation, however modest, could lead to a significant AGE reduction in the same foods. Consuming food with low amount of AGEs may help reduce the levels of systemic glycotoxins, OS, and inflammation. This intervention may be particularly important in patients affected by diseases where OS and inflammation play an important pathophysiologic role, such as diabetes and/or renal diseases. Studies of mice fed a diet with an AGE content 50% lower than usual throughout their life showed a reduction of systemic and tissue OS, metabolic and organ changes, and more importantly, a longer life span (27). Taken together, these data may suggest that consumption of a diet which contains a moderately low amount of AGEs may be beneficial to healthy aging.
Reevaluation of the dietary calories and AGE intake 6 months after the initial data collection indicated that both remained reasonably constant in this normal population. This finding provides further validation of the instrument used in this study and suggests that this type of assessment is ready for application in larger population studies.
Conclusion
Levels of consumption of dietary AGEs directly influence systemic levels of glycotoxins, and this influence may contribute to a state of elevated OS and inflammation sustained throughout adulthood, with significant adverse health consequences for all adults, and especially for the aging population. This hypothesis should be tested in longitudinal studies and in randomized, controlled trials evaluating the effect of a low AGE dietary intervention and health outcomes.
Acknowledgments
This work was supported by the National Institute on Aging (MERIT AG-23188 and AG-09453, to H. Vlassara) and by the National Institute of Research Resources, MO1-RR-00071, awarded to the General Clinical Research Center at Mount Sinai School of Medicine.
References
- 1.Finkel T, Holbrook NJ. Oxidants, oxidative stress and the biology of ageing. Nature. 2000;408:239–247. doi: 10.1038/35041687. [DOI] [PubMed] [Google Scholar]
- 2.Stadtman ER. Protein oxidation and aging. Science. 1992;257:1220–1224. doi: 10.1126/science.1355616. [DOI] [PubMed] [Google Scholar]
- 3.Lyons TJ. Glycation and oxidation: a role in the pathogenesis of atherosclerosis. Am J Cardiol. 1993;71:26B–31B. doi: 10.1016/0002-9149(93)90142-y. [DOI] [PubMed] [Google Scholar]
- 4.Libby P. Inflammation in atherosclerosis. Nature. 2003;420:868–874. doi: 10.1038/nature01323. [DOI] [PubMed] [Google Scholar]
- 5.Pickup JC, Mattock MB, Chusney GD, Burt D. NIDDM as a disease of the innate immune system: association of acute-phase reactants and interleukin-6 with metabolic syndrome X. Diabetologia. 1997;40:1286–1292. doi: 10.1007/s001250050822. [DOI] [PubMed] [Google Scholar]
- 6.Wautier MP, Chappey O, Corda S, Stern DM, Schmidt AM, Wautier JL. Activation of NADPH oxidase by AGE links oxidant stress to altered gene expression via RAGE. Am J Physiol Endocrinol Metab. 2001;280:E685–E694. doi: 10.1152/ajpendo.2001.280.5.E685. [DOI] [PubMed] [Google Scholar]
- 7.Baynes JW, Thorpe SR. Role of oxidative stress in diabetic complications: a new perspective on an old paradigm. Diabetes. 1999;48:1–9. doi: 10.2337/diabetes.48.1.1. [DOI] [PubMed] [Google Scholar]
- 8.Brownlee M. Biochemistry and molecular cell biology of diabetic complications. Nature. 2001;414:813–820. doi: 10.1038/414813a. [DOI] [PubMed] [Google Scholar]
- 9.Yan SF, Ramasamy R, Naka Y, Schmidt AM. Glycation, inflammation and RAGE: a scaffold for the macrovascular complications of diabetes and beyond. Circ Res. 2003;42:532–538. doi: 10.1161/01.RES.0000103862.26506.3D. [DOI] [PubMed] [Google Scholar]
- 10.Vlassara H, Cai W, Crandall J, et al. Inflammatory mediators are induced by dietary glycotoxins, a major risk factor for diabetic angiopathy. Proc Natl Acad Sci U S A. 2002;99:15596–15601. doi: 10.1073/pnas.242407999. [DOI] [PMC free article] [PubMed] [Google Scholar]
- 11.Kilhovd BK, Juutilainen A, Lehto S, et al. High serum levels of advanced glycation end products predict increased coronary heart disease mortality in nondiabetic women but not in nondiabetic men. A population-based 18-year follow-up study. Arterioscler Thromb Vasc Biol. 2005;25:815–825. doi: 10.1161/01.ATV.0000158380.44231.fe. [DOI] [PubMed] [Google Scholar]
- 12.Goldin A, Beckman JA, Schmidt A, Creager MA. Advanced glycation end products: sparking the development of diabetic vascular injury. Circulation. 2006;114:597–560. doi: 10.1161/CIRCULATIONAHA.106.621854. [DOI] [PubMed] [Google Scholar]
- 13.Cai W, Cao Q, Zhu L, Peppa M, He CJ, Vlassara H. Oxidative stress-inducing carbonyl compounds from common foods: novel mediators of cellular dysfunction. Mol Med. 2002;8:337–346. [PMC free article] [PubMed] [Google Scholar]
- 14.Makita Z, Vlassara H, Cerami A, Bucala R. Immunochemical detection of advanced glycosylation end products in vivo. J Biol Chem. 1992;267:5133–5138. [PubMed] [Google Scholar]
- 15.Oya T, Hattori N, Mizuno Y, et al. Methylglyoxal modification of protein. Chemical and immunochemical characterization of methyl-glyoxal-arginine adducts. J Biol Chem. 1999;274:18492–18502. doi: 10.1074/jbc.274.26.18492. [DOI] [PubMed] [Google Scholar]
- 16.Koschinsky T, He CJ, Mitsuhashi T, et al. Orally absorbed reactive advanced glycation end products (glycotoxins): an environmental risk factor in diabetic nephropathy. Proc Natl Acad Sci U S A. 1997;94:6474–6479. doi: 10.1073/pnas.94.12.6474. [DOI] [PMC free article] [PubMed] [Google Scholar]
- 17.Goldberg T, Cai W, Peppa M, Dardaine V, Uribarri J, Vlassara H. Advanced glycoxidation end products in commonly consumed foods. J Am Diet Assoc. 2004;104:1287–1291. doi: 10.1016/j.jada.2004.05.214. [DOI] [PubMed] [Google Scholar]
- 18.O’Brien J, Morrissey PA. Nutritional and toxicological aspects of the Maillard browning reaction in foods. Crit Rev Food Sci Nutr. 1989;28:211–248. doi: 10.1080/10408398909527499. [DOI] [PubMed] [Google Scholar]
- 19.Finot PA. Historical perspective of the Maillard reaction in food science. Ann N Y Acad Sci. 2005;1043:1–8. doi: 10.1196/annals.1333.001. [DOI] [PubMed] [Google Scholar]
- 20.Uribarri J, Peppa M, Cai W, et al. Restriction of dietary glycotoxins markedly reduces AGE toxins in renal failure patients. J Am Soc Nephrol. 2003;14:728–731. doi: 10.1097/01.asn.0000051593.41395.b9. [DOI] [PubMed] [Google Scholar]
- 21.Sandu O, Song K, Cai W, Zheng F, Uribarri J, Vlassara H. Insulin resistance and type 2 diabetes in high-fat-fed mice are linked to high glycotoxin intake. Diabetes. 2005;54:2314–2319. doi: 10.2337/diabetes.54.8.2314. [DOI] [PubMed] [Google Scholar]
- 22.Hofmann SM, Dong HJ, Li Z, et al. Improved insulin sensitivity is associated with restricted intake of dietary glycoxidation products in the db/db mouse. Diabetes. 2002;51:2082–2089. doi: 10.2337/diabetes.51.7.2082. [DOI] [PubMed] [Google Scholar]
- 23.Peppa M, He C, Hattori C, McEvoy R, Zheng F, Vlassara H. Fetal or neonatal low-glycotoxin environment prevents autoimmune diabetes in NOD mice. Diabetes. 2003;52:1441–1448. doi: 10.2337/diabetes.52.6.1441. [DOI] [PubMed] [Google Scholar]
- 24.Lin RY, Reis ED, Dore AT, et al. Lowering of dietary advanced glycation endproducts (AGE) reduces neointimal formation after arterial injury in genetically hypercholesterolemic mice. Atherosclerosis. 2002;163:303–311. doi: 10.1016/s0021-9150(02)00008-4. [DOI] [PubMed] [Google Scholar]
- 25.Zheng F, He C, Cai W, Hattori M, Steffes M, Vlassara H. Prevention of diabetic nephropathy in mice by a diet low in glycoxidation products. Diabetes Metab Res Rev. 2002;18:224–237. doi: 10.1002/dmrr.283. [DOI] [PubMed] [Google Scholar]
- 26.Peppa M, Brem P, Ehrlich J, et al. Adverse effects of dietary glycotoxins on wound healing in genetically diabetic mice. Diabetes. 2003;52:2805–2813. doi: 10.2337/diabetes.52.11.2805. [DOI] [PubMed] [Google Scholar]
- 27.Cai W, He C, Zhu L, Wallenstein S, Striker G, Vlassara H. A low oxidant diet extends lifespan in mice via reduced oxidant stress. Am J Pathol. doi: 10.2353/ajpath.2007.061281. In press. [DOI] [PMC free article] [PubMed] [Google Scholar]
- 28.Couillard C, Ruel G, Archer WR, et al. Circulating levels of oxidative stress markers and endothelial adhesion molecules in men with abdominal obesity. J Clin Endocrinol Metab. 2005;90:6454–6459. doi: 10.1210/jc.2004-2438. [DOI] [PubMed] [Google Scholar]
- 29.Keaney JF, Larson MG, Vasan RS, et al. Obesity and systemic oxidative stress. Clinical correlates of oxidative stress in the Framingham study. Arterioscler Thromb Vasc Biol. 2003;23:434–439. doi: 10.1161/01.ATV.0000058402.34138.11. [DOI] [PubMed] [Google Scholar]
- 30.Cai W, He C, Zhu L, et al. High levels of dietary advanced glycation end products transform low-density lipoprotein into a potent redox-sensitive mitogen-activated protein kinase stimulant in diabetic patients. Circulation. 2004;110:285–291. doi: 10.1161/01.CIR.0000135587.92455.0D. [DOI] [PubMed] [Google Scholar]
- 31.Peppa M, Uribarri J, Cai W, Lu M, Vlassara H. Glycoxidation and inflammation in renal failure patients. Am J Kidney Dis. 2004;43:690–695. doi: 10.1053/j.ajkd.2003.11.022. [DOI] [PubMed] [Google Scholar]
- 32.Matthews DR, Hosker JP, Rudenski AS, et al. Homeostasis model assessment: insulin resistance and beta cell function from fasting plasma glucose and insulin concentrations in man. Diabetologia. 1985;28:412–419. doi: 10.1007/BF00280883. [DOI] [PubMed] [Google Scholar]
- 33.Figaro MK, Kritchevsky SB, Resnick HE, et al. Diabetes, hyperglycemia, and inflammation in older individuals: the Health, Aging and Body Composition Study. Diabetes Care. 2006;29:1902–1908. doi: 10.2337/dc05-2327. [DOI] [PubMed] [Google Scholar]
- 34.Baynes JW, Thorpe SR. Glycoxidation and lipoxidation in atherogenesis. Free Radic Biol Med. 2000;28:1708–1716. doi: 10.1016/s0891-5849(00)00228-8. [DOI] [PubMed] [Google Scholar]
- 35.Basu S. Isoprostanes: novel bioactive products of lipid peroxidation. Free Radic Res. 2004;38:105–122. doi: 10.1080/10715760310001646895. [DOI] [PubMed] [Google Scholar]
- 36.Gopaul NK, Angaard EE, Mallet AI, et al. Plasma 8-epi-PGF2a levels are elevated in individuals with non-insulin dependent diabetes mellitus. FEBS Lett. 1995;368:225–229. doi: 10.1016/0014-5793(95)00649-t. [DOI] [PubMed] [Google Scholar]
- 37.Ulrich P, Cerami A. Protein glycation, diabetes, and aging. Recent Prog Horm Res. 2001;56:1–21. doi: 10.1210/rp.56.1.1. [DOI] [PubMed] [Google Scholar]
- 38.Facchini FS, Hua NW, Reaven GM, Stoohs RA. Hyperinsulinemia: the missing link among oxidative stress and age-related diseases? Free Radic Biol Med. 2000;29:1302–1306. doi: 10.1016/s0891-5849(00)00438-x. [DOI] [PubMed] [Google Scholar]
- 39.Katoh S, Lehtovirta M, Kaprio J, et al. Genetic and environmental effects on fasting and post challenge glucose and serum insulin values in Finnish twins. J Clin Endocrinol Metab. 2005;90:2642–2647. doi: 10.1210/jc.2004-2471. [DOI] [PubMed] [Google Scholar]
- 40.Stirban A, Negrean M, Stratmann B, et al. Benfotiamine prevents macro- and microvascular endothelial dysfunction and oxidative stress following a meal rich in advanced glycation endproducts in people with type 2 diabetes mellitus. Diabetes Care. 2006;29:2064–2071. doi: 10.2337/dc06-0531. [DOI] [PubMed] [Google Scholar]
- 41.He C, Sabol J, Mitsuhashi T, Vlassara H. Dietary glycotoxins: inhibition of reactive products by aminoguanidine facilitates renal clearance and reduces tissue sequestration. Diabetes. 1999;48:1308–1315. doi: 10.2337/diabetes.48.6.1308. [DOI] [PubMed] [Google Scholar]
- 42.Lindeman RD. Overview: renal physiology and pathophysiology of aging. Am J Kidney Dis. 1990;16:275–282. doi: 10.1016/s0272-6386(12)80002-3. [DOI] [PubMed] [Google Scholar]
- 43.Ahmed N, Thornalley PJ. Quantitative screening of protein biomarkers of early glycation, advanced glycation, oxidation and nitrosylation in cellular and extracellular proteins by tandem mass spectrometry multiple reaction monitoring. Biochem Soc Trans. 2003;31:1417–1421. doi: 10.1042/bst0311417. [DOI] [PubMed] [Google Scholar]
- 44.Stevens LA, Coresh J, Greene T, Levey AS. Assessing kidney function–measured and estimated glomerular filtration rate. N Engl J Med. 2006;354:2473–2483. doi: 10.1056/NEJMra054415. [DOI] [PubMed] [Google Scholar]