

Abstract
A fast (15 min) and simple HPLC method for determination of all-trans-retinol and α-, γ- and δ-tocopherols in human plasma has been developed. The assay utilized 200 μl of plasma to which 20 μl of internal standard solution (retinol acetate) was added followed by 200 μl of water, 400 μl of ethanol and 800 μl of hexane. The hexane layer was collected, evaporated, the residue dissolved in 200 μl of methanol and analyzed on a Zorbax Eclipse XDB-C18 column using a step gradient with a polar organic mobile phase composed of acetonitrile and methanol and variable wavelength fluorescence detection. The quantification limits for all-trans-retinol and γ-tocopherol were 20 ng/ml and for α- and δ-tocopherols 500 ng/ml and 10 ng/ml, respectively. The procedure was validated and applied to the analysis of plasma samples from the Baltimore Longitudinal Study of Aging.
Keywords: Vitamins, All-trans-retinol, α-Tocopherol, γ-Tocopherol, δ-Tocopherol, HPLC, Fluorescence detection
1. Introduction
Vitamin A and vitamin E belong to the fat-soluble group of vitamins. In humans vitamin A (all-trans-retinol, Fig. 1A) is required for proper growth and bone development, vision, reproduction and integrity of mucosal and epithelial surfaces [1]. Vitamin E (tocopherol) naturally occurs in four forms as α-, β-, γ- and δ-tocopherols (Fig. 1B) and four corresponding unsaturated analogues, tocotrienols. α-Tocopherol, the most pharmacologically important vitamin E agent, is a peroxyl radical scavenger that is protective for polyunsaturated fatty acids within membranes and lipoproteins [1]. It is also an antioxidant and is believed to play a preventive role in diseases associated with oxidative stress like cancer, cardiovascular diseases, cataracts, age-related macular degeneration, central neurodegenerative diseases and diabetes mellitus [1,2]. While recent epidemiological studies have suggested that antioxidative vitamins play a protective role in coronary heart disease and some cancers [3], others have indicated that increased vitamin E intake may be linked to increased mortality [4,5], although the latter finding have been disputed [6].
Fig. 1.
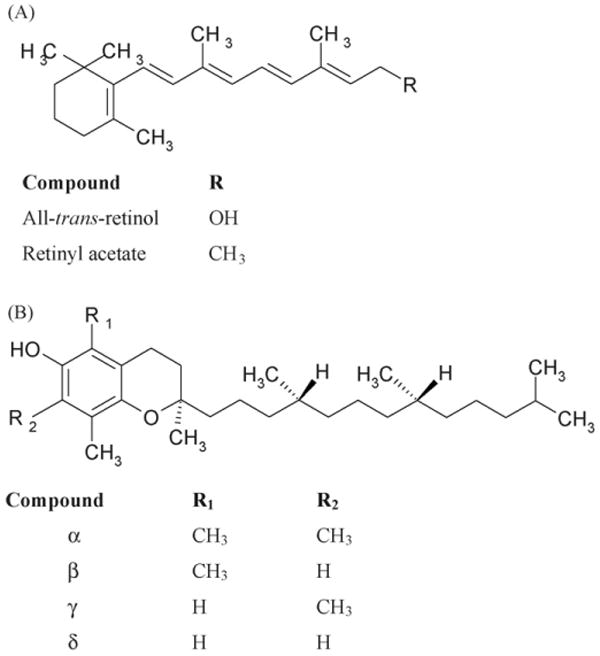
Chemical structures of all-trans-retinol and retinyl acetate (A) and of tocopherols (B).
While most of the clinical studies have been concerned with α-tocopherol, recent studies have investigated the role of another vitamin E isomer, γ-tocopherol. This isomer is the most prevalent form of vitamin E in plant seeds and their products, such as soybean, corn or sesame oils and some nuts [7]. It has been suggested that γ-tocopherol might be a beneficial agent as an antioxidant trapping reactive nitrogen oxide species [7]. It was also postulated that it might play a preventive role in cardiovascular diseases and several types of cancer [7,8]. The nutritional source of β- and δ-tocopherols is either diet or vitamin supplements that are based on natural sources. So far there is little known about pharmacological role of β- and δ-tocopherols as only a few studies have been published relating their blood levels with clinical outcomes e.g. [9].
The Baltimore Longitudinal Study of Aging (BLSA) is the National Institute on Aging's major clinical research program and is designed to characterize normal and pathological aging. One aspect of this program is the study of age-related frailty. Since vitamins A and E appear to play a significant role in human health, one facet of program is designed to determine if there is a relationship between age-related frailty and the plasma concentrations of these vitamins. As part of this project, we have developed a rapid and reliable method for the determination of all-trans-retinol and tocopherol isomers in human plasma.
A number of methods for the determination of fat-soluble vitamins have been reported. The majority of these methods utilize reversed-phase liquid chromatography for the determination of all-trans-retinol and α-tocopherol in human fluids [10–16] and several papers also reported the resolution and quantification of α-tocopherol and γ-tocopherol [17–21]. Recently a method employing a monolithic column for the resolution of all-trans-retinol, α-tocopherol and retinyl esthers in human serum was reported [22]. Vitamins A, E and D were also separated by microemulsion electrokinetic chromatography [23]. Normal phase liquid chromatography has also been used and appears to be a better tool for the separation of γ- and (β-tocopherols [24–28]. CE methods have also been described [29,30]. These methods have employed fixed wavelength or diode array UV detection [10–12,14,25,27], electrochemical detection [19,31] or fluorescence detection [20,24–27]. Recently also normal phase liquid chromatography with atmospheric pressure chemical ionization–tandem mass spectrometry was used to determine α-tocopherol and carotenoids in botanical materials [32]. An excellent broad review of tocopherol and derivatives chromatographic analysis was made by Rupérez et al. [33].
Although there are several published methods for simultaneous determination of all-trans-retinol and tocopherols in human fluids, most are focused on all-trans-retinol and α-tocopherol analysis. There are few methods, which described all-trans-retinol and tocopherol isomers determination with the use of RP-HPLC [20,21,34,35]. Still, either they are not sensitive enough to determine δ-tocopherol [20] or they are more complex as other compounds are determined in parallel [18,21,35]. Although Olmedilla-Alonso et al. [18] resolved retinol, retinyl acetate, retinyl palmitate, α-, γ and δ-tocopherols as well as several carotenoids within 25 min, analytical analysis was not performed for δ-tocopherol. Method proposed by Lee et al. [21] is suitable for determination of retinol, tocopherols, tocotrienols and major caroteinoids in human plasma. But it uses two columns along with a column switching system, PDA and fluorescence detectors which make it more complicated, longer to analyze and require more experience in method optimization. On the other hand Göbel et al. [34] proposed a simple method for determination of all-trans-retinol and, α-, γ and δ-tocopherols from 100 μl of plasma with UV and fluorescence detections but the chromatographic run takes 20 min.
Therefore, based upon the previous work, we have developed an alternative and simple approach for the rapid, sensitive and reliable determination of all-trans-retinol and α-, γ- and δ-tocopherols in human plasma. The technique uses a C18 liquid chromatography stationary phase and variable wavelength fluorescence detection. In contrast to other methods utilizing RP-HPLC [20,34,36,37] this method employs a novel step gradient and uses a polar organic mobile phase. The method has been validated and applied to the analyses of samples from the BLSA study.
2. Experimental
2.1. Materials
All-trans-retinol, retinol acetate (Fig. 1A), γ-tocopherol, β-tocopherol and δ-tocopherol (Fig. 1B), ethanol spectrophotometric grade and 2,6-di-tert-butyl-4-methylphenol (BHT) were supplied by Sigma–Aldrich, (St. Louis, MO). d-alpha-tocopherol (Fig. 1B), HPLC-grade acetonitrile, methanol and hexane were purchased from Fisher Scientific (Pittsburgh, PA). Purified water was prepared using a Milli-Q system (Millipore, Milford, MA). Human plasma collected from whole blood in sodium heparin was purchased from Valley Biomedical Inc. (Winchester, VA).
2.2. Chromatography
The chromatography was carried out using a Shimadzu system (Columbia, MD) composed of two LC-10ADvp pumps, SIL 10ADvp autosampler, CTO-10ASvp column oven, RF-10Axl fluorescence detector and SCL-10ADvp controller. The data was acquired by CLASSvp software, v. 5.03. The separation was achieved on a Zorbax Eclipse XDB-C18 column (150 mm × 4.6 mm i.d., 5 μm particle size) connected with a guard column RX-C8 (12.5 mm × 4.6 mm i.d., 5 μm particle size) (Agilent Technologies, Palo Alto, CA). A Shimadzu UV-160A spectrophotometer was used to determine the absorbance of standard solutions.
The chromatography was carried out using a step gradient elution mode in which eluent A was methanol and eluent B acetonitrile. The following step gradient was used during the run: 0–4 min, 10–14 min 70%B at a flow rate 1 ml/min and 4–10 min 0%B at a flow rate 1.2 min/min. The column was thermostated at 30 °C. All-trans-retinol and retinol acetate were detected using an excitation wavelength of λ = 325 nm and an emission wavelength of λ = 470 nm at medium sensitivity and gain 16. These settings were maintained from injection to 7 min. At 7 min, the excitation wavelength was changed to λ = 295 nm and emission wavelength to λ = 330 nm, gain was diminished to three in order to optimize the detection of tocopherols and these conditions were maintained until the end of the chromatographic run at 14.0 min. All-trans-retinol, α-tocopherol and γ-tocopherol were quantified on the base of peak area ratios of vitamin over internal standard as obtained from calibration curves while δ-tocopherol on the base of peak height ratios.
2.3. Standard solutions
Stock solutions of all-trans-retinol (0.1 mg/ml), α-tocopherol (1 mg/ml), γ-tocopherol (0.1 mg/ml) and δ-tocopherol (0.2 mg/ml) were prepared individually in absolute ethanol, while retinol acetate was dissolved in ethanol with addition of 0.04% BHT (w/v) (1 mg/ml). Standard solutions of the vitamins were stable at −80 °C for up to 2 months and standard solutions of the internal standard were stable for up to 1 month. Working standards were prepared and corrected daily according to their absorbance values E (1 cm/1%) (all-trans-retinol 1835 at 325 nm, α-tocopherol 75.8 at 292 nm [10], γ-tocopherol 92.8 at 298 nm, δ-tocopherol 91.2 at 298 nm [38]).
2.4. Blood collection and storage conditions
After obtaining informed consent, blood samples were collected from patients enrolled in the BLSA, study number: 2003-076 (Longitudinal Studies of Human Physiology, Biochemistry and Psychology) into a tube containing sodium heparin (Becton–Dickinson, Franklin Lakes, NJ). Samples were centrifuged at 2000 × g for 15–20 min at 4 °C to obtain plasma. A 1 ml aliquot of the plasma was taken for vitamin analysis and was placed in a cryovial and frozen in −80 °C until the day of analysis.
2.5. Sample preparation
The plasma samples prepared for analysis using a liquid–liquid extraction technique, which was a modified version of an earlier reported procedure [17]. Briefly, to 200 μl of plasma were added 20 μl of internal standard solution (retinol acetate 25 μ/ml in ethanol) and 200 μl of water and the resulting solution was vortex-mixed for 10 s. A 400 μl aliquot of ethanol (containing 0.04% BHT) was added and the solution was vortex-mixed for 10 s and 800 μl of hexane (containing 0.04% BHT) was then added and the resulting mixture was vortex-mixed for 3 min, centrifuged at 3500 × g for 10 min at 10 °C, and 700 μl of the hexane layer was transferred to a borosilicate glass tube. The hexane was evaporated to dryness in a Speed Vac (Thermo Savant, NY) for 10 min, 45 °C, the resulting pellet was resuspended in 200 μl of methanol, vortex-mixed for 30 s, transferred into amber vials and 20 μl of the extracted plasma was injected into the HPLC system for analysis. The sample preparation was processed under stream of nitrogen and in dim light.
2.6. Calibration curves, quality controls
Calibration curves were calculated using working solutions consisting of a mixture of analytes prepared by diluting standard solutions in absolute ethanol. The mixed calibration samples for all-trans-retinol and tocopherols were prepared in methanol in triplicates in the following concentrations: 0.02, 0.05, 0.1, 0.5, 1 and 2 μg/ml for all-trans-retinol, 0.5, 1, 2.5, 5, 10 and 30 μg/ml for α-tocopherol, 0.02, 0.05, 0.1, 0.5, 1, 2, 4 for γ-tocopherol and 0.01, 0.02, 0.05, 0.1, 0.25, 1 for δ-tocopherol. For validation purposes three level quality controls were used [39]. The linearity of obtained standard curves was tested by calculating a relative error (RE) percentage using Microsoft Office Excel 2003 operating on a PC.
2.7. Recovery
For recovery studies, the all-trans-retinol and tocopherol samples were divided into three groups A, B and C. Group A consisted of quality controls and IS in methanol, group B was control plasma and IS, and group C was control plasma plus QC standards. Both groups B and C were extracted in the same way as patient samples. Recovery was quantified according to the following equation:
| (1) |
3. Results and discussion
Under the chromatographic conditions used in this study, the observed chromatographic trace contained peaks corresponding to all-trans-retinol (peak 1) at 3.6 min, retinol acetate (peak 2) at 4.4 min, δ-tocopherol (peak 3) at 8.6 min and α-tocopherol (peak 5) at 10.3 min, Fig. 2A. Under these conditions, γ- and β-tocopherols coeluted (peak 4) at 9.5 min. It has been previously reported that γ- and β-tocopherols were difficult to resolve in both reversed-phase [20,21,34] and normal phase [24] chromatography and γ- and β-tocopherols have been quantified together [24]. Since the concentration of β-tocopherol is a factor of 10 lower than that of γ-tocopherol [27,40] and since the two compounds have the same spectrometric profiles, no further attempt was made to separate the isomers. In this study, the standard curves were constructed using γ-tocopherol and the calculated plasma concentrations are reported as γ-tocopherol.
Fig. 2.
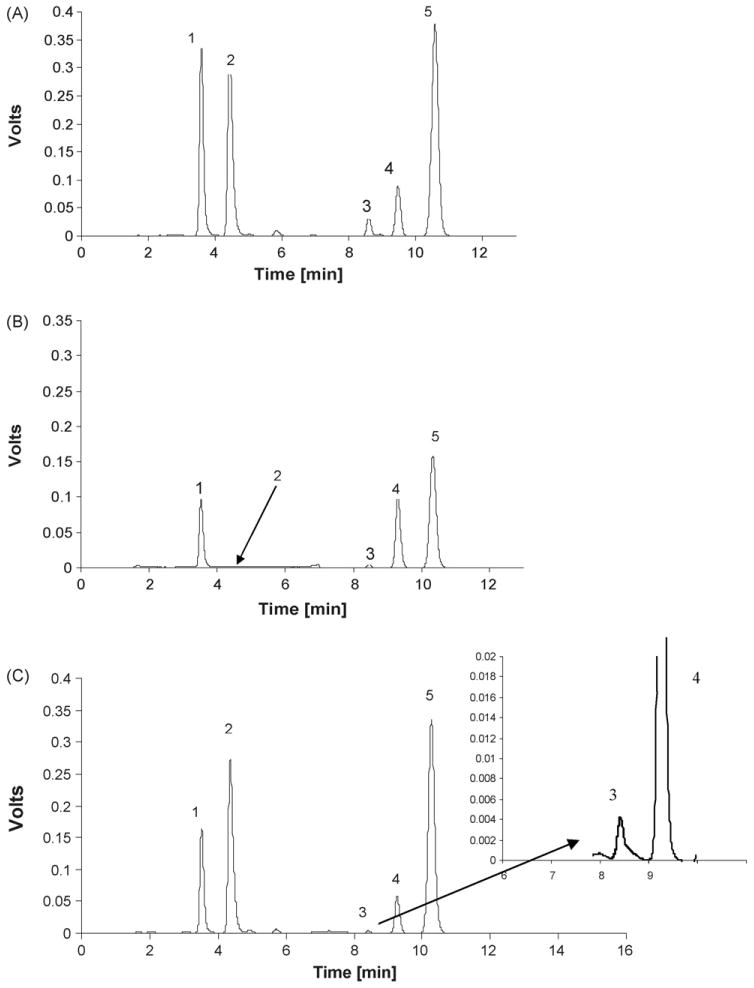
HPLC chromatogram of 20 μl injection of (A) all-trans-retinol (1), retinol acetate (2), δ-tocopherol (3), γ- tocopherol (4) and α-tocopherol (5) in methanol (upper quality control), (B) controlled plasma extract and (C) patient's plasma extract. Peak nb (4) in patient's plasma corresponds to γ- and β-tocopherol. The following step gradient was used during the run: 0–4 min and 10–14 min 70%B at a flow rate 1 ml/min; 4–10 min 0%B at a flow rate 1.2 ml/min.
The analysis of control plasma samples demonstrated the presence of significant concentrations of all of the target analytes, Fig. 2B and Table 1, column B. There was no interfering peak at the retention time of the internal standard (peak 2) demonstrating that retinol acetate could be used as a relative measure of analyte concentrations. The analysis of a patient sample is presented in Fig. 2C.
Table 1.
The percent recovery of vitamin A and tocopherol isomers from human plasma; where: A = concentration of the analytes obtained from analysis of the quality controls in methanol; B = concentration of the analytes obtained from analysis of control plasma; C = concentration of the analytes obtained from analysis of spiked plasma
| Compound | Level (μg/ml) | Mean concentration ± S.D. (μg/ml) | Recovery (%) | ||
|---|---|---|---|---|---|
| A | B | C | |||
| All-trans-retinol | 0.06 | 0.06 ± 0.00 | 0.50 ± 0.01 | 0.57 ± 0.01 | 101.4 |
| 0.30 | 0.31 ± 0.00 | 0.80 ± 0.00 | 99.2 | ||
| 1.50 | 1.53 ± 0.06 | 1.91 ± 0.03 | 94.1 | ||
| α-Tocopherol | 0.60 | 0.62 ± 0.02 | 7.77 ± 0.13 | 8.91 ± 0.11 | 106.1 |
| 3.00 | 3.02 ± 0.01 | 10.45 ± 0.17 | 96.8 | ||
| 15.00 | 15.06 ± 0.54 | 22.00 ± 0.55 | 95.5 | ||
| γ-Tocopherol | 0.06 | 0.06 ± 0.00 | 2.09 ± 0.08 | 2.33 ± 0.26 | 108.6 |
| 0.30 | 0.31 ± 0.01 | 2.43 ± 0.06 | 101.3 | ||
| 1.50 | 1.60 ± 0.04 | 3.75 ± 0.06 | 101.5 | ||
| δ-Tocopherol | 0.02 | 0.02 ± 0.00 | 0.06 ± 0.00 | 0.09 ± 0.01 | 113.8 |
| 0.20 | 0.20 ± 0.01 | 0.25 ± 0.01 | 96.9 | ||
| 0.40 | 0.42 ± 0.01 | 0.48 ± 0.01 | 99.5 | ||
Percent recovery was calculated using an equation: Recovery = C × 100/(A + B).
3.1. Extraction of vitamins, recovery
As all-trans-retinol is a highly protein bound compound [41] and tocopherols in plasma are associated with lipoproteins [42], the first step in sample preparation was mixing with water to loosen the existing bindings, which was followed by protein recipitation with ethanol and extraction into hexane. Since a liquid–liquid extraction step was included in the process, it was necessary to utilize the internal standard in order to correct for variability in the extraction procedure. Retinol acetate and tocopherol acetate were tested and both could be used as an internal standard. Retinol acetate was selected because its retention time (4.4 min) was between the retention times of all-trans-retinol and the tocopherols and it had a stronger fluorescence signal. However, tocopherol acetate was more stable and would be a useful internal standard if time (retention time 11.3 min) and sensitivity (UV detection in place of fluorescence) could be sacrificed.
The effect of a multiple hexane extractions on recovery was examined and a single hexane extraction from plasma was satisfactory. The recoveries of all-trans-retinol and tocopherol isomers from human plasma are presented in Table 1. The data were obtained from five independent experiments at three levels. While calculating recovery the presence of endogenous vitamins in the plasma was taken into consideration and recovery was quantified using Eq. (1).
3.2. Linearity
Because of the presence of all-trans-retinol and tocopherol isomers in the control plasma, samples for standard curves were prepared in methanol. The quantification of compounds was based on area ratios of compound over internal standard versus concentration except δ-tocopherol which was based on height ratios. As ratios were the same for the samples prepared in solvent compared to ratios obtained by extraction from water, validation procedure was processed in methanol samples.
The calculated standard curves for all the analytes were linear with high correlation coefficients, for all-trans-retinol in the range from 0.02 to 2 μg/ml (r = 0.9999), for α-tocopherol from 0.5 to 30 μg/ml (r = 0.9997), for γ-tocopherol from 0.02 to 4 μg/ml (r= 0.9997) and for δ-tocopherol from 0.01 to 1 μg/ml (r = 0.9999). The equations applied for calculation of all-trans-retinol and tocopherol isomers concentrations in human plasma extracts are presented in Table 2.
Table 2.
Calibration equations for all-trans-retinol, α-, γ- and δ-tocopherols with the use of retinol acetate as an internal standard, where: y = concentration (μg/ml), x = peak area (height) ratio, b: slope; a: intercept
| Compound | Concentration range (μg/ml) | Standard curve equation y = bx + a | r | |
|---|---|---|---|---|
| Slope | Intercept | |||
| All-trans-retinol | 0.02–2.00 | 1.6939 ± 0.0075 | 0.0050 ± 0.0041 | 0.9999 |
| 0.02–0.10 | 1.7557 ± 0.0648 | −0.0003 ± 0.0002 | 0.9993 | |
| α-Tocopherol | 0.50–30.00 | 9.1017 ± 0.1065 | 0.2579 ± 0.1516 | 0.9997 |
| 0.50–2.50 | 9.8651 ± 0.2622 | 0.0138 ± 0.0417 | 0.9996 | |
| γ-Tocopherol | 0.02–4.00 | 5.5376 ± 0.0576 | −0.0227 ± 0.0183 | 0.9997 |
| 0.02–0.10 | 5.5651 ± 0.0540 | −0.0009 ± 0.0006 | 0.9999 | |
| δ-Tocopherol | 0.01–1.00 | 3.6146 ± 0.0265 | 0.0008 ± 0.0031 | 0.9999 |
| 0.01–0.05 | 3.8300 ± 0.1302 | −0.0039 ± 0.0012 | 0.9994 | |
Despite high values of correlation coefficients it was found that for low concentrations of the standard curves the RE was greater than 5%. This problem was overcome by constructing “low range” calibration curves for the compounds. The range for low concentrations of all-trans-retinol was between 0.02 and 0.1 μg/ml (r = 0.9993), for α-tocopherol from 0.5 to 2.5 μg/ml (r = 0.9996), for γ-tocopherol from 0.02 to 0.1 μg/ml (r = 0.9999) and for δ-tocopherol from 0.01 to 0.05 μg/ml (r = 0.9994). Equations which were used for low concentrations of all-trans-retinol and tocopherol isomers are presented in Table 2.
The limits of quantification (LLOQ) determined at the lowest concentration in the standard curve with accuracy between 80 and 120% and limits of detection (LOD) at signal to noise ratio (S/N) equal 3 for the analyzed compounds are presented in Table 3.
Table 3.
The calculated limits of quantification (LOQ) and limits of detection (LOD) for all-trans retinol and tocopherol isomers
| Compound | LOQ (ng/ml) | LOD (ng/ml) |
|---|---|---|
| All-trans-retinol | 20 | 1 |
| α-Tocopherol | 500 | 20 |
| γ-Tocopherol | 20 | 3 |
| δ-Tocopherol | 10 | 2 |
3.3. Accuracy and precision
The intra-day and inter-day precision data are presented in Table 4. The accuracy data obtained during validation process ranged from 93.3 to105.6% for all-trans-retinol, from 95.2 to 104.7% for α-tocopherol, from 98.5 to 107% for γ-tocopherol and from 93.3 to 106.1 for δ-tocopherol (Table 4).
Table 4.
Intra- inter-day precision and accuracy in determination of all-trans-retinol and α- γ- and δ-tocopherols in human plasma
| Compound | Nominal concentration (μg/ml) | Precision | Accuracy | ||
|---|---|---|---|---|---|
| Intra-day CV (%), n = 5 | Inter-day CV (%), n = 18 | Concentration calculated, n = 5 | Average (%), n = 5 | ||
| All-trans-retinol | 0.02 (LLOQ) | 4.54 | ND | 0.02 | 105.6 |
| 0.06 (LQC) | 3.86 | 5.57 | 0.06 | 96.6 | |
| 0.30 (MQC) | 3.59 | 8.47 | 0.28 | 93.3 | |
| 1.50 (UQC) | 2.52 | 5.70 | 1.45 | 96.6 | |
| α-Tocopherol | 0.5 (LLOQ) | 2.94 | ND | 0.52 | 104.7 |
| 0.60 (LQC) | 4.39 | 8.21 | 0.59 | 97.8 | |
| 3.00 (MQC) | 2.04 | 8.70 | 3.06 | 101.9 | |
| 15.00 (UQC) | 2.97 | 5.36 | 14.27 | 95.2 | |
| γ-Tocopherol | 0.02 (LLOQ) | 10.28 | ND | 0.02 | 98.5 |
| 0.06 (LQC) | 6.33 | 6.19 | 0.06 | 101.4 | |
| 0.30 (MQC) | 2.91 | 6.50 | 0.31 | 104.8 | |
| 1.50 (UQC) | 2.68 | 5.71 | 1.60 | 107.0 | |
| δ-Tocopherol | 0.01 (LLOQ) | 16.6 | ND | 0.01 | 106.1 |
| 0.02 (LQC) | 5.58 | 7.31 | 0.02 | 93.3 | |
| 0.06 (MQC) | 4.51 | 5.63 | 0.06 | 97.3 | |
| 0.40 (UQC) | 2.33 | 5.94 | 0.42 | 104.6 | |
ND: not determined.
3.4. Application of the method
The validated method was used for determining plasma concentrations of patients enrolled in the Longitudinal Baltimore Study of Aging. The data presented are from the analysis of 221 patients. All four compounds were determined in all the patients plasma extracts except for four patients where δ-tocopherol concentrations were below the LLOQ. The ranges for all-trans-retinol were 0.34–1.18 μg/ml (mean 0.66 μg/ml, 2.3 μmol/l), for α-tocopherol 2.03–28.18 μg/ml (mean 14.84 μg/ml, 34.45 μmol/l), for γ-tocopherol 0.23–3.90 μg/ml (mean 1.27 μg/ml, 3.05 μmol/l) and for δ-tocopherol 0.01–0.23 μg/ml (mean 0.06 μg/ml, 0.15 μmol/l). The ranges for all-trans-retinol and α-tocopherol are in agreement with ranges of US population reported in NHANES III study, 0.24–1.28 μg/ml, 5.12–28.75 μg/ml, respectively [43]. Our data regarding γ- and δ-tocopherol are consistent with the ranges of concentrations reported in a study with over 1000 participants, 0.25–2.84 μg/ml and 0.05–0.24 μg/ml, respectively [21]. The distributions of all-trans-retinol and tocopherols in patients' plasma are presented in Fig. 3.
Fig. 3.
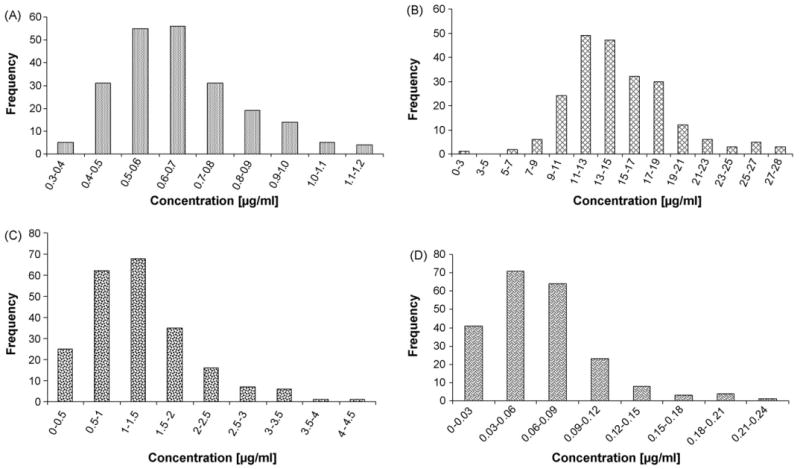
Frequency distribution of patients plasma concentrations of all-trans-retinol (A), α-tocopherol (B), γ-tocopherol (C) (221 patients) and δ-tocopherol (D) (217 patients).
4. Conclusion
In summary, the reported HPLC method for all-trans-retinol and α-, γ- and δ-tocopherols determination in human plasma is precise, accurate, selective, sensitive and reproducible. The method can be used in clinical studies in which all-trans-retinol and tocopherols in human plasma are being investigated.
Acknowledgments
This study was supported by the Intramural Research Program, National Institutes of Health, National Institute on Aging.
Abbreviations
- RP-HPLC
reversed-phase high performance liquid chromatography
- Eqn
equation
- RE
relative error
- BLSA
Baltimore Longitudinal Study of Aging
- NHANES III
The Third National Health and Nutrition Examination Survey
References
- 1.Panel on Dietary Antioxidants and Related Compounds, Subcommittees on Upper Reference Levels of Nutrients and Interpretation and Uses of DRIs, Standing Committee on the Scientific Evaluation of Dietary Reference Intakes, Food and Nutrition Board, Institute of Medicine, Dietary reference intakes for vitamin C, vitamin E, selenium, and carotenoids. National Academy Press; Washington DC: 2000. http://newton.nap.edu/books/0309069351. [Google Scholar]
- 2.Hardman JG, Limbird LE, Gilman AG. Goodman & Gilman's The Pharmacological Basis of Therapeutics. 10th. McGraw-Hill; New York: 2001. [Google Scholar]
- 3.Meydani M. Lancet. 1995;345:170–175. doi: 10.1016/s0140-6736(95)90172-8. [DOI] [PubMed] [Google Scholar]
- 4.Ford ES, Ajani UA, Mokdad AH. Ann Intern Med. 2005;143:116–120. doi: 10.7326/0003-4819-143-2-200507190-00010. [DOI] [PubMed] [Google Scholar]
- 5.Miller ER, 3rd, Pastor-Barriuso R, Dalal D, Riemersma RA, Appel LJ, Guallar E. Ann Intern Med. 2005;142:37–46. doi: 10.7326/0003-4819-142-1-200501040-00110. [DOI] [PubMed] [Google Scholar]
- 6.Lee IM, Cook NR, Gaziano JM, Gordon D, Ridker PM, Manson JE, Hennekens CE, Buring JE. JAMA. 2005;294:56–65. doi: 10.1001/jama.294.1.56. [DOI] [PubMed] [Google Scholar]
- 7.Jiang Q, Christen S, Shigenaga MK, Ames BN. Am J Clin Nutr. 2001;74:714–722. doi: 10.1093/ajcn/74.6.714. [DOI] [PubMed] [Google Scholar]
- 8.Devaraj S, Ishwarlal I. Nutr Rev. 2005;63:290–293. doi: 10.1111/j.1753-4887.2005.tb00143.x. [DOI] [PubMed] [Google Scholar]
- 9.Siegel EM, Craft NE, Duarte-Franco E, Villa LL, Franco EL, Giuliano AR. Int J Cancer. 2007;120:672–680. doi: 10.1002/ijc.22346. [DOI] [PMC free article] [PubMed] [Google Scholar]
- 10.Gueguen S, Herbeth B, Siest G, Leroy P. J Chromatogr Sci. 2002;40:69–76. doi: 10.1093/chromsci/40.2.69. [DOI] [PubMed] [Google Scholar]
- 11.Bui MH. J Chromatogr B. 1994;654:129–133. doi: 10.1016/0378-4347(93)e0441-r. [DOI] [PubMed] [Google Scholar]
- 12.Talwar D, Ha TK, Cooney J, Brownlee C, O'Reilly DS. Clin Chim Acta. 1998;270:85–100. doi: 10.1016/s0009-8981(97)00224-6. [DOI] [PubMed] [Google Scholar]
- 13.Catignani GL, Bieri JG. Clin Chem. 1983;29:708–712. [PubMed] [Google Scholar]
- 14.Abahusain MA, Wright J, Dickerson JWT, El-Hazmi MA, Enein HYA. Biomed Chromatogr. 1998;12:89–93. doi: 10.1002/(SICI)1099-0801(199803/04)12:2<89::AID-BMC732>3.0.CO;2-0. [DOI] [PubMed] [Google Scholar]
- 15.Arnaud J, Fortis I, Blachier S, Dia D, Favier A. J Chromatogr. 1991;572:103–116. doi: 10.1016/0378-4347(91)80476-s. [DOI] [PubMed] [Google Scholar]
- 16.Karpińska J, Mikołuć B, Motkowski R, Piotrowska-Jastrzębska J. J Pharm Biomed Anal. 2006;42:232–236. doi: 10.1016/j.jpba.2006.03.037. [DOI] [PubMed] [Google Scholar]
- 17.Aebischer CP, Schierle J, Schuep W. Meth Enzymol. 1999;299:348–362. doi: 10.1016/s0076-6879(99)99035-3. [DOI] [PubMed] [Google Scholar]
- 18.Olmedilla-Alonso B, Granado-Lorencio F, Blanco-Navarro I. Clin Biochem. 2005;38:444–449. doi: 10.1016/j.clinbiochem.2005.02.001. [DOI] [PubMed] [Google Scholar]
- 19.Gamache PH, Freeto SM, Acworth IN. Am Clin Lab. 1999;6:18–19. [Google Scholar]
- 20.Taibi G, Nicotra CMA. J Chromatogr B. 2002;780:261–267. doi: 10.1016/s1570-0232(02)00529-9. [DOI] [PubMed] [Google Scholar]
- 21.Lee BL, New AL, Ong CN. Clin Chem. 2003;49:2056–2066. doi: 10.1373/clinchem.2003.022681. [DOI] [PubMed] [Google Scholar]
- 22.Urbanek L, Krcmova L, Solichova D, Melichar B, Opletalova V, Solich P. J Sci Commun. 2006;29:2485–2493. doi: 10.1002/jssc.200600153. [DOI] [PubMed] [Google Scholar]
- 23.Bustamante-Rangel M, Delagado-Zamarreno MM, Sanchez-Perez A, Carabias-Martinez R. J Chromatogr A. 2006;1125:270–273. doi: 10.1016/j.chroma.2006.07.024. [DOI] [PubMed] [Google Scholar]
- 24.Ihara H, Ishigaki H, Shino Y, Hashizume N, Takase M, Nagao J. J Nutr Sci Vitaminol. 2000;46:257–262. doi: 10.3177/jnsv.46.257. [DOI] [PubMed] [Google Scholar]
- 25.Casal S, Macedo B, Oliveira MB. J Chromatogr B. 2001;763:1–8. doi: 10.1016/s0378-4347(01)00349-8. [DOI] [PubMed] [Google Scholar]
- 26.Kramer JKG, Fouchard RC, Kallury KMR. Meth Enzymol. 1999;299:318–329. doi: 10.1016/s0076-6879(99)99032-8. [DOI] [PubMed] [Google Scholar]
- 27.Cooney RV, Custer LJ, Okinaka L, Franke AA. Nutr Cancer. 2001;39:66–71. doi: 10.1207/S15327914nc391_9. [DOI] [PubMed] [Google Scholar]
- 28.Chevez-Servin JL, Castellote AI, Lopez-Sabater MC. J Chromatgr A. 2006;1122:138–143. doi: 10.1016/j.chroma.2006.04.059. [DOI] [PubMed] [Google Scholar]
- 29.Bempong DK, Honigberg IL, Meltzer NM. J Pharm Biomed Anal. 1993;11:829–833. doi: 10.1016/0731-7085(93)80076-d. [DOI] [PubMed] [Google Scholar]
- 30.Zhao J, Yang G, Duan H, Li J. Electrophoresis. 2001;22:151–154. doi: 10.1002/1522-2683(200101)22:1<151::AID-ELPS151>3.0.CO;2-0. [DOI] [PubMed] [Google Scholar]
- 31.Lang JK, Gohil K, Packer L. Anal Biochem. 1986;157:106–116. doi: 10.1016/0003-2697(86)90203-4. [DOI] [PubMed] [Google Scholar]
- 32.Hao Z, Parker B, Knapp M, Yu L (Lucy) J Chromatogr A. 2005;1094:83–90. doi: 10.1016/j.chroma.2005.07.097. [DOI] [PubMed] [Google Scholar]
- 33.Rupérez FJ, Martín D, Herrera E, Barbas C. J Chromatogr A. 2001;935:45–69. doi: 10.1016/s0021-9673(01)01101-3. [DOI] [PubMed] [Google Scholar]
- 34.Göbel Y, Schaffer C, Koletzko B. J Chromatogr B. 1997;688:57–62. doi: 10.1016/s0378-4347(97)88055-3. [DOI] [PubMed] [Google Scholar]
- 35.Olmedilla B, Granado F, Gil-Martinez E, Blanco I, Rojas-Hidalgo E. Clin Chem. 1997;43:1066–1071. [PubMed] [Google Scholar]
- 36.Gimeno E, Castellote AI, Lamuela-Raventos RM, Torre-Boronat MC, Lopez-Sabater MC. J Chromatogr B. 2001;758:315–322. doi: 10.1016/s0378-4347(01)00202-x. [DOI] [PubMed] [Google Scholar]
- 37.Epler KS, Ziegler RG, Craft NE. J Chromatogr. 1993;619:37–48. doi: 10.1016/0378-4347(93)80444-9. [DOI] [PubMed] [Google Scholar]
- 38.O'Nei MJ, Smith A, Heckelman PE, editors. The Merck Index, An Encyclopedia of Chemicals, Drugs, and Biologicals. 13th. Merck & Co. Inc.; Whitehouse Station: 2001. [Google Scholar]
- 39.Guidance for Industry, Bioanalytical Method Validation, U.S. Department of Health and Human Services, Food and Drug Administration, Center for Drug Evaluation and Research, Center for Veterinary Medicine. May, 2001. [Google Scholar]
- 40.Chow CK. Am J Clin Nutr. 1975;28:756–760. doi: 10.1093/ajcn/28.7.756. [DOI] [PubMed] [Google Scholar]
- 41.Gundersen TE, Blomhoff R. J Chromatogr A. 2001;935:13–43. doi: 10.1016/s0021-9673(01)01043-3. [DOI] [PubMed] [Google Scholar]
- 42.Herrera E, Barbas C. J Physiol Biochem. 2001;57:43–56. [PubMed] [Google Scholar]
- 43.Centers for Disease Control and Prevention, Inorganic Toxicology and Nutrition Branch, Division of Laboratory Sciences, National Center for Environmental Health, Laboratory Procedure Manual, Fat Soluble Micronutrients (Vitamins A, E, and Carotenoids) 2006 April; http://www.cdc.gov/nchs/data/nhanes/frequency/lab06_met_aecar.pdf.