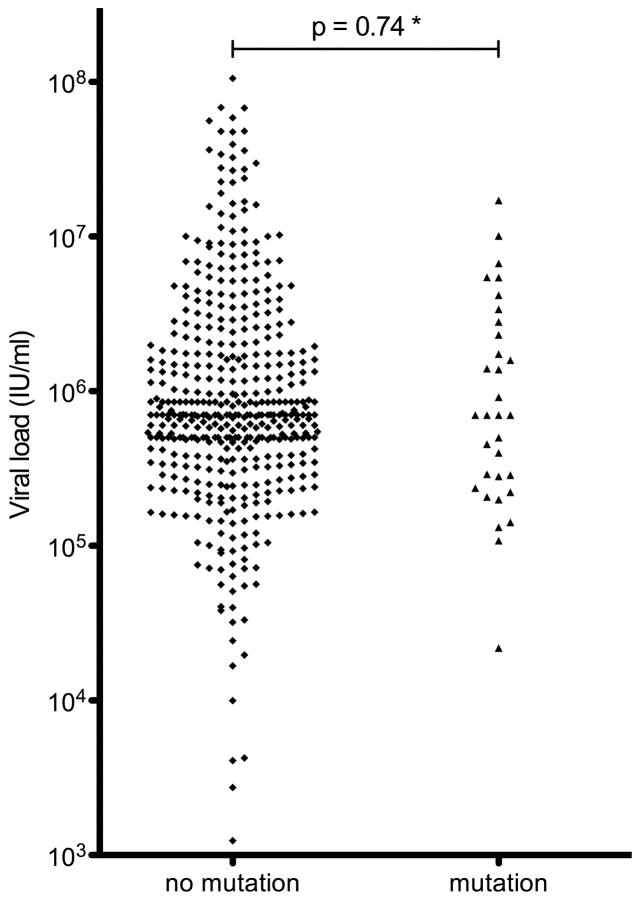
Figure 1. Viral loads compared between patients with and without NS3 protease and NS5B polymerase inhibitor resistance mutations.
The estimated* p-value (Mann-Whitney-U test) shows no significant difference between the two groups, thus arguing against a strong negative impact of these mutations on viral replication in the individual viral strains in vivo, possibly influenced by yet undefined compensatory mutations. (* No mutation group: N = 474, 32 missing values, 65 semi-quantitative values >500,000–850,000 IU/ml above the detection limit of the test; Mutation group: N = 33, 1 missing value, 4 values >500,000 IU/ml).

