Introduction
Transplantation of fresh osteochondral allografts has proven to be effective for clinical treatment of focal articular defects. However, the limited availability of fresh allograft tissues necessitates banking for long-term storage [1–4]. Although cryopreservation by freezing is preferable for long-term tissue storage, conventional protocols result in high cell death of the chondrocytes along with the formation of ice in the matrix and/or in the chondrons [5, 6, 7]. Indeed, there exists evidence that, although extracellular ice is generally not harmful to suspensions of single cells, it poses a major hazard for natural and artificial tissues [4, 8–10] and recent studies indicate that extracellular ice forms within the chondron of cartilage causing cell damage [7]. Therefore, improved preservation methods are needed as part of a successful clinical application.
Ice-free cryopreservation, or vitrification, which involves the amorphous solidification of a liquid in the absence of ice crystals, has the potential to achieve tissue preservation by maintaining cellular viability and functionality, as well as integrity and function of the extracellular matrix [5, 11–13]. Vitrification is generally accomplished through combination of high concentrations of cryoprotectants (CPAs) and rapid cooling and warming rates so that nucleation and growth of ice crystals are effectively minimized. Alternatively, recent work has shown that vitrification can be achieved by tracking the liquidus line, i.e., by gradually increasing the CPA concentration and cooling the cartilage sample [14]. In either case, vitrification of samples of clinically relevant thickness is particularly challenging. Characterizing mass transport properties of CPAs through articular cartilage is critical in addressing issues of cellular osmotic volume excursions and cytotoxicity to confer protection during cooling.
Nuclear magnetic resonance (NMR) imaging and spectroscopy are powerful, noninvasive tools that can be employed to monitor the permeation into tissues of CPAs with NMR-observable nuclei. NMR imaging can be used to obtain spatial information of CPA distribution at various times, revealing heterogeneities in CPA diffusion within the tissue. MR imaging techniques have been used to observe and quantify CPA permeation into various tissues including freeze-dried artificial dermal replacements [15], rat kidney and liver [16], zebrafish embryos [17] and human articular cartilage [18]. As is often the case in vitrification, however, multi-solute solutions are used [12, 20] and acquiring simultaneously the transport rates of all components of the CPA cocktail is essential for accuracy. NMR spectroscopy can be used to determine precise concentrations of multiple solutes simultaneously. Previously, NMR spectroscopy has been used as an offline tool to determine the permeation kinetics of CPAs into articular cartilage by measuring the concentration in the bulk solution [19]; in those studies, however, solutions containing a single CPA were used.
In this study, we addressed the critical issue of delivering and removing high concentrations of CPAs necessary for vitrification in articular cartilage. We utilized immature bovine articular cartilage, as this tissue is available, inexpensive, and can be prepared in the necessary dimensions to effectively study CPA transport. Furthermore, the developed methodologies can be easily extended to human cartilage. Diffusion of a single and multi-component CPAs were studied, and effective diffusivities were calculated. Equations for CPA transport through the extracellular matrix were coupled with equations for transport through the cell membrane. The model was used to design stepwise CPA addition and removal protocols, which minimized osmotic effects on cells, and to determine CPA equilibration times for tissue of clinically-relevant dimensions. The use of this information in designing optimized cryopreservation protocols is discussed.
Materials and methods
CHEMICALS
Unless otherwise stated, all chemicals were purchased at Sigma Chemical Company (St. Louis, MO USA).
TISSUE ISOLATION
Full thickness articular cartilage plugs (without bone) were harvested from the femoral condyle or femoropatellar groove of 1–2 week old calves (Research 87, Marlborough, MA) using a 8 mm sterile disposable biopsy punch (Miltex, Inc., York, PA USA). Cartilage plugs isolated were 8 mm in diameter and between 5–10 mm in thickness.
MR IMAGING SETUP, ACQUISITION AND ANALYSIS
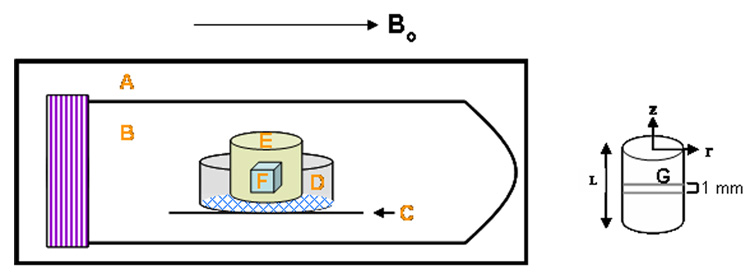
A cartilage plug was placed in a sample holder consisting of an 8 µm pore size membrane tissue culture insert (BD Biosciences, Franklin Lakes, NJ USA) placed on top of a cut Teflon® sheet with a hole of diameter slightly smaller than the diameter of the insert to ensure exposure of the membrane of the latter to the liquid solution. These were all contained within a 50 mL centrifuge tube (VWR International, Suwanee, GA USA) (Figure 1). The large pore size of the insert membrane prevented any mass transfer resistance of solute to the cartilage surface. The tube was filled with a 6.9 M DMSO solution (50% w/w) in 1 X PBS and quickly placed in a 3.8 cm inner diameter quadrature birdcage resonator. Imaging was performed on a Varian/Inova spectroscopy and imaging system operating at 4.7T (200.536 MHz at 22°C). A gradient insert (11.7 cm id) was enclosed in an outer standard gradient coil. The maximum gradient amplitude was 25 gauss/cm with a rise time of 250 µs. The final tissue orientation was such that the plane of the disk was parallel to the applied magnetic field direction. Following shimming to create a homogenous magnetic field and scout imaging to locate the imaging plane, a chemical shift selective imaging (CSSI) sequence was utilized to visualize diffusion of DMSO into the tissue. In the pulse sequence utilized, the initial 90° 16 ms gaussian pulse was chemical shift selective, but not slice selective. Slice selection was achieved with the 180° refocusing pulse which consisted of a 2 ms sinc waveform. 256 complex points were acquired in the read direction with 128 phase encoding steps. The data matrix was zero filled to 512 × 512 before 2–D Fourier transformation. The chosen field of view (4 cm × 4 cm) gave a final in-plane displayed resolution of 78 µm × 78 µm with a slice thickness of 1 mm. Four acquisitions were averaged for each image slice centered within the sample. The total imaging time for each scan was 51 minutes.
Figure 1. Schematic of NMR sample holder.
A: field of view of the radiofrequency coil; B: 50 mL centrifuge tube; C: Teflon piece holding tissue culture insert in place; D: 10 mm diameter tissue culture insert with 8 µm pore size membrane; E: cartilage plug; F: volume of interest (VOI) for localized spectroscopy studies; G: 1.0 mm thick plane for CPA imaging studies. The Teflon piece rested on the walls of the centrifuge tube and had a hole of diameter slightly smaller than the diameter of the insert to ensure exposure of the membrane of the latter to the liquid solution. Bo=magnetic field; figure not drawn to scale.
DMSO permeation was examined by monitoring the signal intensity over time. Mean brightness intensities inside the cartilage and in the bulk were determined for each image using freeware ImageJ analysis software (National Institutes of Health, USA). The mean intensities inside the tissue were normalized to the mean external solution intensity (Icartilage/Ibulk).
To aid in the proper choice of echo (TE) and repetition times (TR) during CSSI acquisition, relaxation parameters T1 (by inversion recovery) and T2 (Carr-Purcell-Meiboom-Gill, CPMG), were determined for the bulk CPA solution and within an equilibrated cartilage sample. Consequently, TE and TR were adjusted to reflect these relaxation times. T1 effects were assumed negligible due to long TR times used. Apparent T2 effects were estimated by taking images at different TE values for tissue equilibrated with the DMSO solution. Images were obtained from eight TE values (23, 43, 83, 123, 143, 183, 223, 263 ms) and were fit to the equation, M(t) = Mo exp(-t/T2), using an MR Analysis Calculator plug-in (author: Karl Schmidt) for ImageJ to yield T2 and Mo values, where M(t) is the magnetization vector at time t, Mo is the equilibrium magnetization vector, and T2 is the transverse relaxation time decay constant. Tissue and bathing solution image intensities could then be corrected for the effect of different apparent T2 values. The CPA concentration inside or outside the tissue is proportional to Mo in the respective position and the intensities are proportional to M(t) (i.e., Iinside/Ioutside=M(t)inside/M(t)outside). Hence, the ratio of intensities was multiplied by a T2 factor to take into account these effects. For images acquired at TE=23 ms (assuming constant T2 inside the tissue),
| (1) |
where C is the CPA concentration; Mo the equilibrium magnetization vector; I the signal intensity; T2 the transverse relaxation time decay constant; inside refers to the cartilage sample, outside refers to the bulk solution.
Based on equation 1, the raw intensity data inside the tissue were corrected for T2 effects by multiplying by e−23ms/1045ms/ e−23ms/116ms = 1.19. We considered the effects of molecular translational self diffusion on the decay of the MR signal during both the imaging and spectroscopy sequences, and determined that these are negligible relative to the measurements under our experimental conditions (less than 5%).
MR SPECTROSCOPY SETUP, ACQUISITION AND ANALYSIS
A cartilage plug was positioned in the magnet as above, standard 1H NMR gradient-echo scout images were acquired to locate the imaging plane, and localized 1H NMR spectra were acquired from a 1×1×1 mm3 voxel or volume of interest (VOI), centered within the cartilage plug using a localized point resolved spectroscopy sequence (PRESS) [21]. The final tissue orientation was the same as in the imaging experiments. Shimming of the water signal was performed on the selected VOI using a localized PRESS sequence.
The cartilage plug was initially submerged in 1 × PBS and the water content in the sample was measured. The PBS was completely removed and replaced with half strength of vitrification solution VS55 (1.55 M dimethyl sulfoxide, 1.1 M 1,2 propanediol, 1.55 M formamide) [5, 11, 20] in PBS at 22°C. The time from introducing the CPA solution to attaining the first spectrum was 30 minutes. The time required to collect each spectrum was 12 minutes, and data were acquired for approximately 6 hours.
Spectral data were processed using the frequency domain analysis package supplied in VNMR (Varian). Time domain data were apodized with an exponential line broadening of 5 Hz, Fourier transformed, and baseline corrected where necessary. A Lorentzian function was fit to the resulting peaks and integrated to determine the area under each peak, which is proportional to the respective solute concentration.
MATHEMATICAL MODELING AND CALCULATIONS
Multi-solute CPA transport within the cartilage plug was simulated with a two-compartment model to characterize diffusion within the cartilage matrix and across the chondrocyte cell membrane.
Model Assumptions
No CPA reaction or consumption by the cells or matrix.
Uniform cell distribution. This is a good assumption for immature cartilage where the cell distribution is relatively homogenous [22–24].
Isotropic effective diffusivities. The low molecular weight, non-electrolyte nature of the CPA solutes makes the isotropic transport assumption reasonable.
Isothermal experimental conditions.
Constant cell membrane permeabilities (independent of CPA concentration and position).
Chondrocytes in situ behave similarly as in cell suspensions with respect to osmotic volume excursions. This is indeed the case for a narrow range of osmotic concentrations, for which mid-zone bovine chondrocytes behave as perfect osmometers [7, 25, 26]. This assumption may fail for the larger osmotic changes encountered during stepwise CPA addition and removal. However, as volume excursions are more restricted with chondrocytes in situ relative to cells in suspension, designing CPA addition/removal protocols using the properties of cells in suspension is a more conservative approach in minimizing osmotic damage to cells by maintaining cell volume within tolerable limits.
No solute-solute interactions for multi-solute CPA transport across chondrocyte cell membrane or in the tissue matrix; CPA transport is driven only by its concentration gradient.
Concentration-dependence and non-ideality behavior of the solutes in the tissue similar to those in the bulk; also, ratio of effective diffusivity of CPA through cartilage to bulk solution diffusivity, Deff/Do, constant.
No concentration boundary layer, i.e., concentration at the surface of the tissue the same as in the bulk solution. This is justified because CPA diffusion is slow through the tissue.
CPA TRANSPORT ACROSS CELL MEMBRANE
To account for transport across the cell membrane, a multi-solute membrane transport model, extended from a two-parameter membrane formalism [27], was applied. The fluxes of water and of the ith solute through the membrane are as follows.
| (2) |
| (3) |
In the above, Vw (µm3) is the volume of water inside the cell; Lp (µm/sec•atm) the water permeability; A (µm2) the surface area of the cell; R ((µm3•atm)/(mol•K)) the universal gas constant; T (K) the absolute temperature; and (osmoles/kg) the external and internal osmolalities, respectively of the ith solute; Ni (moles) the intracellular amount of the ith solute; and Psi (µm/s) the ith solute permeability. Chondrocyte membrane permeabilities for DMSO and PD were taken from the literature [28] and are shown in Table 3. As no data are available on the formamide permeability for chondrocytes, the average of DMSO and PD permeabilities was used for this solute.
Table 3.
Values of model parameters
| Parameter | Value | Units | Source |
|---|---|---|---|
| Vb | 0.414 | [-] | [21] |
| Lp | 0.166 | [µm/min.atm] | [21] |
| Ps (DMSO, 22°C) | 7.88 × 10⁻² | [µm/s] | [21] |
| Ps (PD, 22°C) | 3.716 × 10⁻² | [µm/s] | [21] |
| Ps (Formamide, 22°C) | 7.88 × 10⁻² | [µm/s] | average of Ps for DMSO and PD |
| Deff (Sucrose, 22°C) | 5.49 × 10⁻¹⁰ | [m2/s] | [37] |
| B (2nd virial coefficient) (DMSO) | 0.0843 | [mol/kg]−1 | [25] |
| B (2nd virial coefficient) (PD) | 0.0576 | [mol/kg]−1 | [25] |
| B (2nd virial coefficient) (Formamide) | −0.0306 | [mol/kg]−1 | coefficient calculated on the basis of data from [38]; |
CPA TRANSPORT THROUGH CARTILAGE ECM
Transport for the ith solute through a cylindrical cartilage plug is described by the following equation, assuming angular symmetry and no reaction
| (4) |
with the following initial and boundary conditions
| (5) |
| (6) |
| (7) |
| (8) |
| (9) |
In the above, C is the CPA concentration; Deff the effective CPA diffusivity through the cartilage matrix; rA the rate of reaction per unit volume; r the radial position; Ro the radius of the cartilage plug; z the axial position; and t time. If, instead of cartilage, an osteochondral plug with a bone segment of significant thickness is considered, boundary conditions iv and v become:
where the osteochondral interface is at z=0 and the cartilage tissue extends to z=L.
DETERMINATION OF THE EFFECTIVE CPA DIFFUSIVITY THROUGH CARTILAGE MATRIX
Effective diffusivity, Deff, values were calculated from imaging and spectroscopic data as follows. For the imaging experiments, average intensities were calculated from the images of the 1.0 mm thick slab about the center of the plug. In the spectroscopy experiments, average concentrations (C̅i) came from a 1×1×1 mm3 volume in the center of a cartilage plug. Average concentrations were calculated by
| (10) |
C̅j/Cbulk profiles were fit using COMSOL Multiphysics™ (COMSOL, Inc, Burlington, MA) with Deff as the adjustable parameter (equation 4) using appropriate boundary and initial conditions (equations 5–9), sample dimensions and integration volumes. Least squares optimization was used to determine the best fit for Deff.
Bulk solution diffusivity calculations
High concentration solutions can be thermodynamically non-ideal, having diffusion coefficients strongly dependent on concentration [29]. To account for this, the following equation was used to calculate CPA diffusivities in the bulk [30]:
| (11) |
where DABFick is the Fickian diffusivity (m2/s) of the binary pair A–B (CPA-solvent); the thermodynamic factor which accounts for non-ideality; DASMS the Maxwell-Stefan (MS) diffusivity which accounts for the concentration dependency (m2/s); xA the mole fraction of solute; xB the mole fraction of solvent; γA the activity coefficient of the solute; the diffusivity at infinite-dilution of pair A–B (m2/s); and the diffusivity at infinite-dilution of pair B-A (m2/s), which were calculated from the Wilke-Chang equation [29]. Activity coefficients were calculated using the UNIFAC activity coefficient model [31]. Equation 11 was used to calculate bulk solute diffusivities as a function of composition for each CPA-water pair. An average diffusivity value was used between xA=0 and the final CPA concentration in the bulk. The ratio of diffusivities for a CPA between the cartilage and bulk, Deff/Do, could then be computed. This ratio represents the solute transport resistance due to the cartilage tissue. As indicated, this ratio was assumed constant for each CPA in this study.
CPA transport through matrix and across cell membrane
Intracellular solute osmolality and cell volume excursions for chondrocytes were simulated as a function of time at chosen points within a clinically relevant-sized cartilage tissue of 5 mm diameter and 2 mm length. This was implemented by coupling CPA concentrations in the matrix and intracellular compartments. The selected points were at the center and periphery of the tissue, as these represent the extreme locations for CPA equilibration.
Diffusivities used to determine CPA concentration profiles were calculated as follows Do for each CPA was determined at the particular bulk concentration as described in the previous section, and Deff was calculated by using the constant Deff/Do hindrance ratio. Concentration profiles in the matrix were generated by COMSOL using the appropriate initial and boundary conditions, and they were coupled with equations 2 and 3 using MATLAB (Mathworks, Natick, MA, USA). Due to the high concentration of VS55, CPAs were added in a step-wise manner to minimize cell osmotic effects. For CPA osmolalities, a multi-solute osmotic virial equation was used to account for solution non-idealities, as in Elliott et al. [32]. The osmolality calculations (relating CPA concentrations to ) were used in equations 2 and 3 to predict cell volume and intracellular CPA concentrations. For three solutes, the osmotic virial equation was extended as follows
| (12) |
where π is the osmolality (Osm); c1, c2, c3 the molal concentrations (moles of solute per kilogram of solvent) for DMSO, PD and FM, respectively; and B1, B2, B3 the second osmotic virial coefficients for DMSO, PD and FM, respectively. Virial coefficient values are listed in Table 3.
Results
1H NMR IMAGING AND SPECTROSCOPY
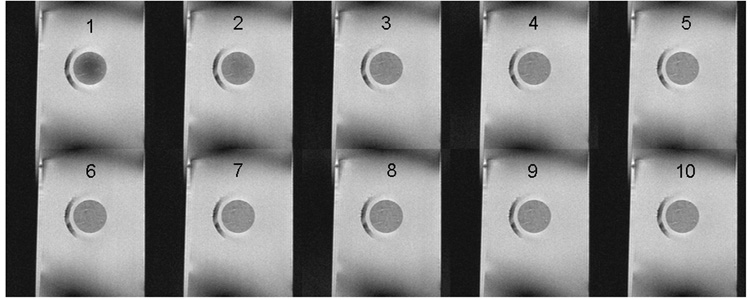
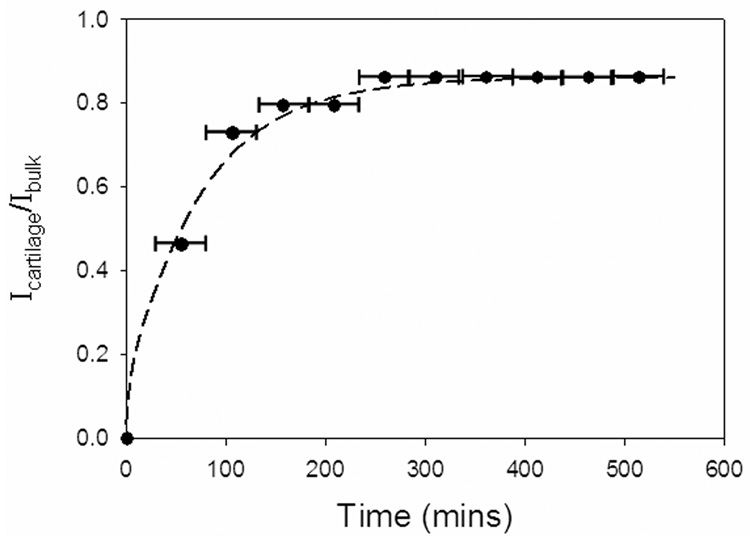
Single-solute permeation was monitored by chemical shift selective imaging (CSSI). Table 1 reports the measured relaxation parameters T1 and T2. The time constants for DMSO and water were lower in the tissue than in the bulk, as the tissue causes shortening of relaxation times. Images that tracked the diffusion of DMSO (water was not captured in this study) from a 6.9 M solution into the tissue are shown in Figure 2A. The ratio of brightness intensities in the tissue and in the bulk, Icartilage/Ibulk (Figure 2B), which is equal to the ratio of concentrations C̅i/C̅bulk, was fit to equations 4–9 with K set to 0.9 (based on the last experimental data point) and with Deff as the only adjustable parameter. The brightness intensity inside the tissue increased with time, indicating an influx of DMSO. Equilibrium between the tissue and the bulk took approximately 4 hours to establish. Evidently, 1H NMR imaging provides a clear assessment of permeation of a single CPA solution.
Table 1.
T1 and T2 values of 6.9 M DMSO in bulk solution and equilibrated in cartilage
| T1 (s) | T2 (s) | ||
|---|---|---|---|
| 6.9 M DMSO | DMSO | 1.99 | 1.70 |
| Water | 1.08 | 1.05 | |
| Equilibrated Cartilage Tissue |
DMSO | 1.86 | 0.669 |
| Water | 1.07 | 0.086 |
Figure 2. 1H NMR Imaging of DMSO diffusion in cartilage.
A. Time series montage of 1H NMR images from a 1.0 mm thick planar segment through the center of a cylindrical cartilage plug. Images are based on detection of DMSO, hence they present the permeation of this solute from a 6.9 M single-solute solution into the initially DMSO-free plug. Image 1 was acquired 81 minutes after exposing the tissue to the DMSO solution; each subsequent image was acquired 51 minutes from the preceding one.
B. Imaging signal intensity averaged over the acquisition plane (Icartilage), indicated by the horizontal bars at each time point, normalized to the signal intensity in the surrounding solution (Ibulk). Points are experimental measurements from one imaging experiment. Dashed line is the best-fit curve, using least-squares fitting and the DMSO effective diffusivity as the only adjustable parameter, of a Fickian diffusion model through the experimental data.
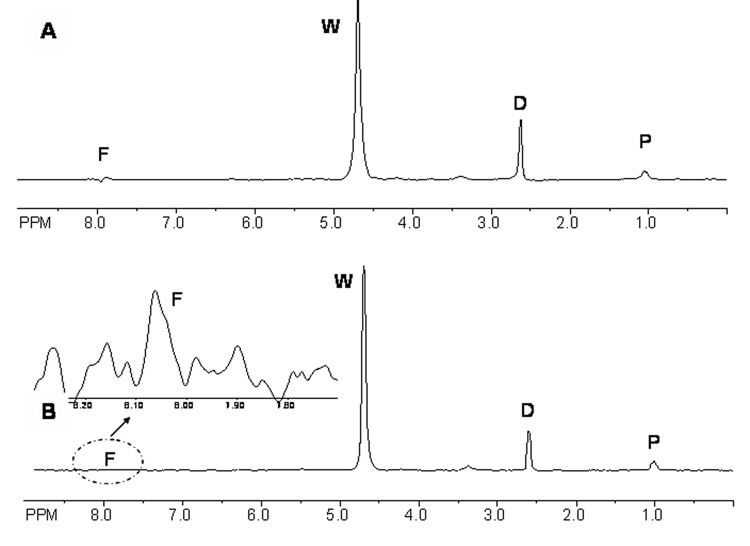
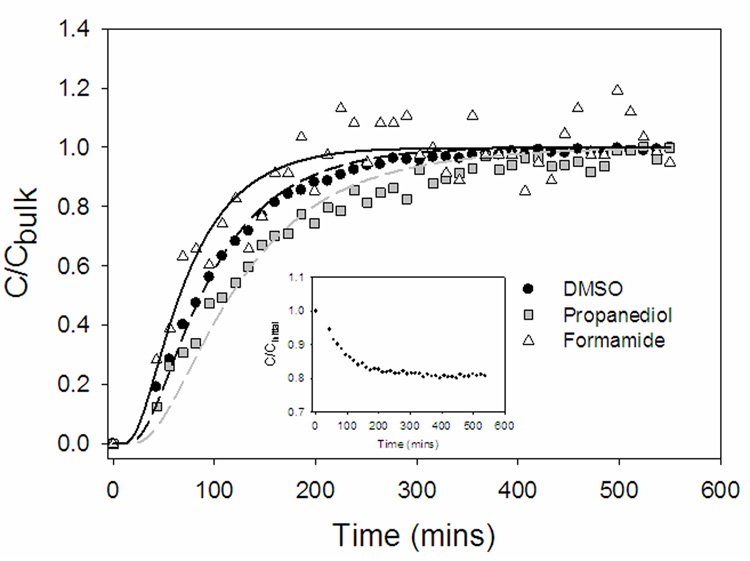
Figure 3 shows a typical 1H spectrum of half strength VS55, both in the bulk and inside cartilage after equilibration. The individual solutes are easily distinguishable and areas under the peaks correlate to the relative concentrations. Figure 4 shows the normalized (relative to the bulk) concentrations of the individual CPAs in the VOI over time. At equilibrium, the concentrations of all three CPAs in the tissue were equal to those in the bulk, consequently, K was set equal to 1. Formamide, the smallest solute with molecular weight 45 Da, diffused the fastest. As water was clearly detected in the spectra (Figure 3), its concentration in the tissue was also plotted vs. time (Figure 4, inset). Due to an osmotic difference between the inside and outside of the tissue, water efflux occurred. As with the 6.9 M DMSO, VS55 took 2–3 hours to equilibrate with the bulk solution. Simulated concentration profiles (Figure 4, lines) were generated by solving equations 4–9. In cartilage, solutes diffused at 30–38% of their rates in the bulk due to hindrance from the matrix. As the VOI was at the center of the larger tissue specimen, there was a time lag in the simulated concentration profiles corresponding to the time it took for the solutes to diffuse from the bulk to the VOI.
Figure 3.
A. 1H NMR spectrum of half strength VS55 cocktail (1.55 M DMSO, 1.55 M formamide, 1.05 M 1,2 propanediol) at 200MHz in a 1×1×1 mm3 volume of interest (VOI) in articular cartilage positioned in the center after CPA equilibration; B. 1H NMR spectra of half strength VS55 cocktail in the bulk at 200MHz in a 1×1×1 mm3 VOI; inset in B represents a zoom-in of the formamide peak for visualization; D=dimethyl sulfoxide; F= formamide; P=1,2 propanediol; W= water
Figure 4.
Representative concentration profiles of permeating half strength VS55 (1.55 M DMSO, 1.55 M formamide, 1.05 M 1,2 propanediol) into articular cartilage. Points are experimental measurements from localized 1H NMR spectroscopy from a 1×1×1 mm3 volume of interest (VOI) positioned in the center of the plug. Lines are best fit model simulations using the effective diffusivity of each component as the only adjustable parameter. Water was also detected in the 1H NMR spectra (Figure 3). As the tissue is exposed to a hypertonic CPA solution, water leaves the tissue simultaneously as the influx of the VS55 components occurs. The inset shows the decline in water concentration in the VOI, normalized to the initial water concentration (C/Cinitial), vs. time.
SIMULATIONS OF CELL VOLUME CHANGE AND INTRACELLULAR SOLUTE CONCENTRATION
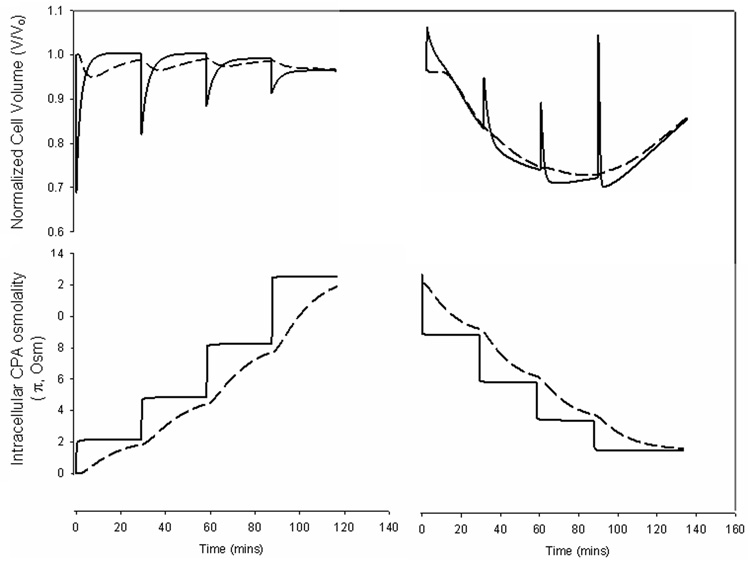
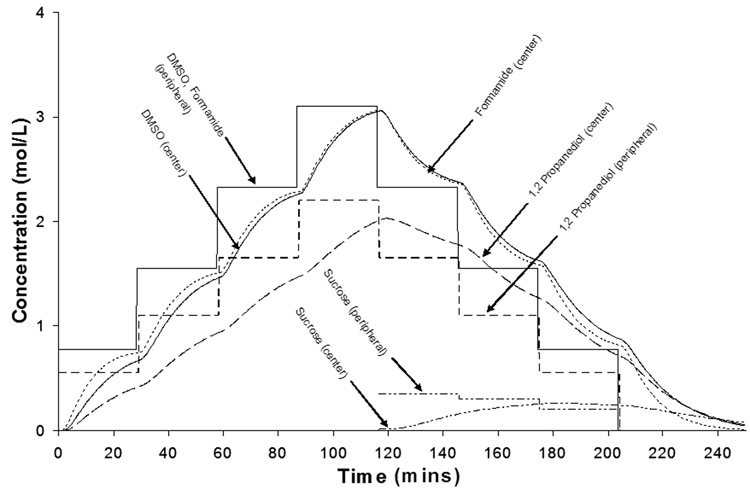
Figure 5 shows simulations of cell volume excursions and intracellular CPA concentrations for cells at the center and periphery of a 5 mm diameter and 2 mm thick cylinder of cartilage after stepwise addition and removal of VS55. CPA concentrations in the matrix were calculated using equations 4–9, intracellular CPA concentrations were calculated from equations 2–3, and cell volume excursions were computed as described by Kleinhans [27]. The partition coefficient was assumed to be 1, as indicated by the data in Figure 4. To maintain osmotic volume excursions within tolerable limits, estimated from previous studies [33], addition was carried out in four steps and removal also in four steps, in the presence of varying concentrations of sucrose (0.35, 0.3, 0.2, and 0 Molar), a non-permeating solute for osmotic buffering. A Deff/Do value of 0.34 was used for sucrose. The duration of each addition and removal step was determined so as to minimize the exposure time while ensuring at least 90% intracellular CPA equilibration for cells at the center relative to bulk before implementing the next step. Volume excursions at the periphery were larger than at the center, as cells at the center experienced smaller CPA concentration changes, attenuated by the diffusion of the solute through the tissue. Figure 6 shows simulated CPA and sucrose concentrations through the matrix. The addition and removal of VS55 took over 2 hours each at room temperature.
Figure 5.
Simulated normalized cell volume and intracellular CPA osmolality for chondrocytes at the periphery (solid lines) and the center (dashed lines) of a 5 mm diameter by 2 mm thick cartilage plug exposed to stepwise addition and removal of VS55 vitrification cocktail (3.1 M DMSO, 3.1 M formamide, 2.1 M 1,2 propanediol). Cell volumes were calculated assuming that the cells in the tissue behave similarly as in suspension with respect to osmotic volume excursions.
Figure 6.
Simulated concentration profiles of VS55 components in the matrix in a 5 mm diameter by 2 mm thick cartilage plug. Concentration profiles shown for points at the center and periphery of the plug.
Discussion
Effective osteochondral tissue banking relies upon successful long-term preservation. Conventional freezing and vitrification have been met with limited success for cartilage of clinically relevant dimensions. This study undertook a systematic modeling methodology, based on experimentally measured parameter values, to design CPA addition and removal protocols.
Experimentally, CPA transport was examined by NMR imaging and spectroscopy, and modeling calculations tracked two important parameters in ensuring a successful preservation outcome, namely, cell volume and intracellular CPA concentration. The partition coefficients measured by imaging and spectroscopy differed somewhat. The reason for this discrepancy is unclear; however, different solutions were used in the two experiments, and solute transport in the presence of multiple solutes may be different than transport of a single-solute system [34].
The effective CPA diffusivities determined in this study (Table 2A) were similar to those reported by others (Table 2B), although Muldrew et al. and Carsi et al. [18, 19] reported higher values. The ratios of CPA diffusivities through cartilage to water (Deff /Do) were 0.30–0.40, similar to those reported for other small, non-electrolyte solutes [35–37]. Effective diffusivities of 6.9 M DMSO through other tissues, such as kidney and liver, have been reported to be 180×10−10 and 50×10−10 m2/s, respectively, under ambient conditions [16]. Clearly, the lower diffusivities through cartilage (Table 2A) make this tissue more difficult to preserve.
Table 2.
| Table 2A: Effective diffusivities of each component of a multi-solute CPA solution through cartilage and their ratios to the corresponding diffusivities in bulk solution (Deff/Do) | ||
|---|---|---|
| Deff(average ± s.d) × 10−10 (m2/s) | Deff/Do | |
| DMSO in single-solute solution (measurement by NMR imaging) | 3.59 | 0.31 |
| VS55 cocktail(measurement by localized NMR spectroscopy) | ||
| DMSO | 4.63 ± 0.85* | 0.34 |
| 1,2 Propanediol | 3.47 ± 0.67* | 0.30 |
| Formamide | 6.67 ± 0.70* | 0.38 |
| Table 2B: Effective diffusivities of CPAs through articular cartilage from the literature | ||||||
|---|---|---|---|---|---|---|
| Cartilage Source | Dimensions | CPA | Concentration (M) | Deff × 10−10 (m2s) | Temp (°C) | Reference |
| mature porcine AC | no bone: d=10 mm, z=2–4 mm; with bone: d=10 mm, z=7–14 mm | DMSO | 6.8 | 3.5 (with and without bone) | 22 | [42] |
| PD | 6.8 | 2.0 (with bone) | 22 | [42] | ||
| immature and mature human AC | d=10mm, z=2.2–3.4 mm | DMSO | 1.4 | 17.9 | 37 | [18] |
| immature porcine AC | d=5 mm, z=2.9–5 mm | DMSO | 1 | 11.20 | 22 | [19] |
| immature ovine AC | d=6 mm, z=1 mm | DMSO | 1.4 | 4.06 | 22 | [41] |
| PD | 1.4 | 3.41 | ||||
Deff = effective diffusivity; Do = bulk diffusivity; s.d. = standard deviation;
values are averages ± s.d. from 3 independent experiments
This study was carried out with immature bovine articular cartilage, which can be easily obtained in thick sections, is inexpensive, and has a relatively homogeneous distribution of cells. As mature articular cartilage is heterogeneous and anisotropic with respect to both cellularity and extracellular matrix properties [38], studies with mature cartilage are needed. However, there exists evidence that transport of small, uncharged molecules is similar in immature and mature tissue. For instance, Torzilli et al. reported that the biochemical changes brought on by skeletal maturation did not significantly affect the diffusion of glucose and 10 kDa dextran through bovine articular cartilage, despite associated changes in the spatial distribution of interstitial water, extracellular collagen and proteoglycan content [39]. Hence, the results of this study with small (45–78 Da), uncharged solutes are potentially applicable to mature articular cartilage. Similarly, differences in effective diffusivities and cell membrane permeabilities are expected to exist with cartilage from other species, so appropriate parameter values need to be used in each case for designing the CPA addition and removal protocols. Overall, however, the time to equilibration is expected to be of same order for cartilage specimens of the same size, irrespective of species and age.
Mathematical modeling was used to determine chondrocyte volume excursions and intracellular CPA concentrations at different locations in the cartilage specimen. The model incorporated multi-component CPAs diffusing across the cell membrane and non-idealities of the high concentration CPA solutions. Chondrocytes in tissue probably undergo smaller volumetric excursions than cells in suspension for the same step changes in CPA concentration. Hence, it is possible that the number of CPA addition/removal steps could be reduced, however, basing the calculations on the properties of cells in suspension is a more conservative approach for minimizing osmotic damage to cells. This information coupled with cytotoxicity data (cell death from CPA exposure as function of time, concentration and temperature) could optimize exposure to CPA for maximal cell viability with sufficient intracellular CPA concentration for vitrification. Recent work showing the impact of fixed charge density on CPA permeation into articular cartilage [41] could also be incorporated in the model structure.
The diffusivity measurements in this study were carried out at room temperature. Often CPAs are added and/or removed at 0−4°C to reduce CPA cytotoxic effects. The different effects of temperature on mass transport and cytotoxicity pose an optimization problem, as at lower temperatures CPA cytotoxicity is reduced but the time to equilibration is increased. Knowing the temperature dependence of CPA transport and cytotoxicity would allow the present model to be extended in designing CPA addition/removal protocols by manipulating both concentrations and temperature in the bulk.
Cryopreservation of biological materials deals with mass transport of CPAs and heat transport during cooling and thawing. Diffusion of CPAs into cartilage tissue is slow [ this study, 35–37], so chondrocyte survival is limited to the superficial layer [2, 4, 43] or to both superficial and deep, but not the intermediate, zones [44]. Cell survival could be improved by enhancing CPA transport, for example by introducing convection by boring holes into the tissue [45]. Diffusion of CPAs is faster in tissue engineered cartilage [46], therefore cryopreservation of the latter might be easier to accomplish. With regard to heat transport, preliminary data from our lab (unpublished) and Johma et al. [47] suggest that temperature equilibration occurs in minutes, as opposed to hours for CPA equilibration. However, heat transport is critical and further studies are needed to characterize its role in cartilage cryopreservation.
In conclusion, this study used experimentally measured diffusivities of CPAs through articular cartilage, which were incorporated in mathematical models simulating multi-step addition and removal. This study constitutes a first step toward the eventual goal of developing, optimizing and validating models of 3-D tissue cryopreservation based on parameters that are accurately measured experimentally.
Acknowledgements
This research was funded by the NIH under award number DK73991; Georgia Tech-Emory Center (GTEC) for the Engineering of Living Tissues, an ERC Program of the National Science Foundation under award number EEC-9731643; GAANN Fellowship from the U.S. Department of Education (for I.N.M.) by the Center for Drug Discovery, Development and Delivery (CD4); Georgia Tech Presidential Undergraduate Research Award (for Y.L.). The authors thank Professor William J. Koros for helpful discussions regarding multi-solute mass transport and Professor Marc Levenston for donating some of the articular cartilage tissue used in this study.
Footnotes
Publisher's Disclaimer: This is a PDF file of an unedited manuscript that has been accepted for publication. As a service to our customers we are providing this early version of the manuscript. The manuscript will undergo copyediting, typesetting, and review of the resulting proof before it is published in its final citable form. Please note that during the production process errors may be discovered which could affect the content, and all legal disclaimers that apply to the journal pertain.
References
- 1.Bakay A, Csonge L, Papp G, Fekete L. Osteochondral resurfacing of the knee joint with allograft. Clinical analysis of 33 cases. Int Orthop. 1998;22:277–281. doi: 10.1007/s002640050260. [DOI] [PMC free article] [PubMed] [Google Scholar]
- 2.Malinin TI, Martinez OV, Brown MD. Banking of massive osteoarticular and intercalary bone allografts--12 years' experience. Clin Orthop Relat Res. 1985:44–57. [PubMed] [Google Scholar]
- 3.Marco F, Leon C, Lopez-Oliva F, Perez AJ, Sanchez-Barba A, Lopez-Duran Stern L. Intact articular cartilage cryopreservation. In vivo evaluation. Clin Orthop Relat Res. 1992:11–20. [PubMed] [Google Scholar]
- 4.Ohlendorf C, Tomford WW, Mankin HJ. Chondrocyte survival in cryopreserved osteochondral articular cartilage. J Orthop Res. 1996;14:413–416. doi: 10.1002/jor.1100140311. [DOI] [PubMed] [Google Scholar]
- 5.Song YC, Lightfoot FG, Chen Z, Taylor MJ, Brockbank KGM. Vitreous preservation of rabbit articular cartilage. Cell Preservation Technology. 2004;2 [Google Scholar]
- 6.Muldrew K, Novak K, Yang H, Zernicke R, Schachar NS, McGann LE. Cryobiology of articular cartilage: ice morphology and recovery of chondrocytes. Cryobiology. 2000;40:102–109. doi: 10.1006/cryo.2000.2236. [DOI] [PubMed] [Google Scholar]
- 7.Pegg DE, Wang L, Vaughan D, Hunt CJ. Cryopreservation of articular cartilage. Part mechanisms of cryoinjury. Cryobiology. 2006;52:347–359. doi: 10.1016/j.cryobiol.2006.01.007. [DOI] [PubMed] [Google Scholar]
- 8.Pegg DE. The current status of tissue cryopreservation. Cryo Letters. 2001;22:105–114. [PubMed] [Google Scholar]
- 9.Stone BB, Defranzo BE, Dicesare C. Cryopreservation of human articular cartilage for autologous chondrocyte transplantation. Cryobiology. 1998;37:445–446. [Google Scholar]
- 10.Tomford WW, Fredericks GR, Mankin HJ. Studies on cryopreservation of articular cartilage chondrocytes. J Bone Joint Surg Am. 1984;66:253–259. [PubMed] [Google Scholar]
- 11.Mukherjee N, Chen Z, Sambanis A, Song Y. Effects of cryopreservation on cell viability and insulin secretion in a model tissue-engineered pancreatic substitute (TEPS) Cell Transplant. 2005;14:449–456. doi: 10.3727/000000005783982882. [DOI] [PubMed] [Google Scholar]
- 12.Song YC, An YH, Kang QK, Li C, Boggs JM, Chen Z, et al. Vitreous preservation of articular cartilage grafts. J Invest Surg. 2004;17:65–70. doi: 10.1080/08941930490422438. [DOI] [PubMed] [Google Scholar]
- 13.Song YC, Hagen PO, Lightfoot FG, Taylor MJ, Smith AC, Brockbank KG. In vivo evaluation of the effects of a new ice-free cryopreservation process on autologous vascular grafts. J Invest Surg. 2000;13:279–288. doi: 10.1080/08941930050206300. [DOI] [PubMed] [Google Scholar]
- 14.Pegg DE, Wang L, Vaughan D. Cryopreservation of articular cartilage. Part 3: the liquidus-tracking method. Cryobiology. 2006;52:360–368. doi: 10.1016/j.cryobiol.2006.01.004. [DOI] [PubMed] [Google Scholar]
- 15.Bidault NP, Hammer BE, Hubel A. Rapid MR imaging of cryoprotectant permeation in an engineered dermal replacement. Cryobiology. 2000;40:13–26. doi: 10.1006/cryo.1999.2216. [DOI] [PubMed] [Google Scholar]
- 16.Isbell SA, Fyfe CA, Ammons RL, Pearson B. Measurement of cryoprotective solvent penetration into intact organ tissues using high-field NMR microimaging. Cryobiology. 1997;35:165–172. doi: 10.1006/cryo.1997.2037. [DOI] [PubMed] [Google Scholar]
- 17.Hagedorn M, Hsu EW, Pilatus U, Wildt DE, Rall WR, Blackband SJ. Magnetic resonance microscopy and spectroscopy reveal kinetics of cryoprotectant permeation in a multicompartmental biological system. Proc Natl Acad Sci U S A. 1996;93:7454–7459. doi: 10.1073/pnas.93.15.7454. [DOI] [PMC free article] [PubMed] [Google Scholar]
- 18.Carsi B, Lopez-Lacomba JL, Sanz J, Marco F, Lopez-Duran L. Cryoprotectant permeation through human articular cartilage. Osteoarthritis Cartilage. 2004;12:787–792. doi: 10.1016/j.joca.2004.06.013. [DOI] [PubMed] [Google Scholar]
- 19.Muldrew K, Sykes B, Schachar N, McGann L. Permeation Kinetics of Dimethyl Sulfoxide in Articular Cartilage. Cryo-Letters. 1996;17:331–340. [Google Scholar]
- 20.Song YC, Khirabadi BS, Lightfoot F, Brockbank KG, Taylor MJ. Vitreous cryopreservation maintains the function of vascular grafts. Nat Biotechnol. 2000;18:296–299. doi: 10.1038/73737. [DOI] [PubMed] [Google Scholar]
- 21.Bottomley PA. Selective volume method for performing localized NMR spectroscopy In. USA: General Electric Company; 1984. vol. 4480228, G01R 3308 ed. [Google Scholar]
- 22.Jadin KD, Wong BL, Bae WC, Li KW, Williamson AK, Schumacher BL, et al. Depth-varying density and organization of chondrocytes in immature and mature bovine articular cartilage assessed by 3d imaging and analysis. J Histochem Cytochem. 2005;53:1109–1119. doi: 10.1369/jhc.4A6511.2005. [DOI] [PubMed] [Google Scholar]
- 23.Williamson AK, Chen AC, Masuda K, Thonar EJ, Sah RL. Tensile mechanical properties of bovine articular cartilage: variations with growth and relationships to collagen network components. J Orthop Res. 2003;21:872–880. doi: 10.1016/S0736-0266(03)00030-5. [DOI] [PubMed] [Google Scholar]
- 24.Williamson AK, Chen AC, Sah RL. Compressive properties and function-composition relationships of developing bovine articular cartilage. J Orthop Res. 2001;19:1113–1121. doi: 10.1016/S0736-0266(01)00052-3. [DOI] [PubMed] [Google Scholar]
- 25.Bush PG, Hall AC. The osmotic sensitivity of isolated and in situ bovine articular chondrocytes. J Orthop Res. 2001;19:768–778. doi: 10.1016/S0736-0266(01)00013-4. [DOI] [PubMed] [Google Scholar]
- 26.Bush PG, Hall AC. Regulatory volume decrease (RVD) by isolated and in situ bovine articular chondrocytes. J Cell Physiol. 2001;187:304–314. doi: 10.1002/jcp.1077. [DOI] [PubMed] [Google Scholar]
- 27.Kleinhans FW. Membrane permeability modeling: Kedem-Katchalsky vs a two-parameter formalism. Cryobiology. 1998;37:271–289. doi: 10.1006/cryo.1998.2135. [DOI] [PubMed] [Google Scholar]
- 28.Xu X, Cui Z, Urban JP. Measurement of the chondrocyte membrane permeability to Me2SO, glycerol and 1,2-propanediol. Med Eng Phys. 2003;25:573–579. doi: 10.1016/s1350-4533(03)00073-0. [DOI] [PubMed] [Google Scholar]
- 29.Hines AL, Maddox RN. Mass transfer : fundamentals and applications. Englewood Cliffs, N.J.: Prentice-Hall; 1985. [Google Scholar]
- 30.Taylor R, Krishna R. Multicomponent mass transfer. New York: Wiley; 1993. [Google Scholar]
- 31.Sandler SI. Chemical and engineering thermodynamics. 3rd Edition. New York: Wiley; 1999. [Google Scholar]
- 32.Elliott JA, Prickett RC, Elmoazzen HY, Porter KR, McGann LE. A multisolute osmotic virial equation for solutions of interest in biology. J Phys Chem B. 2007;111:1775–1785. doi: 10.1021/jp0680342. [DOI] [PubMed] [Google Scholar]
- 33.Mukherjee IN, Song YC, Sambanis A. Cryoprotectant delivery and removal from murine insulinomas at vitrification-relevant concentrations. Cryobiology. 2007;55:10–18. doi: 10.1016/j.cryobiol.2007.04.002. [DOI] [PMC free article] [PubMed] [Google Scholar]
- 34.Xu X, Cui ZF. Modeling of the co-transport of cryoprotective agents in a porous medium as a model tissue. Biotechnol Prog. 2003;19:972–981. doi: 10.1021/bp025674n. [DOI] [PubMed] [Google Scholar]
- 35.Burstein D, Gray ML, Hartman AL, Gipe R, Foy BD. Diffusion of small solutes in cartilage as measured by nuclear magnetic resonance (NMR) spectroscopy and imaging. J Orthop Res. 1993;11:465–478. doi: 10.1002/jor.1100110402. [DOI] [PubMed] [Google Scholar]
- 36.Maroudas A. Distribution and diffusion of solutes in articular cartilage. Biophys J. 1970;10:365–379. doi: 10.1016/S0006-3495(70)86307-X. [DOI] [PMC free article] [PubMed] [Google Scholar]
- 37.Urban JP. Solute transport between tissue and environment. New York: Academic Press; 1990. [Google Scholar]
- 38.Hunziker EB. Articular cartilage structure in humans and experimental animals. In: Kuettner KE, Schleyerbach R, Peyron JG, Hascal VC, editors. Articular Cartilage and Osteoarthritis. New York: Raven; 1992. [Google Scholar]
- 39.Torzilli PA, Grande DA, Arduino JM. Diffusive properties of immature articular cartilage. J Biomed Mater Res. 1998;40:132–138. doi: 10.1002/(sici)1097-4636(199804)40:1<132::aid-jbm15>3.0.co;2-q. [DOI] [PubMed] [Google Scholar]
- 40.He Y, Devireddy RV. An inverse approach to determine solute and solvent permeability parameters in artificial tissues. Ann Biomed Eng. 2005;33:709–718. doi: 10.1007/s10439-005-1511-x. [DOI] [PubMed] [Google Scholar]
- 41.Shaozhi Z, Pegg DE. Analysis of the permeation of cryoprotectants in cartilage. Cryobiology. 2007;54:146–153. doi: 10.1016/j.cryobiol.2006.12.001. [DOI] [PubMed] [Google Scholar]
- 42.Sharma R, Law GK, Rekieh K, Abazari A, Elliott JA, McGann LE, et al. A novel method to measure cryoprotectant permeation into intact articular cartilage. Cryobiology. 2007;54:196–203. doi: 10.1016/j.cryobiol.2007.01.006. [DOI] [PubMed] [Google Scholar]
- 43.Malinin TI, Mnaymneh W, Lo HK, Hinkle DK. Cryopreservation of articular cartilage. Ultrastructural observations and long-term results of experimental distal femoral transplantation. Clin Orthop Relat Res. 1994:18–32. [PubMed] [Google Scholar]
- 44.Muldrew K, Hurtig M, Novak K, Schachar N, McGann LE. Localization of freezing injury in articular cartilage. Cryobiology. 1994;31:31–38. doi: 10.1006/cryo.1994.1004. [DOI] [PubMed] [Google Scholar]
- 45.Kawabe N, Yoshinao M. Cryopreservation of cartilage. Int Orthop. 1990;14:231–235. doi: 10.1007/BF00178751. [DOI] [PubMed] [Google Scholar]
- 46.Leddy HA, Awad HA, Guilak F. Molecular diffusion in tissue-engineered cartilage constructs: effects of scaffold material, time, and culture conditions. J Biomed Mater Res B Appl Biomater. 2004;70:397–406. doi: 10.1002/jbm.b.30053. [DOI] [PubMed] [Google Scholar]
- 47.Jomha NM, Anoop PC, McGann LE. Intramatrix events during cryopreservation of porcine articular cartilage using rapid cooling. J Orthop Res. 2004;22:152–157. doi: 10.1016/S0736-0266(03)00158-X. [DOI] [PubMed] [Google Scholar]
- 48.Aspen Technology I. Aspen Properties. Cambridge, MA: 1994–2006. [Google Scholar]
- 49.Lilley TH, Wood RH. Freezing Temperatures of Aqueous Solutions Containing Formamide, Acetamide, Propionamide and N,N-Dimethylformamide. J.C.S. Faraday I. 1980;76:901–905. [Google Scholar]


