

Abstract
Translocator protein (TSPO) is an 18-kDa cholesterol-binding protein that is expressed at high levels in steroid synthesizing and several cancer cells where it is involved in steroidogenesis and cell proliferation, respectively. The factors regulating Tspo expression are unknown. We analyzed Tspo transcriptional responses to the tumor promoter, phorbol-12-myristate 13-acetate (PMA), in cells with varying TSPO levels. PMA induced Tspo promoter activity and Tspo mRNA levels in TSPO-poor non-steroidogenic cells (NIH-3T3 fibroblasts and COS-7 kidney), but not in TSPO-rich steroidogenic cells (MA-10 Leydig) with high basal Tspo transcriptional activity. The stimulatory effect of PMA was mediated by an 805-515-bp region upstream of the transcription start site. Electrophoretic mobility shift assay (EMSA) revealed that PMA induced binding of c-jun and GA-binding protein transcription factor (GABP-α) to their respective activator protein 1(AP1) and v-ets erythroblastosis virus E26 oncogene homolog (Ets) sites in this region. Protein kinase C (PKC)-specific inhibitors blocked PMA induction of Tspo promoter activity with an inhibition profile suggestive of involvement of PKCε. PKCε expression correlated with TSPO content in the three cell lines. In NIH-3T3 cells, PKCε overexpression induced Tspo promoter activity, mRNA levels and enhanced PMA-induced up regulation of c-jun and TSPO. In MA-10 cells, a PKCε-specific translocation inhibitor peptide reduced basal Tspo promoter activity. PKCε siRNA pool reduced PKCε and TSPO levels in MA-10 cells indicating a role for PKCε in regulating TSPO expression. Taken together, these data suggest that elevated TSPO expression in steroidogenic cells maybe due to high constitutive expression of PKCε that renders them unresponsive to further induction while PMA activation of PKCε drives inducible TSPO expression in non-steroidogenic cells, likely through AP1 and Ets.
The Translocator Protein (18kDa;TSPO), formerly known as the Peripheral-Type Benzodiazepine Receptor, is a high-affinity drug- and cholesterol-binding protein that was first identified in 1977 as an alternative binding site in the kidney for the benzodiazepine diazepam (1,2). TSPO binds various classes of organic compounds, including isoquinoline carboxamides such as PK11195 (3). TSPO is found in most tissues, although its expression among each tissue varies considerably (1,3,4). Secretory and glandular tissues, especially steroid hormone producing cells, are particularly rich in TSPO (1). Intermediate levels of this protein are found in renal and myocardial tissues, and lower levels are present in the brain and liver (1,5). TSPO resides primarily in the outer mitochondrial membrane, where it regulates the transport of the steroid hormone precursor, cholesterol, to the inner mitochondrial membrane. This transport process is the rate-determining step in steroidogenesis (1). The ubiquitous expression of TSPO, taken with its ability to bind cholesterol with high affinity (1) suggests that, in non-steroidogenic cells, TSPO regulates mitochondrial cholesterol compartmentalization and membrane biogenesis, events critical for mitochondrial function and multiple cellular processes (1). Indeed, in addition to its well-established role in steroidogenesis, TSPO has been implicated in cellular respiration, oxidative processes, proliferation, and apoptosis (1,3).
Compared to normal human tissues, cancerous tissues of the breast, ovary, colon, prostate and liver contain elevated levels of TSPO, implying that TSPO may participate in carcinogenesis (6-10). The finding that TSPO expression is positively correlated with the metastatic potential of human breast and brain tumors supports this idea (1,6-8). A number of physiological and pharmacological modulators have been shown to alter TSPO levels. These modulators include peroxisome proliferators, IL-1, ginkgolide B, TNF-α, serotonin, norepinephrine, and dopamine (3,4,11). Among these, peroxisome proliferators and ginkgolide B have been shown to reduce Tspo gene transcription (12,13).
Despite a wealth of data on TSPO expression, little is known about the mechanisms underlying the transcriptional regulation of Tspo. Sequence analysis of the mouse Tspo promoter revealed that this promoter lacks TATA and CCAAT elements, but contains a series of proximal GC boxes. This promoter also harbored a number of putative binding sites for transcription factors such as v-ets erythroblastosis virus E26 oncogene homolog (Ets), AP1, specificity protein 1/specificity protein 3 (Sp1/Sp3), AP2, Ik2, GATA, SOX, and SRY (5). In an analysis of the mechanisms underlying differential Tspo transcription in TSPO-rich steroidogenic Leydig cells and non-steroidogenic fibroblasts, two proximal Sp1/Sp3 sites and members of the Ets family of transcription factors were found to be important for basal transcriptional activity (5,14). These studies demonstrated that separate regions of the promoter drive TSPO transcription in steroidogenic cells and non-steroidogenic cells (5), suggesting that tissue-specific transcriptional regulation accounts for differences in TSPO expression between these cell types. However, the factors mediating the increased Tspo expression in steroidogenic and tumor cells remain unknown.
Phorbol esters such as phorbol 12-myristate 13-acetate (PMA) promote skin tumor formation, making them useful tools in experimental carcinogenesis studies (15). PMA activates several isoforms of Protein Kinase C (PKC). PKC is a critical component of signal transduction pathways engaged by diverse stimuli in a variety of cell types (16). The PKC family comprises 11 known serine-threonine protein kinase isoforms with different biological functions (17). These isoforms can be divided into three groups based on activation requirements. Conventional PKC isoenzymes (α, βI, βII, γ) require phosphatidylserine, diacylglycerol, and Ca2+ for activation. The unconventional or typical isoforms (δ, θ, ε, η) require phosphatidylserine and diacylglycerol, but not Ca2+ for their activation. The atypical group (ξ, λ) requires only phosphatidylserine. PKC isoform expression and distribution is cell-type and condition-specific (18).
PKC isoforms participate in diverse biological processes including cell proliferation, differentiation, apoptosis, steroidogenesis, and carcinogenesis (19). PKC plays a critical role in steroid production through regulation of gene expression (20-22). In addition, several PKC isoforms participate in cancer development, formation, progression, suppression and/or metastasis (19). PKCε, in particular, has been shown to be involved in tumor cell invasion, metastasis, and recurrence (23) and is abundant in endocrine, neuronal, and immune cells (23-24). Here, we analyzed Tspo transcriptional responses in steroidogenic (MA-10 mouse tumor Leydig cells) and non-steroidogenic cells (NIH-3T3 mouse fibroblasts and SV-40 transformed COS-7 monkey kidney cells). Our data reveal that high levels of endogenous PKCε regulate Tspo expression in TSPO-rich steroidogenic cells while PMA induces Tspo expression in TSPO-poor non-steroidogenic cells, with PKCε mediating this effect.
Materials and Methods
Cell Culture
MA-10 cells were a gift from Mario Ascoli (University of Iowa, Ames, IA). Cells were cultured in T75 cm2-cell culture flasks (Dow Corning Corp., Corning, NY) and grown in DMEM/Ham-F12 nutrient mixture (Sigma Chemical Co., St. Louis, MO) supplemented with 5% fetal bovine serum and 2.5% heat-inactivated horse serum (Life Technologies, Gaithersburg, MD). NIH-3T3 cells and SV40-transformed COS-7 monkey kidney cells (Lombardi Cancer Center Tissue Culture Facility, Washington, DC) were maintained in DMEM supplemented with 10% normal calf serum and fetal bovine serum, respectively. Before experimentation, MA-10, NIH-3T3, and COS-7 cells were allowed to recover from plating for 24 h.
Determination of TSPO Levels
TSPO levels were indirectly determined by measuring binding of [3H]PK11195 [1-(2-chlorophenyl)-N-methyl-N-(1-methyl-propyl)-3-isoquinoline carboxamide] (SA, 85.5 Ci/mmol, NEN Life Science Products) to cellular protein extracts. The assay was performed as previously described (25). In brief, cells were scraped from 150 mm culture dishes into 5 ml PBS, dispersed by trituration: and centrifuged at 1200 × g for 5 min. The cell pellets were resuspended in PBS, and binding studies performed on 5 μg protein for MA-10 and 50 μg for NIH-3T3 or COS-7 from the cell suspensions. After 120 min incubation, assays were stopped by filtration through Whatman GF/C filters and washed with 15 ml ice-cold PBS. Radioactivity trapped on the filters was determined by liquid scintillation counting at 50% counting efficiency. The dissociation constant (Kd) and the number of binding sites (Bmax) were determined by Scatchard plot analysis of the data using the LIGAND program (KBLL, version 4.0, Biosoft, Ferguson, MO).
Immunoblotting
MA-10, NIH-3T3, and COS-7 cells were lysed in cold RIPA buffer (Cell Signaling, Danvers, MA) supplemented with Halt protease inhibitor cocktail (Pierce, Rockford, IL). Protein was measured using a standard Bradford assay (Bio-Rad, Hercules, CA). Proteins (15 μg) were electrophoresed on 4-12% tris-glycine polyacrylamide gels (Invitrogen), transferred onto nitrocellulose membranes, and probed with antibodies to PKCε (sc-214, Santa Cruz, Biotechnology, Santa Cruz, CA), TSPO (26), c-jun (sc-44-g, Santa Cruz), p-c-Jun (Ser73) (9164, Cell Signaling Technology, Danvers, MA), or GAPDH (Trevigen, Gaithersburg, MD). Immunoreactive proteins were then visualized by enhanced chemiluminescence (Amersham, Piscataway, NJ).
Luciferase Reporter Constructs and In Vitro-Directed Mutagenesis
A 2700-bp fragment of the Tspo promoter was cloned upstream of a firefly luciferase gene in pGL3-basic (pGL3-2700), and a series of 5′ unidirectional deletions were made (pGL3-805, -585, -515, -301, -214, -123, and -15) as described previously (5). Plasmids with point mutations were generated using pGL3-805 as a template and by PCR with overlapping primers containing the mutation (14). All plasmid sequences were verified through DNA sequencing.
Transfection and Luciferase Assay
MA-10, NIH-3T3, and COS-7 cells were seeded in 6-well plates at a density of 90,000 cells per well for MA-10 and NIH-3T3 and 150,000 for COS-7 cells per well. Transfection of reporter plasmids (1.5 μg) was performed 24 h later using fugene6 (Roche, Indianapolis, IN) for MA-10 cells and polyfect (Qiagen, Valencia, CA) for NIH-3T3 and COS-7 cells. All cultures received equimolar amounts of experimental constructs, with PUC19 or empty vector being used to keep the final amount of DNA constant. All cultures were co-transfected with a Renilla luciferase reporter under the control of the thymidine kinase promoter (PRLTK, Promega Corp. Madison, WI) to normalize for transfection efficiency. Twenty-four hours after transfection, cells were treated with PMA (Sigma-Aldrich), dimethylsulfoxide (DMSO, vehicle) (Sigma-Aldrich), or 4α-phorbol 12-myristate 13-acetate (4α-PMA) (Promega Corp.) for 24 h or as otherwise indicated. Cellular extracts obtained with 1 X passive lysis buffer (Promega Corp.) were then processed with the Dual-Luciferase Reporter System (Promega Corp.), and activity was measured using the Victor2 automated plate reader (Perkin Elmer, Waltham, Massachusetts).
Quantitative Real Time (QRT)-PCR
MA-10, NIH-3T3, and COS-7 cells (∼1 × 10⁶) were seeded in 100 mm2 plates and treated with DMSO or PMA 24 h later. RNA was extracted using the Rneasy Kit (Qiagen) according to the manufacturer's instructions. RNA (1 μg) was reverse transcribed, and the resulting cDNA was used as a template for real time PCR using Tspo specific primers and SYBR GREEN dye. Mouse primers were used for MA-10 and NIH-3T3 cells. Primer sequences for amplification of COS-7 TSPO mRNA (forward, 5′-AGCCTGGGGTGCTTCGTG-3′; reverse, 5′-TGTCGGGCACCAAAGAAGAT-3′) were designed from a region of the COS-7 Tspo promoter that was conserved with the human, cow, pig, mouse, and rat promoters. TSPO mRNA was quantified using the standard curve method. Amplification of 18s ribosomal RNA served as a control.
Cell Proliferation Assay
NIH-3T3 and COS-7 cells were seeded in 96-well plates at a density of 1000 cells/well, while MA-10 cells were plated at a density of 750 cells/well. Cellular proliferation was determined by Brdu incorporation using a commercially available kit (Roche). Brdu labeling was performed according to the manufacturer's protocol using a labeling time of 6 h.
Preparation of Nuclear Extracts and Electrophoretic Mobility Shift Assay (EMSA)
Nuclear extracts were prepared using NE-PER nuclear and cytosolic extraction reagents (Pierce Chemical Co., Rockford, IL). For EMSA, double-stranded, 5′-biotinylated oligonucleotides containing wild type and mutant AP1-binding sequences (Table I) were incubated with 5 μg of NIH/3T3 nuclear extracts. Unlabeled double-stranded AP1 and Ets oligonucleotides were used for competition experiments. EMSA was carried out using the LightShift Chemiluminescent EMSA kit (Pierce Chemical Co.) in the presence of EDTA and Mg2+. The manufacturer's protocol was slightly modified to optimize protein-DNA interactions in the presence of antibodies. DNA-protein complexes were separated on 6% nondenaturing polyacrylamide gels, transferred to nylon membranes, and processed for visualization. All antibodies used were purchased from Santa Cruz Biotechnology (c-fos: sc-52-g, c-jun:sc-44-g, GABP-α: sc-22810-g, Santa Cruz)
Table 1.
Oigonucleotide Sequences Used in Electrophoretic Mobility Shift Assays
| Oligonucleotide Name | Sequence |
|---|---|
| S-Ap1 wt | CTCTAATTGACTCACAGGAAGAGGTT |
| AS-AP1 wt | AACCTCTTCCTGTGAGTCAATTAGAG |
| S-AP1 WT biotin5 | CTCTAATTGACTCACAGGAAGAGGTT |
| AS-AP1 WT biotin5 | AACCTCTTCCTGTGAGTCAATTAGAG |
| S-Ap1 MUT | CTCTAATTCTCTCACAGGAAGAGGTT |
| AS-Ap1 MUT | AACCTCTTCCTGTGAGAGAATTAGAG |
| S-Ets MUT | CTCTAATTGACTCACAGTCAGAGGTT |
| AS-Ets MUT | AACCTCTGACTGTGAGTCAATTAGAG |
PKC inhibitors
NIH-3T3 and COS-7 cells were preincubated with the PKC-specific inhibitors bisindolylmaleimide, or RO 32-0432 (Calbiochem, Gibbstown, NJ) for 30 min prior to PMA treatment (50 nM). Twenty-four hours later, promoter activity was measured using the dual luciferase assay as described above. Data were normalized to activity in the untreated control. MA-10 cells were treated with RO 32-0432, PKCε-specific translocation inhibitor peptide (EAVSLKPT) (Calbiochem), or scrambled peptide (LSETKPAV) (Calbiochem) for 24 h before measuring luciferase activity.
PKCε siRNA
MA-10 cells were seeded at a density of 4×10⁴/well in 24-well plates. Cells were transfected 24 h later with 0.2, 0.5 or 2 μg of PKCε siRNA pool of 4 oligonucleotides (Dharmacon, Lafayette, CO) using X-treme GENE siRNA Transfection Reagent (Roche) using conditions recommended by the manufacturer. Cells were maintained for 48 h before being harvested for immunoblot analysis performed as described above.
PKCε overexpression
The pCMV6-XL4 expression plasmid containing Homo sapiens protein kinase C, epsilon (PRKCE) was obtained from Origene (Rockville, MD). The plasmid was amplified and purified, and the PKCε insert was sequenced. The plasmid or empty vector as a control were then transfected into NIH-3T3 cells as described above. Twenty-four hours later, the cells were lysed for mRNA or protein studies. Immunofluorescence using anti-PKCε antibodies indicated that PKCε transfection efficiency was approximately 30% (data not shown).
Sequence and Statistical Analysis
Sequence analysis was performed using a Vector NTI software (Informax, Invitrogen). Statistical analysis was performed using Prism version 4.0 (GraphPad Software, San Diego, CA). Group means were compared using student's t test or two-way ANOVA test followed by a Bonferroni column test. Data are presented as mean ± SEM. p < 0.05 was considered significant.
Results
TSPO levels are higher in steroidogenic than non-steroidogenic cells
TSPO binds both the drug ligand, PK 11195, and cholesterol with nanomolar affinities (27). PK 11195 is the most common diagnostic probe for assessing TSPO levels in cellular systems. PK 11195 radioligand binding assays revealed that there were no significant changes in the Kd, ranging from 1-2.5 nM. However, TSPO levels (Bmax) were approximately 10- and 40-fold greater in steroidogenic MA-10 cells than in non-steroidogenic NIH-3T3 and COS-7 cells, respectively (Figure 1A). Immunoblot analysis confirmed these radioligand binding assay results (Figure 1B). The 18-kDa TSPO protein as well as various putative TSPO homopolymers were detected by immunoblotting as previously reported (27).
Figure 1.
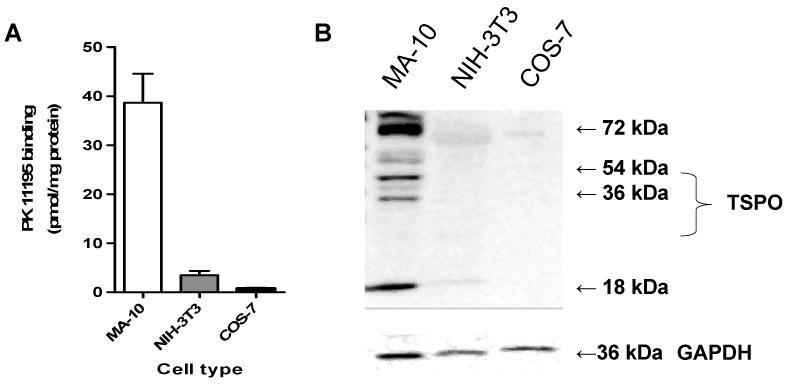
TSPO levels in MA-10, NIH-3T3, and COS-7 cells. (A) TSPO levels, as determined by [3H]PK11195 binding (Bmax). Values are derived from three independent experiments (n = 9). (B) Immunoblot analysis of TSPO. GAPDH served as a loading control. The gel is representative of three independent experiments.
PMA differentially regulates Tspo gene promoter activity in TSPO-rich and -poor cells
To explore the regulatory mechanisms underlying differential TSPO expression in various cell models, we tested the effect of PMA on Tspo promoter activity in TSPO-rich MA-10, and TSPO-poor NIH-3T3 and COS-7 cells. In COS-7 cells transfected with a luciferase reporter containing 805 bp of the mouse Tspo promoter (pGL3-805), exposure to 50 nM PMA resulted in a progressive increase in luciferase activity (Figure 2A). Maximal Tspo promoter activity occurred 24 h after PMA exposure and was at least 2.5-fold greater than activity in the untreated DMSO control. No additional increases in Tspo promoter activity were observed beyond 24 h (data not shown). Next, we determined the concentration of PMA needed to induce maximal pGL3-805 activity at 24 h in MA-10, NIH-3T3, and COS-7 cells. PMA elicited maximal activity in NIH-3T3 cells (3.5-fold) and COS-7 cells (2.5-fold) when used at a concentration of 50 nM (Figure 2B). In contrast, none of the PMA concentrations tested increased Tspo promoter activity in MA-10 cells, which expressed the highest levels of TSPO (Figure 2B). Promoter activity remained unresponsive to PMA after extending the incubation time to 48 h (data not shown). Based on the results from these initial two experiments, cells were treated with 50 nM PMA for 24 h in all subsequent studies.
Figure 2.

Time-dependent induction of Tspo promoter activity by PMA. (A) Effect of PMA (50 nM) or DMSO (control) on pGL3-805 luciferase activity in COS-7 cells. (B) Dose-dependent effect of PMA on pGL3-805 luciferase activity in MA-10, NIH-3T3, and COS-7 cells. (C) Effect of PMA (50 nM) on pGL3-2700 luciferase activity in MA-10, NIH-3T3, and COS-7 cells. In B. and C., cells were treated with PMA for 24 h. Values are derived from three independent experiments (n = 9). **p < 0.01 and ***p < 0.001 vs. control; ns, non significant.
To investigate whether PMA differentially regulates the full-length mouse Tspo promoter (2700 bp) as it does the 805-bp mouse Tspo promoter fragment, we tested the effect of PMA on pGL3-2700 reporter activity in MA-10, NIH-3T3 and COS-7 cells. In MA-10 cells, promoter activity remained unresponsive to PMA, compare Figure 2 panels B and C. On the other hand the induction of Tspo promoter activity by PMA was less pronounced in NIH-3T3, but not in COS-7, cells (Figure 2C). The latter result suggests that an inhibitory element(s) exists in the region between 2700 and 805 bp. Because differences in the maximal activity of the 2700-bp and 805-bp promoter in COS-7 and NIH-3T3 cells were minor and because the 805-bp promoter drives Tspo expression in a manner similar to that seen in vivo (14), the 805-bp promoter was used in all subsequent studies.
PMA differentially regulates Tspo mRNA and protein levels in TSPO-rich and -poor cells
PMA did not alter Tspo mRNA levels in MA-10 cells either at 24 h (Figure 3A) or 48 h (data not shown). In contrast, a 24 h treatment with PMA increased Tspo mRNA levels by approximately 1.25-fold in NIH-3T3 cells and 1.5-fold in COS-7 cells (Figure 3A). In both NIH-3T3 and COS-7 cells, this induction of Tspo mRNA levels was accompanied by increases in TSPO protein levels (Figure 3B) and Brdu incorporation (Figure 3C). Densitometric analysis of the gels compared to control GAPDH indicated that the increase in the 18-kDa TSPO and the 36- and 54-kDa polymers was 1.5-fold in COS-7 cells and over 2-fold in 3T3 cells. In MA-10 cells, PMA did not affect TSPO levels (data not shown) and BrdU incorporation.
Figure 3.
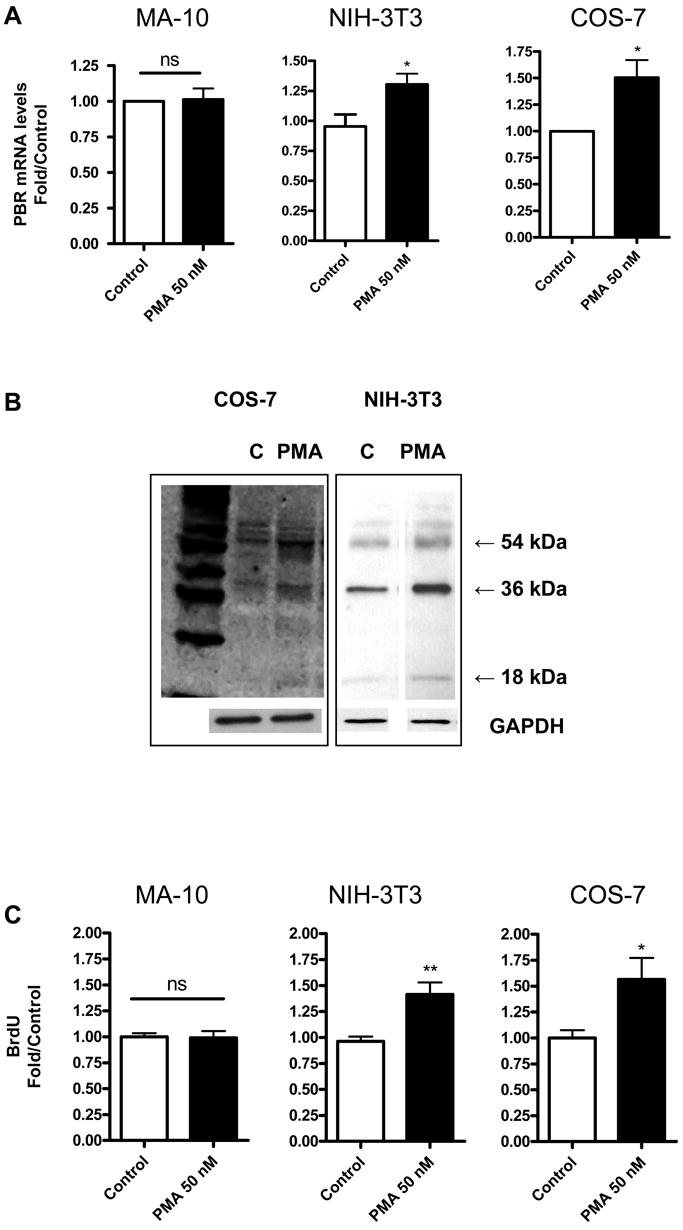
PMA induces TSPO mRNA levels, protein levels and proliferation in NIH-3T3 and COS-7 cells. (A) QRT-PCR analysis of TSPO mRNA levels 24 h after PMA treatment. (B) Immunoblot analysis of NIH-3T3 and COS-7 cells treated with and without PMA (50 nM) for 24 h. (C) Cellular Brdu incorporation 24 h after PMA treatment. Results are derived from three independent experiments (n = 9). *p < 0.05 and **p < 0.01 vs. control; ns, non significant. Immunoblots (B) are representative of three independent experiments.
Putative Ap1 and Ets binding sites in the proximal promoter are strong positive elements regulating Tspo expression
To measure the activity of cis-acting elements and to localize the effect of PMA on the mouse promoter, we transiently transfected MA-10, NIH-3T3, and COS-7 cells with reporter constructs containing sequential unidirectional deletions in the 2700-bp mouse Tspo promoter (5). In NIH-3T3 cells, the 805-bp fragment was necessary to support full basal activity (Figure 4A). PMA treatment increased activity of the 805 bp-promoter by 3-fold in these cells (Figure 4A). In MA-10 cells (Figure 4B), the 585-bp fragment was the smallest fragment able to support full basal promoter activity. In these cells, all lengths of the Tspo promoter were unresponsive to PMA treatment (Figure 4B). Nevertheless, the basal activity of the full-length promoter in MA-10 cells was double that in NIH-3T3 cells. In NIH-3T3 cells, the 805-bp promoter had a 2-fold greater activity than the 2700-bp promoter, suggesting that putative inhibitory elements in the 2700 – 805 bp promoter region are engaged in NIH-3T3 cells (Figure 4A). Importantly, the effect of PMA was significantly reduced when the 585 – 515-bp promoter areas were deleted in NIH-3T3 cells. Results obtained using COS-7 cells in general parallel those seen with NIH 3T3 cells (data not shown). However, because the monkey Tspo promoter has not yet been isolated and characterized detailed studies on the regulation of the mouse Tspo promoter in monkey kidney COS-7 cells cannot be interpreted correctly and thus not presented herein.
Figure 4.
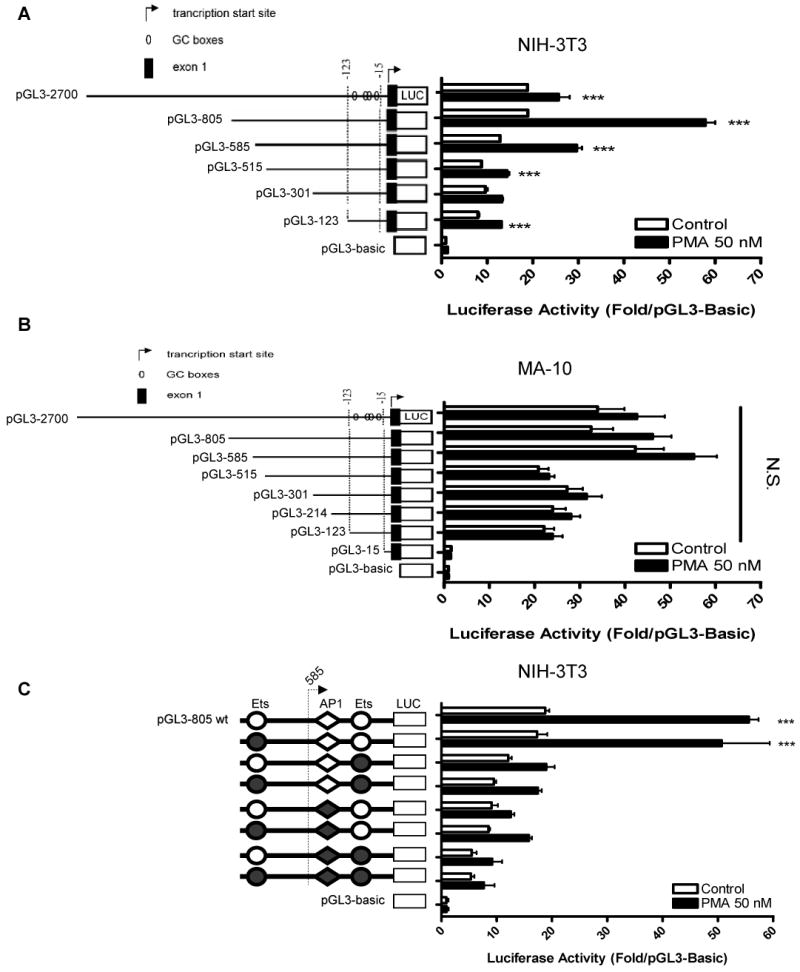
Effect of PMA and contribution of Ets and AP1 sites on PMA-inducible Tspo transcription. Deletion analysis of luciferase reporter constructs in (A) NIH-3T3, and (B) MA-10 cells treated with DMSO (control) or PMA for 24 h. Luciferase activity of pGL3-805 with intact (empty) or mutated (filled) Ets or AP1 sites (C) in NIH-3T3 cells. NIH-3T3 cells treated with DMSO (control) or PMA for 24 h. All data are normalized to activity of pGL3-Basic and are derived from three independent experiments (n = 9). In A and B, PMA induced a significant increase in luciferase activity (p < 0.001, ANOVA).
These results imply that the promoter region spanning from 805 to 515 bp contains cis-acting regulatory elements that drive Tspo expression in response to PMA. Analysis of the 805 – 515 bp region for putative transcription binding sites revealed the presence of two putative Ets binding sites and one AP1 putative binding site. To determine if these sites may regulate Tspo expression, we constructed luciferase reporter constructs containing point mutations in these promoter sites. In NIH-3T3 cells, mutation of the 1st Ets site did not appreciably affect promoter activation by PMA (Figure 4C). Mutation of the 2nd Ets site or the AP1 site reduced PMA-induced promoter activity.
PMA induces binding of c-fos, c-jun, and GABP-α to Tspo promoter sequences
EMSA was performed to investigate the effect of PMA on protein interactions at the AP1 and Ets sites suspected to mediate the PMA effect on Tspo promoter regulation (Figure 4C). It is of importance to mention that the AP1 and Ets sites are separated by 3 bp only leading to identical wild-type and labeled probes, referred to as the AP1 oligonucleotide. Incubation of NIH-3T3 nuclear extracts with labeled AP1 oligonucleotide (Table I) generated two specific complexes (Figure 5A and B, lane 2 for both, arrows 1& 2). The specificity of these interactions was confirmed by the addition of 200-fold excess of unlabeled AP1 oligonucleotide, which competed the formation of the complexes (Figure 5A and B, lane 3) or unrelated oligonucleotide (Epstein-Barr virus nuclear antigen recognition site, lane 5). The addition of a 200-fold excess of unlabeled oligonucleotide carrying a mutation on the putative AP1 site decreased the formation of both DNA-protein complexes (Figure 5A, lane 4). On the other hand, a mutated Ets binding sequence (Figure 5B, lane 4) successfully competed for nuclear proteins in both complexes. The Ets mutated site was more effective than the AP1 mutated site in decreasing the formation of these complexes. PMA treatment resulted in an increase of complexes 1, 2 and the induction of complex “a” (Figure 5A and B, compare lanes 6 and 2).
Figure 5.
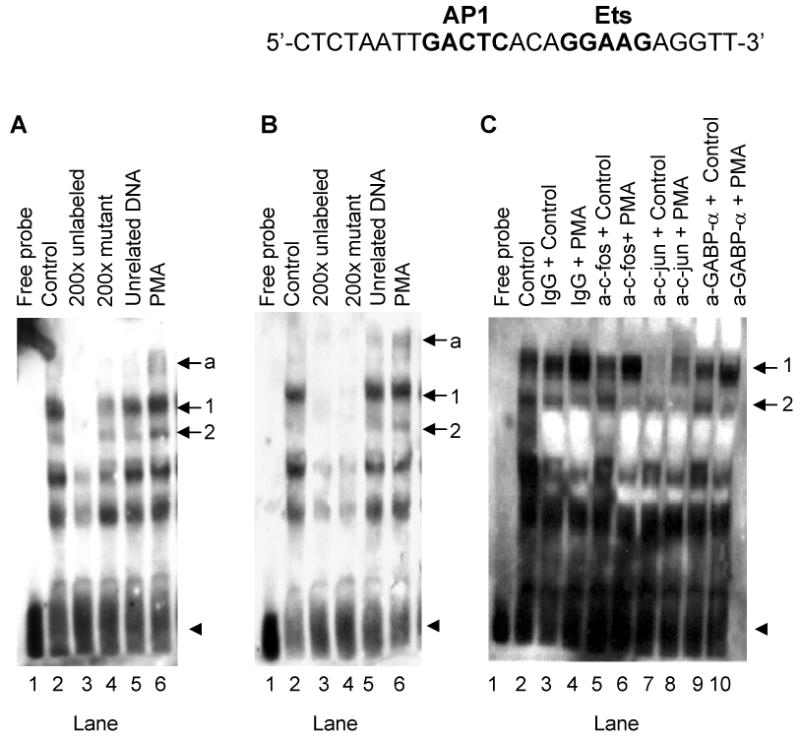
PMA induces c-fos, c-jun and GABP-α binding to their putative binding sites on the Tspo promoter. (A and B) EMSA of biotinylated AP1 oligonucleotide incubated without (A and B, lane 1) or with NIH-3T3 nuclear extract (A and B, lane 2). Competition experiments were performed using unlabeled AP1 oligonucleotide (A, lane 3), Ets oligonucleotide (B, lane 3), AP1 mutant oligonucleotide (A, lane 4), Ets mutant oligonucleotide (B, lane 4), or unrelated oligonucleotide (A and B, lane 5). The effect of PMA on the formation of DNA-protein complexes is shown in lane 6 (A and B). Arrows 1 and 2 indicate specific complexes, and the arrow labeled ‘a’ indicates a PMA-induced DNA-protein complex. The free probe is indicated with an arrowhead. (C) Supershift/immunodepletion analysis. EMSAs were performed on nuclear extracts from NIH-3T3 cells treated without (lanes 3, 5, 7, 9) and with PMA (lanes 4, 6, 8, 10). Binding reactions were performed in the presence of IgG (lanes 3 and 4), c-fos antibody (lanes 5 and 6), c-jun antibody (lanes 7 and 8), or GABP-α antibody (lanes 9 and 10). DNA-protein binding was optimized by including 10 μg BSA and 4 mM DTT in the binding reactions. Results shown are representative of three independent experiments.
To obtain the best conditions for binding of the transcription factors to the DNA the experimental conditions were modified (data not shown). Addition of 10 μg BSA and 4 mM DTT in the incubation buffer improved the DNA-protein binding (Figure 5C). Under these conditions, the same two DNA-protein complexes were observed (Figure 5C, lane 2). To identity the proteins bound to the sequence, we performed supershift/immunodepletion analysis. Addition of c-fos antibody (Figure 5C, lane 5), c-jun antibody (lane 7), or GABP-α antibody (lane 9), but not non-specific IgG (lane 3), reduced basal nuclear protein binding to DNA in complex 1. In agreement with data shown in Figure 5A and B, PMA treatment induced the formation of complex 1 (Figure 5C, lane 4). This increase was also reduced in presence of c-fos antibody (lane 6), GABP-α antibody (lane 10), or c-jun antibody (lane 8). In the later case complexes 1& 2 almost completely disappeared (Figure 5C, lane 8). Complex 2 was reduced in presence of c-fos antibody (lane 6) and GABP-α antibody (lane 10).
PMA induction of Tspo promoter activity is PKC-dependent
Since PMA is a PKC activator, we investigated whether PKC mediates induction of the Tspo promoter by PMA. To do this, we measured Tspo promoter activity in the presence of 4α-PMA, an inactive structural analog of PMA. PMA induced a dose-dependent induction of Tspo promoter activity in NIH-3T3 cells; 50nM PMA elicited a maximal (3-fold) effect (Figure 6A). Under the same conditions, 4α-PM failed to affect promoter activity, even when used at a 10-times greater concentration (Figure 6A). Similar results were obtained using COS-7 cells (Figure 6B). To confirm this finding, we tested the effect of PKC-specific inhibitors (i.e., bisindolylmaleimide and RO 32-0432) on PMA induction of Tspo promoter activity in NIH-3T3 and COS-7 cells. Both inhibitors reduced or abolished the effect of PMA in both NIH-3T3 and COS-7 cells (Figure 6C, D).
Figure 6.

PMA induction of the Tspo promoter is PKC-dependent. (A,B) Luciferase activity of pGL3-805 in NIH-3T3 (A) and COS-7 (B) cells treated with DMSO (control-white bars), PMA (black bars), or 4α-PMA (grey bars) for 24 h. (C,D) Effect of PKC-specific inhibitors on PMA-inducible pGL3-805 activity in NIH-3T3 (C) and COS-7 (D) cells. In A-D, data were normalized to control activity and are derived from three independent experiments (n = 9). ***p < 0.001 vs. control.
TSPO-rich MA-10 cells express high levels of PKCε
A dose-response study of the effect of RO 32-0432 on PMA-induced Tspo promoter activity in NIH-3T3 cells revealed that this compound was able to inhibit in a dose-dependent manner the PMA effect (Figure 7A). RO 32-0432 exhibits selectivity in its inhibition of PKCα (IC50 = 9 nM), PKCβI (IC50 = 28 nM), and PKCε (IC50 = 180 nM) (28). In the dose-response study, only the highest concentrations of RO 32-0432 were able to abolish the effect of PMA, suggesting that PKCε mediates the effects of PMA. Immunoblot analysis of PKC isoforms in MA-10, NIH-3T3, and COS-7 cells revealed that each cell line differentially expressed the PKCα, PKCβII, and PKCε isoforms. PKCα was highly expressed in NIH-3T3 cells compared to MA-10 cells (Figure 7B). On the other hand PKCβII and PKCε were highly expressed in MA-10 cells than in NIH-3T3 and COS-7 cells.
Figure 7.
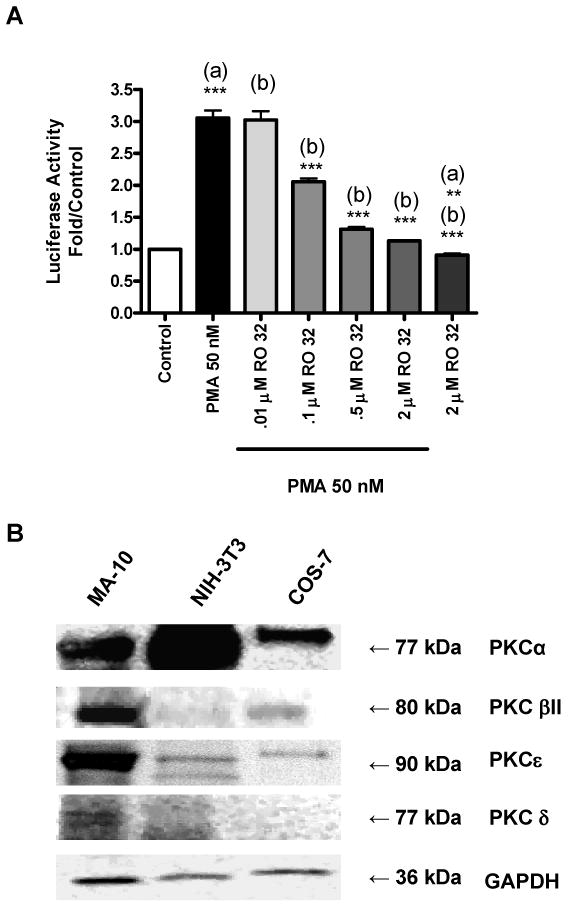
Tspo promoter sensitivity to RO 32-0432 and PKC isoform expression. (A) Dose-dependent effect of RO 32-0432 on pGL3-805 activity in NIH-3T3 cells. Results are derived from three independent experiments (n = 9). **p < 0.01, and ***p < 0.001 vs. (a) control, (b) PMA. (B) Immunoblot analysis of PKC isoforms in MA-10, NIH-3T3, and COS-7 cells. The blots shown are representative of two independent experiments.
Inhibition of PKCε reduces basal Tspo promoter activity in TSPO-rich MA-10 cells and PKCε siRNA lowers PKCε and TSPO protein levels
As noted earlier, PMA does not affect Tspo expression in MA-10 cells and basal Tspo promoter activity in these cells is 2-fold higher than in NIH-3T3 and COS-7 cells. To determine if PKC regulates Tspo promoter activity in MA-10 cells, we measured promoter activity in the presence of calphostin, RO 32-0432, or G06976. Calphostin inhibits PKCα, PKCβ, and with variable efficacy, PKCε. On the other hand, G06976 inhibits PKCα and PKCβ, but does not affect PKCε, even at micromolar concentrations while as mentioned above RO 32-0432 exhibits selectivity in its inhibition of the conventional subtypes PKCα, PKCβ and the unconventional subtype PKCε (28-29). Neither calphostin nor G06976 inhibited Tspo promoter activity, whereas RO 32-0432 (2 μM) reduced basal promoter activity by 40% (Figure 8A). In accord with this finding, a PKCε-specific translocation inhibitor peptide inhibited basal Tspo promoter activity by 50% (Figure 8B). This effect was absent in cells treated with scrambled peptide. The RO 32-0432-induced reduction in basal promoter activity was accompanied by a decrease in BrdU incorporation (Figure 8C). Importantly, concentrations of RO 32-0432 expected to inhibit PKCε activity, abolished BrdU incorporation.
Figure 8.
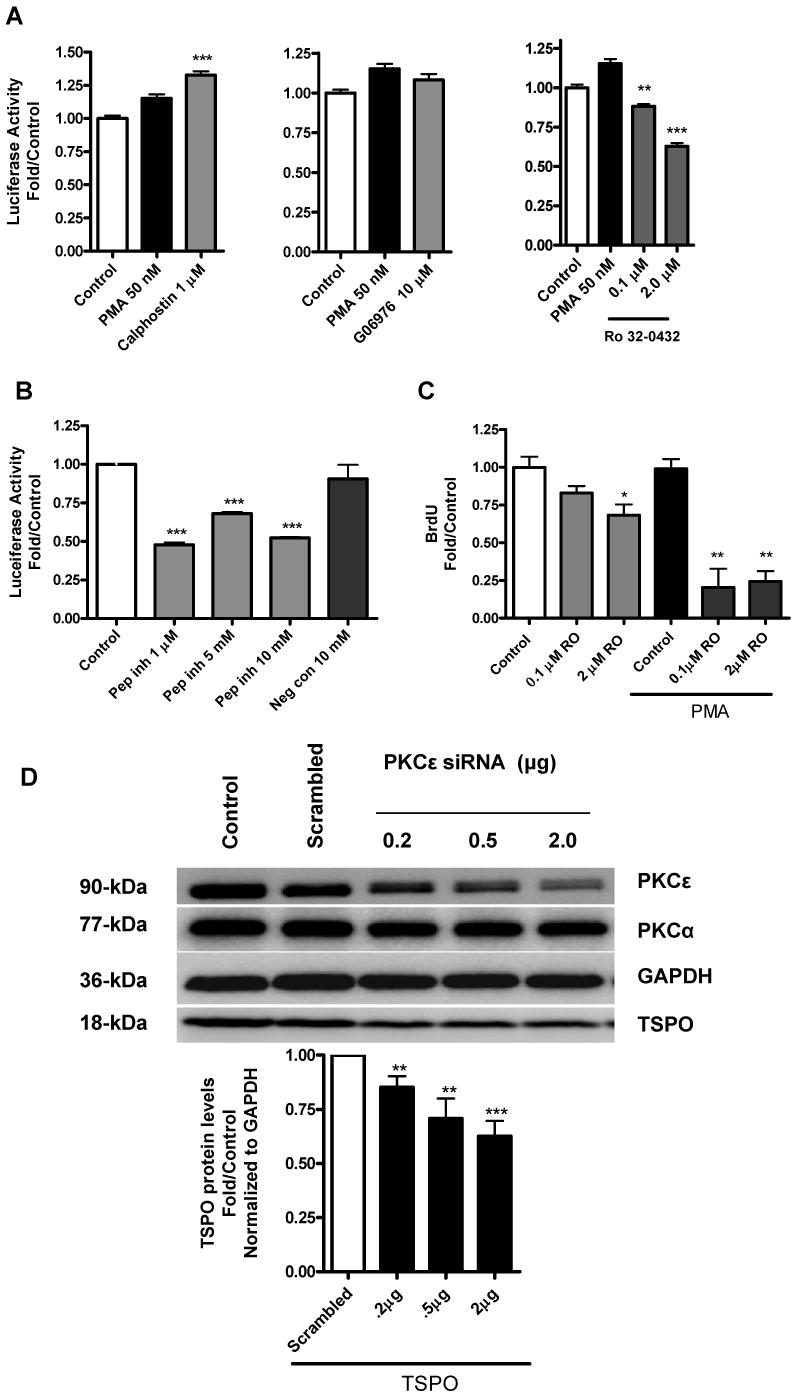
PKCε mediates PMA-induced Tspo promoter activity and TSPO protein levels. (A) Effect of calphostin, G06976, or RO 32-0432 on PMA-inducible pGL3-805 activity in MA-10 cells. (B) Effect of a PKCε-specific translocation inhibitor peptide (Pep Inh) or scrambled peptide (Neg Con) on PMA-inducible pGL3-805 activity. (C) Effect of RO 32-0432 on PMA-induced MA-10 proliferation. (D) Effect of down regulation of PKCε on TSPO protein levels. Cells were treated with the siRNA pool specific for PKCε or scrambled oligonucletides as described under materials and methods. At the end of the experiment cells were analyzed for PKCε, PKCα, TSPO and GAPDH expression by immunoblot analysis. Results for A-C are derived from three independent experiments (n = 9). *p < 0.05, **p < 0.01, and ***p < 0.001 vs. control. Immunoblots (D) are representative of two independent experiments.
To confirm these findings on the putative role of PKCε in the regulation of Tspo gene expression, PKCε siRNA was used to lower PKCε protein levels in TSPO-rich MA-10 cells. Figure 8D shows that the PKCε siRNA pool used inhibited in a dose-dependent PKCε protein expression reaching a 70% inhibition in the presence of 2 μg of siRNA. Under the same conditions, the siRNA used also induced a dose-dependent reduction in TSPO protein levels (Figure 8D). GAPDH and PKCα levels remained unchanged.
PKCε overexpression in NIH-3T3 cells up regulates Tspo promoter activity, mRNA and protein levels and potentiates the effect of PMA
In an effort to further evaluate the role of PKCε in the regulation of Tspo expression, we tested the impact of PKCε overexpression on TSPO levels in the TSPO-poor NIH-3T3 cells. Expression of exogenous PKCε was confirmed by immunoblot analysis (Figure 9A). These data also show that PKCε was not degraded in response to the PMA treatment. A time course treatment of NIH-3T3 and COS-7 cells with PMA indicated that PKCε levels were the same in control and treated cells for times as long as 10 hrs, suggesting that this enzyme is resistant to degradation (data not shown). Transfecting NIH-3T3 cells with the wild-type PKCε significantly induced the pGL3-805 Tspo promoter activity and treatment with PMA further induced the effect (Figure 9B). Under the same conditions, there was no induction in Tspo promoter activity using a promoter where AP1 was mutated, suggesting that the effect seen is likely mediated through this AP1 site. No significant difference was observed in the pGL3-Basic in response to PKCε overexpression. PMA induced both Tspo mRNA and protein levels to a greater degree in PKCε-overexpressing cells than in control cells (Figure 9C-E).
Figure 9.
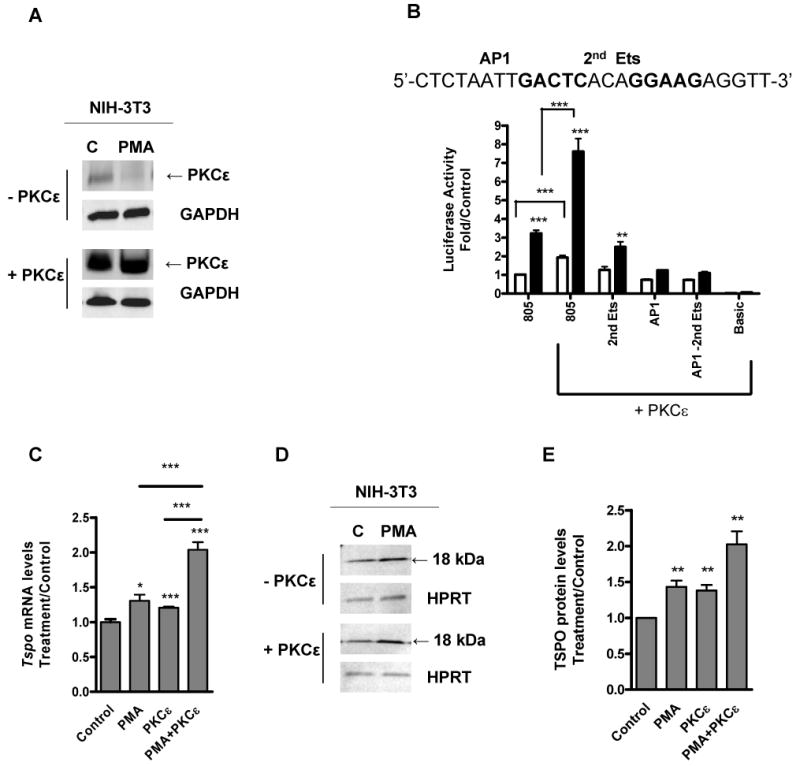
PKCε overexpression induces Tspo promoter mRNA and protein levels. NIH-3T3 cells were transfected with PKCε expression vector or vector only, then treated with (white bars) or without PMA (black bars) for 24 h. (A) Immunoblot analysis of cell extracts. (B) Effect of PKCε overexpression on Tspo promoter activity. (C) QRT-PCR analysis of Tspo mRNA levels in response to PKCε overexpression. Results are derived from three independent experiments (n = 9). *p < 0.05, **p < 0.01, ***p < 0.001 vs. control. (D) Immunoblot analysis of TSPO and (E) densitometry of TSPO bands. Immunoreactive bands were normalized to HPRT, and these values were expressed as an increase relative to control. Immunoblots are representative of three independent experiments.
PKCε overexpression in NIH-3T3 cells induces c-jun protein transcription and phosphorylation
Because PMA induced binding of c-jun to a Tspo promoter sequence (Fig. 5C), we also examined the effect of PKCε overexpression on c-jun protein levels and phosphorylation (Ser73). PMA induced c-jun levels by 2-fold in control cells and over 6-fold in PKCε-overexpressing cells (Figure 10A,B). Normalizing the levels of phosphorylated c-jun to GAPDH and dividing them by the c-jun levels indicates that a large portion of PMA inducible c-jun underwent phosphorylation in the PKCε-overexpressing cells (Figure 10C,D).
Figure 10.
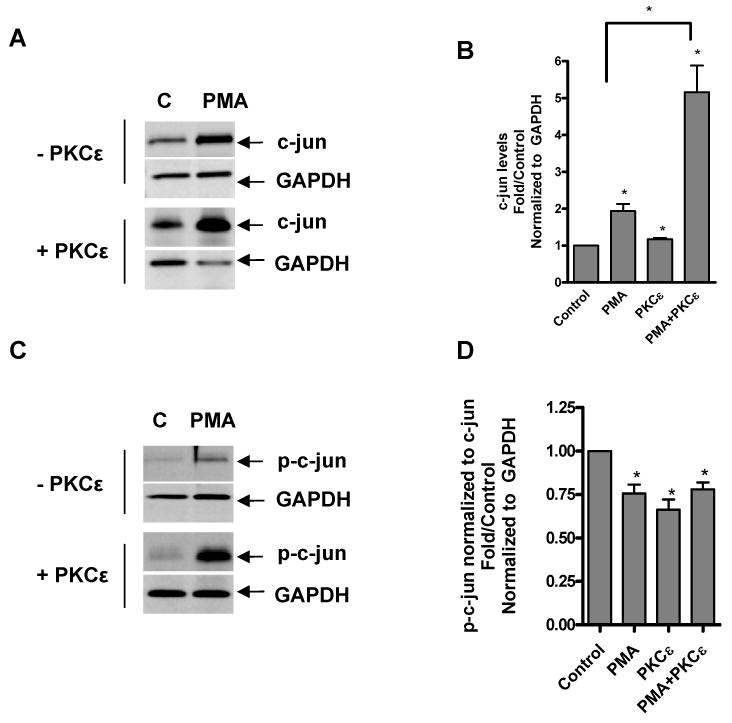
PKCε overexpression induces c-jun protein levels and phosphorylation. NIH-3T3 cells were transfected with PKCε expression vector or vector only, then treated with or without PMA for 24 h and examined for c-jun levels by immunoblotting (A) followed by densitometric (B) analysis of the blots. Immunoreactive bands were normalized to GAPDH and these values were expressed as an increase relative to control. Immunoblot (C) and densitometric (D) analysis of phosphorylated c-jun (Ser73). p-c-jun levels were normalized to GAPDH levels (data not shown), then normalized to c-jun levels to investigate phosphorylation of newly synthesized protein. Immunoblots are representative of two independent experiments.
Discussion
Here, we provide evidence that Tspo promoter activity and expression are regulated by a PKCε-dependent signaling pathway in steroidogenic and non-steroidogenic cells. This is the first report clearly linking induction of Tspo expression to a signal transduction pathway. In this study, we investigated the molecular mechanisms governing Tspo regulation by exploring Tspo transcriptional responses to a tumor-promoting agent in the three cell lines with varying TSPO levels. Our data clearly showed that only non-steroidogenic cells expressing low levels of TSPO (i.e., NIH-3T3 and COS-7 cells) responded to PMA, as seen by an increase in Tspo promoter activity, Tspo mRNA and protein levels, and cellular proliferation. MA-10 cells are rapidly dividing, aggressive tumor cells, so further induction of proliferation with PMA may not be possible. The finding that basal Tspo activity was significantly higher in MA-10 cells than in NIH-3T3 or COS-7 cells suggests that an endogenous factor linked to the steroidogenic phenotype of the MA-10 cells drives the constitutive Tspo expression in these cells.
Sequence analysis of the Tspo promoter region crucial for Tspo induction in PMA-treated NIH-3T3 cells revealed the presence of two Ets sites and one AP1 site. Members of both AP1 and Ets transcription factor families are known to bind to the Tspo promoter (5,14). These transcription factors can regulate transcription either alone, in cooperation with each other, or in cooperation with different transcription factors or co-factors. Deletion analysis revealed that only the second Ets site and its adjacent AP1 site contributed to promoter induction by PMA in NIH-3T3 cells. An additive effect was not observed upon mutation of both sites, suggesting that one of the two sites is used at a time. This idea is consistent with the close proximity of the Ets and AP1 sites (separated by 3 bp), which would make simultaneous occupancy of the same site difficult due to allosteric hindrance. In TSPO-rich MA-10 cells, mutation of the AP1 site or either of the two Ets sites did not restore the ability of the Tspo gene promoter to respond to PMA (data not shown), suggesting that additional increases in the basal promoter activity of these cells is not possible.
EMSA of NIH-3T3 extracts revealed that c-jun and c-fos (of the AP1 family) as well as GABP-α (of the Ets family) bound to the AP1 site of the Tspo promoter in a PMA-inducible manner. In these studies we observed that a mutation of the Ets site was more successful at competing off specific complexes 1 & 2 (Figure 5B, lane 4). It is possible that some AP1 factors maybe bound to the AP1 site thus preventing the probe from accessing the DNA. Mutating the AP1 site prevented this binding and thus the complexes formed were not competed. This is supported by the fact that c-jun almost completely disrupted the probe binding (Figure 5C, lanes 7 & 8). These findings suggest that PMA induces either synthesis of these transcription factors or their binding to DNA through the activation of a signal transduction pathway, such as the PKC pathway. In TSPO-rich cells, such as MA-10 cells, PKC might maintain constitutive Tspo promoter activity by modulating the phosphorylation state and activity of transcription factors, such as AP1 family members, or other regulatory proteins (30). In TSPO-poor cells, PMA induces c-jun, c-fos, and GABP-α transcription and DNA binding, acting probably via PKC. The interaction of these transcription factors with the Tspo promoter was recently confirmed by chromatin immunoprecipitation assays (14).
In recent years, PKC has been linked to multiple diseases, steroidogenesis and cancers (31-33). PKC mediates the tumor-promoting effects of PMA, although PMA is also known to have PKC-independent effects (34). The ability of PKC-specific inhibitors to abrogate PMA-induced promoter activity, taken with the inability of 4α-PMA to induce promoter activity, suggests that PMA acts through PKC to induce Tspo transcription. Different PKC isoforms may regulate Tspo transcription in COS-7 and NIH-3T3 cells, since these cells had different inhibition profiles. Alternatively, conventional and non-conventional PKC isoforms may cooperatively regulate transcription in these cells. The finding that bisindolylmaleimide and RO 32-0432 inhibited the inducible effect of PMA in NIH-3T3 cells is consistent with a role for PKCε in PMA-activated Tspo transcription. The ability of RO 32-0432 to abolish PMA-induced promoter activity only at concentrations found to inhibit PKCε also supports this idea.
Our findings pointed to a role for PKCε not only in inducing Tspo expression in NIH-3T3 and COS-7 cells, but also in basal Tspo expression in MA-10 cells. Of the three cell lines examined, MA-10 cells had the highest expression of PKCε. In addition, basal constitutive Tspo promoter activity in MA-10 cells was decreased, not by calphostin or G06976, but by a high enough dose of RO 32-0432 to affect PKCε. Similar inhibition was observed in the presence of a specific PKCε translocation inhibitor peptide, which prevents the translocation of PKCε to its anchoring protein (19). Moreover, lowering PKCε protein levels following siRNA treatment of MA-10 cells was accompanied by a reduction in TSPO protein levels. The finding that under the conditions used 70% reduction in PKCε protein levels led to 40% reduction in TSPO suggest that either longer periods of incubation time with the siRNA used are needed to deplete the endogenous TSPO or that other mechanisms account for the control of the remaining TSPO expression. Taken together these data indicate that PKCε is an important component of the basal transcription of Tspo in TSPO-rich steroidogenic MA-10 cells.
PKCε is a crucial player in diabetes (35) and Alzheimer's disease (36). It is also involved in carcinogenesis (23,37-39) and participates in tumor development, metastasis, and invasion in many tissues. Overexpression of PKCε confers oncogenic potential to fibroblasts, colonic, and prostatic epithelial cells (40,41). In addition, high-grade tumors frequently have high levels of PKCε (23,31,42). Diminishing high levels or activity of PKCε may suppress tumor promotion, growth, invasiveness, and metastasis (39). For example, PKCε inhibition reduces tumor growth and metastasis of MDA-MB-231 breast cancer cells (42) and sensitizes breast cancer cells to tumor necrosis factor-induced death (43). Interestingly, the profile of TSPO expression in Alzheimer's disease (4) and various cancers (1,6-10) as well as the role of TSPO in cell proliferation, tumor invasion, and tumor metastasis (1,6,11,44) parallels that of PKCε. Considering that TSPO controls the rate of adrenal cortical steroid formation (45) and this shared profile between PKCε and TSPO, it is not surprising that PKCε null mice have dramatically reduced circulating corticosterone levels (46). Indeed, this phenotype may be attributable to reduced adrenal cortical levels of TSPO.
The importance of PKCε on Tspo promoter activity was confirmed through overexpression of PKCε in NIH-3T3 cells, which expressed low levels of this PKC isoform as well as of TSPO. Although prolonged exposure to PMA has been reported to degrade PKC (47), we found that in these cells PKCε was resistant to PMA degradation, in agreement with previous reports on this isoform (48), thus ruling out the possibility that the PMA effect might be due to PKCε degradation following prolonged exposure to PMA. Also in agreement with previous findings (49), PKCε overexpression increased NIH-3T3 proliferation (data not shown). Importantly, although PKCε overexpression increased Tspo mRNA and protein levels, PMA greatly enhanced this effect. Thus, PKCε is essential for Tspo gene expression, but must be activated to exert this effect.
The results presented here suggest that in TSPO-rich steroidogenic cells, constitutive expression of high levels of PKCε drives Tspo expression. In TSPO-poor non-steroidogenic cells, this pathway can be engaged by tumor-promoting agents, also resulting in increased proliferation. In the TSPO-poor NIH-3T3 cell line, PMA induced Tspo transcription primarily through the formation of c-jun DNA binding complexes and to a lesser extent, GABP-α complexes. The finding that PMA treatment of NIH-3T3 cells elicited a dramatic up regulation of c-jun in the presence of PKCε overexpression provides further support for the PKCε→c-jun→Tspo signaling axis (Figure 11). In PKCε-transfected NIH-3T3 cells, a large fraction of PMA-induced c-jun was phosphorylated. These data further indicate that PMA treatment induces both c-jun expression and activity, which drives Tspo expression.
Figure 11.

Proposed signaling pathway underlying PMA-induced activation of the Tspo promoter.
In summary, a PKCε-dependent signal transduction pathway drives Tspo transcription and expression through activation of AP1 and Ets transcription factors. This is the first clear evidence linking increased TSPO expression to a signal transduction pathway (PKCε). Additional studies will be necessary to unravel the exact mechanism by which PKCε regulates AP1 and Ets expression and/or activity.
Abbreviations
- AP1
activator protein 1
- EMSA
electrophoretic mobility shift assay
- Ets
v-ets erythroblastosis virus E26 oncogene homolog
- GABP
GA binding protein transcription factor
- PKCε
protein kinase C epsilon
- PMA
phorbol-12-myristate 13-acetate
- Sp1
specificity protein 1/Sp1 transcription factor
- TSPO
translocator protein (18-kDa)
Footnotes
This work was supported by Grant R01 ES07747 from the National Institutes of Health (to V.P.). V.P. was also supported by a Canada Research Chair in Biochemical Pharmacology. The Research Institute of MUHC is supported in part by a Center grant from Le Fonds de la recherche en santé du Québec.
References
- 1.Papadopoulos V, Baraldi M, Guilarte TR, Knudsen TB, Lacapere JJ, Lindemann P, Norenberg MD, Nutt D, Weizman A, Zhang MR, Gavish M. Translocator protein (18kDa): new nomenclature for the peripheral-type benzodiazepine receptor based on its structure and molecular function. Trends Pharmacol Sci. 2006;27:402–409. doi: 10.1016/j.tips.2006.06.005. [DOI] [PubMed] [Google Scholar]
- 2.Braestrup C, Squires RF. Specific benzodiazepine receptors in rat brain characterized by high-affinity (3H)diazepam binding. Proc Natl Acad Sci U S A. 1977;74:3805–3809. doi: 10.1073/pnas.74.9.3805. [DOI] [PMC free article] [PubMed] [Google Scholar]
- 3.Casellas P, Galiegue S, Basile AS. Peripheral benzodiazepine receptors and mitochondrial function. Neurochem Int. 2002;40:475–486. doi: 10.1016/s0197-0186(01)00118-8. [DOI] [PubMed] [Google Scholar]
- 4.Gavish M, Bachman I, Shoukrun R, Katz Y, Veenman L, Weisinger G, Weizman A. Enigma of the peripheral benzodiazepine receptor. Pharmacol Rev. 1999;51:629–650. [PubMed] [Google Scholar]
- 5.Giatzakis C, Papadopoulos V. Differential utilization of the promoter of peripheral-type benzodiazepine receptor by steroidogenic versus nonsteroidogenic cell lines and the role of Sp1 and Sp3 in the regulation of basal activity. Endocrinology. 2004;145:1113–1123. doi: 10.1210/en.2003-1330. [DOI] [PubMed] [Google Scholar]
- 6.Hardwick M, Fertikh D, Culty M, Li H, Vidic B, Papadopoulos V. Peripheral-type benzodiazepine receptor (PBR) in human breast cancer: correlation of breast cancer cell aggressive phenotype with PBR expression, nuclear localization, and PBR-mediated cell proliferation and nuclear transport of cholesterol. Cancer Res. 1999;59:831–842. [PubMed] [Google Scholar]
- 7.Han Z, Slack RS, Li W, Papadopoulos V. Expression of peripheral benzodiazepine receptor (PBR) in human tumors: relationship to breast, colorectal, and prostate tumor progression. J Recept Signal Transduct Res. 2003;23:225–238. doi: 10.1081/rrs-120025210. [DOI] [PubMed] [Google Scholar]
- 8.Galiegue S, Casellas P, Kramar A, Tinel N, Simony-Lafontaine J. Immunohistochemical assessment of the peripheral benzodiazepine receptor in breast cancer and its relationship with survival. Clin Cancer Res. 2004;10:2058–2064. doi: 10.1158/1078-0432.ccr-03-0988. [DOI] [PubMed] [Google Scholar]
- 9.Maaser K, Grabowski P, Sutter AP, Hopfner M, Foss HD, Stein H, Berger G, Gavish M, Zeitz M, Scherubl H. Overexpression of the peripheral benzodiazepine receptor is a relevant prognostic factor in stage III colorectal cancer. Clin Cancer Res. 2002;8:3205–3209. [PubMed] [Google Scholar]
- 10.Katz Y, Ben-Baruch G, Kloog Y, Menczer J, Gavish M. Increased density of peripheral benzodiazepine-binding sites in ovarian carcinomas as compared with benign ovarian tumours and normal ovaries. Clin Sci (Lond) 1990;78:155–158. doi: 10.1042/cs0780155. [DOI] [PubMed] [Google Scholar]
- 11.Veenman L, Papadopoulos V, Gavish M. Channel-like functions of the 18-kDa translocator protein (TSPO): regulation of apoptosis and steroidogenesis as part of the host-defense response. Curr Pharm Des. 2007;13(23):2385–405. doi: 10.2174/138161207781368710. [DOI] [PubMed] [Google Scholar]
- 12.Gazouli M, Yao ZX, Boujrad N, Corton JC, Culty M, Papadopoulos V. Effect of peroxisome proliferators on Leydig cell peripheral-type benzodiazepine receptor gene expression, hormone-stimulated cholesterol transport, and steroidogenesis: role of the peroxisome proliferator-activator receptor alpha. Endocrinology. 2002;143:2571–2583. doi: 10.1210/endo.143.7.8895. [DOI] [PubMed] [Google Scholar]
- 13.Amri H, Drieu K, Papadopoulos V. Transcriptional suppression of the adrenal cortical peripheral-type benzodiazepine receptor gene and inhibition of steroid synthesis by ginkgolide B. Biochem Pharmacol. 2003;65:717–729. doi: 10.1016/s0006-2952(02)01603-9. [DOI] [PubMed] [Google Scholar]
- 14.Giatzakis C, Batarseh A, Dettin L, Papadopoulos V. The role of Ets transcription factors in the basal transcription of the translocator protein (18 kDa) Biochemistry. 2007;46:4763–4774. doi: 10.1021/bi062208o. [DOI] [PMC free article] [PubMed] [Google Scholar]
- 15.Furstenberger G, Berry DL, Sorg B, Marks F. Skin tumor promotion by phorbol esters is a two-stage process. Proc Natl Acad Sci U S A. 1981;78:7722–7726. doi: 10.1073/pnas.78.12.7722. [DOI] [PMC free article] [PubMed] [Google Scholar]
- 16.Saito N, Kikkawa U, Nishizuka Y. The family of protein kinase C and membrane lipid mediators. J Diabetes Complications. 2002;16:4–8. doi: 10.1016/s1056-8727(01)00200-8. [DOI] [PubMed] [Google Scholar]
- 17.Nishizuka Y. The molecular heterogeneity of protein kinase C and its implications for cellular regulation. Nature. 1988;334:661–665. doi: 10.1038/334661a0. [DOI] [PubMed] [Google Scholar]
- 18.Wetsel WC, Khan WA, Merchenthaler I, Rivera H, Halpern AE, Phung HM, Negro-Vilar A, Hannun YA. Tissue and cellular distribution of the extended family of protein kinase C isoenzymes. J Cell Biol. 1992;117:121–133. doi: 10.1083/jcb.117.1.121. [DOI] [PMC free article] [PubMed] [Google Scholar]
- 19.da Rocha AB, Mans DR, Regner A, Schwartsmann G. Targeting protein kinase C: new therapeutic opportunities against high-grade malignant gliomas? Oncologist. 2002;7:17–33. doi: 10.1634/theoncologist.7-1-17. [DOI] [PubMed] [Google Scholar]
- 20.Lopez-Ruiz MP, Choi MS, Rose MP, West AP, Cooke BA. Direct effect of arachidonic acid on protein kinase C and LH-stimulated steroidogenesis in rat Leydig cells; evidence for tonic inhibitory control of steroidogenesis by protein kinase C. Endocrinology. 1992;130(3):1122–30. doi: 10.1210/endo.130.3.1311229. [DOI] [PubMed] [Google Scholar]
- 21.Manna PR, Jo Y, Stocco DM. Regulation of Leydig cell steroidogenesis by extracellular signal-regulated kinase 1/2: role of protein kinase A and protein kinase C signaling. J Endocrinol. 2007;193(1):53–63. doi: 10.1677/JOE-06-0201. [DOI] [PubMed] [Google Scholar]
- 22.Jo Y, King SR, Khan SA, Stocco DM. Involvement of protein kinase C and cyclic adenosine 3′,5′-monophosphate-dependent kinase in steroidogenic acute regulatory protein expression and steroid biosynthesis in Leydig cells. Biol Reprod. 2005;73(2):244–55. doi: 10.1095/biolreprod.104.037721. [DOI] [PubMed] [Google Scholar]
- 23.Griner EM, Kazanietz MG. Protein kinase C and other diacylglycerol effectors in cancer. Nat Rev Cancer. 2007;7:281–294. doi: 10.1038/nrc2110. [DOI] [PubMed] [Google Scholar]
- 24.Ono Y, Fujii T, Ogita K, Kikkawa U, Igarashi K, Nishizuka Y. The structure, expression, and properties of additional members of the protein kinase C family. J Biol Chem. 1988;263:6927–6932. [PubMed] [Google Scholar]
- 25.Papadopoulos V, Amri H, Li H, Boujrad N, Vidic B, Garnier M. Targeted disruption of the peripheral-type benzodiazepine receptor gene inhibits steroidogenesis in the R2C Leydig tumor cell line. J Biol Chem. 1997;272:32129–32135. doi: 10.1074/jbc.272.51.32129. [DOI] [PubMed] [Google Scholar]
- 26.Li H, Yao Z, Degenhardt B, Teper G, Papadopoulos V. Cholesterol binding at the cholesterol recognition/ interaction amino acid consensus (CRAC) of the peripheral-type benzodiazepine receptor and inhibition of steroidogenesis by an HIV TAT-CRAC peptide. Proc Natl Acad Sci U S A. 2001;98:1267–1272. doi: 10.1073/pnas.031461598. [DOI] [PMC free article] [PubMed] [Google Scholar]
- 27.Delavoie F, Li H, Hardwick M, Robert JC, Giatzakis C, Peranzi G, Yao ZX, Maccario J, Lacapere JJ, Papadopoulos V. In vivo and in vitro peripheral-type benzodiazepine receptor polymerization: functional significance in drug ligand and cholesterol binding. Biochemistry. 2003;42:4506–4519. doi: 10.1021/bi0267487. [DOI] [PubMed] [Google Scholar]
- 28.Birchall AM, Bishop J, Bradshaw D, Cline A, Coffey J, Elliott LH, Gibson VM, Greenham A, Hallam TJ, Harris W. Ro 32-0432, a selective and orally active inhibitor of protein kinase C prevents T-cell activation. J Pharmacol Exp Ther. 1994;268:922–929. [PubMed] [Google Scholar]
- 29.Koyama N, Kashimata M, Sakashita H, Sakagami H, Gresik EW. EGF-stimulated signaling by means of PI3K, PLCgamma1, and PKC isozymes regulates branching morphogenesis of the fetal mouse submandibular gland. Dev Dyn. 2003;227:216–226. doi: 10.1002/dvdy.10309. [DOI] [PubMed] [Google Scholar]
- 30.Gadea A, Schinelli S, Gallo V. Endothelin-1 regulates astrocyte proliferation and reactive gliosis via a JNK/c-Jun signaling pathway. J Neurosci. 2008;28:2394–2408. doi: 10.1523/JNEUROSCI.5652-07.2008. [DOI] [PMC free article] [PubMed] [Google Scholar]
- 31.Fabbro D, Kung W, Roos W, Regazzi R, Eppenberger U. Epidermal growth factor binding and protein kinase C activities in human breast cancer cell lines: possible quantitative relationship. Cancer Res. 1986;46:2720–2725. [PubMed] [Google Scholar]
- 32.Platet N, Prevostel C, Derocq D, Joubert D, Rochefort H, Garcia M. Breast cancer cell invasiveness: correlation with protein kinase C activity and differential regulation by phorbol ester in estrogen receptor-positive and - negative cells. Int J Cancer. 1998;75:750–756. doi: 10.1002/(sici)1097-0215(19980302)75:5<750::aid-ijc14>3.0.co;2-a. [DOI] [PubMed] [Google Scholar]
- 33.Lahn M, Sundell K, Gleave M, Ladan F, Su C, Li S, Ma D, Paterson BM, Bumol TF. Protein kinase C-alpha in prostate cancer. BJU Int. 2004;93:1076–1081. doi: 10.1111/j.1464-410X.2003.04784.x. [DOI] [PubMed] [Google Scholar]
- 34.Nakamura J, Suda T, Ogawa Y, Takeo T, Suga S, Wakui M. Protein kinase C-dependent and -independent inhibition of Ca(2+) influx by phorbol ester in rat pancreatic beta-cells. Cell Signal. 2001;13:199–205. doi: 10.1016/s0898-6568(01)00136-x. [DOI] [PubMed] [Google Scholar]
- 35.Ikeda Y, Olsen GS, Ziv E, Hansen LL, Busch AK, Hansen BF, Shafrir E, Mosthaf-Seedorf L. Cellular mechanism of nutritionally induced insulin resistance in Psammomys obesus: overexpression of protein kinase Cepsilon in skeletal muscle precedes the onset of hyperinsulinemia and hyperglycemia. Diabetes. 2001;50:584–592. doi: 10.2337/diabetes.50.3.584. [DOI] [PubMed] [Google Scholar]
- 36.Kinouchi T, Sorimachi H, Maruyama K, Mizuno K, Ohno S, Ishiura S, Suzuki K. Conventional protein kinase C (PKC)-alpha and novel PKC epsilon, but not -delta, increase the secretion of an N-terminal fragment of Alzheimer's disease amyloid precursor protein from PKC cDNA transfected 3Y1 fibroblasts. FEBS Lett. 1995;364:203–206. doi: 10.1016/0014-5793(95)00392-m. [DOI] [PubMed] [Google Scholar]
- 37.Bae KM, Wang H, Jiang G, Chen MG, Lu L, Xiao L. Protein kinase C epsilon is overexpressed in primary human non-small cell lung cancers and functionally required for proliferation of non-small cell lung cancer cells in a p21/Cip1-dependent manner. Cancer Res. 2007;67:6053–6063. doi: 10.1158/0008-5472.CAN-06-4037. [DOI] [PubMed] [Google Scholar]
- 38.Aziz MH, Manoharan HT, Verma AK. Protein kinase C epsilon, which sensitizes skin to sun's UV radiation-induced cutaneous damage and development of squamous cell carcinomas, associates with Stat3. Cancer Res. 2007;67:1385–1394. doi: 10.1158/0008-5472.CAN-06-3350. [DOI] [PubMed] [Google Scholar]
- 39.Pan Q, Bao LW, Teknos TN, Merajver SD. Targeted Disruption of Protein Kinase C ε Reduces Cell Invasion and Motility through Inactivation of RhoA and RhoC GTPases in Head and Neck Squamous Cell Carcinoma. Cancer Res. 2006;66:9379–9384. doi: 10.1158/0008-5472.CAN-06-2646. [DOI] [PMC free article] [PubMed] [Google Scholar]
- 40.Perletti GP, Concari P, Brusaferri S, Marras E, Piccinini F, Tashjian AH., Jr Protein kinase C epsilon is oncogenic in colon epithelial cells by interaction with the ras signal transduction pathway. Oncogene. 1998;16:3345–3348. doi: 10.1038/sj.onc.1201871. [DOI] [PubMed] [Google Scholar]
- 41.Wu D, Foreman TL, Gregory CW, McJilton MA, Wescott GG, Ford OH, Alvey RF, Mohler JL, Terrian DM. Protein kinase cepsilon has the potential to advance the recurrence of human prostate cancer. Cancer Res. 2002;62:2423–2429. [PubMed] [Google Scholar]
- 42.Pan Q, Bao LW, Kleer CG, Sabel MS, Griffith KA, Teknos TN, Merajver SD. Protein kinase C epsilon is a predictive biomarker of aggressive breast cancer and a validated target for RNA interference anticancer therapy. Cancer Res. 2005;65:8366–8371. doi: 10.1158/0008-5472.CAN-05-0553. [DOI] [PubMed] [Google Scholar]
- 43.Basu A, Mohanty S, Sun B. Differential sensitivity of breast cancer cells to tumor necrosis factor-alpha: involvement of protein kinase C. Biochem Biophys Res Commun. 2001;280:883–891. doi: 10.1006/bbrc.2000.4209. [DOI] [PubMed] [Google Scholar]
- 44.Li W, Hardwick MJ, Rosenthal D, Culty M, Papadopoulos V. Peripheral-type benzodiazepine receptor overexpression and knockdown in human breast cancer cells indicate its prominent role in tumor cell proliferation. Biochem Pharmacol. 2007;73:491–503. doi: 10.1016/j.bcp.2006.10.025. [DOI] [PubMed] [Google Scholar]
- 45.Lacapere JJ, Papadopoulos V. Peripheral-type benzodiazepine receptor: structure and function of a cholesterol-binding protein in steroid and bile acid biosynthesis. Steroids. 2003;68:569–585. doi: 10.1016/s0039-128x(03)00101-6. [DOI] [PubMed] [Google Scholar]
- 46.Hodge CW, Raber J, McMahon T, Walter H, Sanchez-Perez AM, Olive MF, Mehmert K, Morrow AL, Messing RO. Decreased anxiety-like behavior, reduced stress hormones, and neurosteroid supersensitivity in mice lacking protein kinase Cepsilon. J Clin Invest. 2002;110:1003–1010. doi: 10.1172/JCI15903. [DOI] [PMC free article] [PubMed] [Google Scholar]
- 47.Hofmann J. Modulation of protein kinase C in antitumor treatment. Rev Physiol Biochem Pharmacol. 2001;142:1–96. doi: 10.1007/BFb0117491. [DOI] [PubMed] [Google Scholar]
- 48.Cai H, Smola U, Wixler V, Eisenmann-Tappe I, az-Meco MT, Moscat J, Rapp U, Cooper GM. Role of diacylglycerol-regulated protein kinase C isotypes in growth factor activation of the Raf-1 protein kinase. Mol Cell Biol. 1997;17:732–741. doi: 10.1128/mcb.17.2.732. [DOI] [PMC free article] [PubMed] [Google Scholar]
- 49.Mischak H, Goodnight JA, Kolch W, Martiny-Baron G, Schaechtle C, Kazanietz MG, Blumberg PM, Pierce JH, Mushinski JF. Overexpression of protein kinase C-delta and -epsilon in NIH 3T3 cells induces opposite effects on growth, morphology, anchorage dependence, and tumorigenicity. J Biol Chem. 1993;268:6090–6096. [PubMed] [Google Scholar]