

Abstract
Mycobacterium tuberculosis responds to the changes in environmental conditions through a two-component signaling system that detects reduced O2 tension and NO and CO exposures via the heme-binding GAF domains of two sensory histidine kinases, DosT and DevS, and the transcriptional regulator DosR. We report the first x-ray structure of the DosT heme-bound GAF domain (GAFDosT) in both oxy and deoxy forms determined to a resolution of 2.3 Å. In GAFDosT, heme binds in an orientation orthogonal to that in the PAS domains via a highly conserved motif including invariant H147 as a proximal heme axial ligand. On the distal side, invariant Y169 is in stacking interactions with the heme with its long axis parallel and the plane of the ring orthogonal to the heme plane. In one of the two protein monomers in an asymmetric unit, O2 binds as a second axial ligand to the heme iron, and is stabilized via an H-bond to the OH-group of Y169. The structure reveals two small tunnel-connected cavities and a pore on the protein surface that suggest a potential route for O2 access to the sensing pocket. The limited conformational differences observed between differently heme iron-ligated GAFDosT monomers in the asymmetric unit may result from crystal lattice limitations since atmospheric oxygen binding likely occurs in the crystal as a result of x-ray induced Fe3+ photoreduction during diffraction data collection. Determination of the GAFDosT structure sets up a framework in which to address ligand-recognition, discrimination, and signal propagation schemes in the heme-based GAF domains of biological sensors.
Mycobacterium tuberculosis can survive for decades in a dormant state in hypoxic granulomas in the lung, emerging periodically to cause recurrent infections (1). M. tuberculosis enters latency in response to hypoxia or exposure to physiological concentrations of NO and/or CO via induction of the dormancy regulon Dos (2-6) (originally designated Dev (7)), comprised of the signaling histidine kinases DevS (also called DosS) and DosT, and the cognate response regulator DosR (also called DevR) (8-10). DevS and DosT each contain two tandem GAF domains whose N-terminal heme-binding sensory elements (11-14) directly bind O2, NO, and CO (12-14). Both NO or CO binding to, or O2 dissociation from, the N-terminal GAF domain initiate autophosphorylation by the C-terminal protein-histidine kinase domain, with subsequent phosphoryl transfer to the aspartate residue of the transcriptional regulator DosR (9, 10).
The oxidation and ligation states of the heme iron modulate DevS and DosT autokinase activity. Ferrous DevS and deoxy and CO- or NO-bound DosT show significant increases of autokinase activity compared to the ferric DevS and oxy DosT, respectively, which led to the conclusion that DevS functions as a redox sensor, whereas DosT functions as a hypoxia sensor (14). However, DosT binds NO five thousand times more tightly than O2 and 190 times tighter than CO (13), suggesting that one specific function for this sensor may be to detect low concentrations of NO against a high background concentration of O2. NO is generated by activated macrophages as an immune response factor which exhibits antimycobacterial properties and can kill tubercle bacilli in vitro (15). On the other hand, NO acts as a potent reversible inhibitor of aerobic respiration in mitochondria and in bacteria (16) and is a versatile signaling agent in eukaryotic systems (17). It has been demonstrated that NO and CO produced by the activated host immune system are “hijacked” by M. tuberculosis to perform a host-to-pathogen signaling function (4-6), thus disclosing the level of immune activation at the early stages of infection. O2 and low concentrations of NO and/or CO mediate opposing effects on the gene expression, as NO and CO induce and O2 represses Dos regulon expression (4). Given its prominently high affinity to NO, DosT would be capable of mediating an early M. tuberculosis response on this host immune factor, even though the oxygen tension may still be normal or close to normal.
GAF and PAS domains are ubiquitous cytoplasmic signaling units in prokaryotic and eukaryotic organisms (18, 19). They have a ligand binding pocket that accommodates a variety of small-molecule ligands, including flavin, adenine and guanine, as well as linear tetrapyrrole chromophores (bilins) (20) and heme (11-13). Although GAF and PAS domains are unrelated in amino acid sequence, the similarities of their structural topologies have previously been recognized (21) through determination of a number of x-ray structures for both sensory domains from different organisms. Among them, crystal structures of the heme-bound PAS domains have been reported (22-26). Despite the finding that GAF domains can bind heme (11-13), and the importance of heme-bound GAF sensors for activation of the DosR-dependent hypoxia response in M. tuberculosis, no structural information is available for any heme-bound member of the GAF domain family. To advance our understanding of oxygen deprivation and NO/CO signaling in this obligate aerobic pathogen, we have determined the x-ray structure of the sensing GAF domain of M. tuberculosis DosT (GAFDosT)1 in the oxygen-free and the oxygen-bound states.
Experimental Procedures
GAFDosT Cloning and Expression
The sequence coding for amino acids 61-208 was amplified from the full-length DosT using Pfu Turbo DNA polymerase (Stratagene) and upstream CCGCCGCCATATGCATCATCATCATCATCACGAGAACTTATATTTTCAAGGAAAGC TCGACGCCACCCTGCGCGCC and downstream GCGTCGGATCCCTATTACCGTGATTCCTCGAAGAGAC primers. The boldface indicates His6-tag. The underlined letters indicate an NdeI restriction cloning site in the upstream primer, and the BamHI restriction cloning site in the downstream primer. The purified PCR product was digested with NdeI and BamHI and ligated into a pET23a+ vector (Invitrogen) cleaved with the same restriction enzymes and treated with alkaline phosphatase. The identity of the resulting expression vector pET23a+ GAFDosT was confirmed by DNA sequencing.
GAFDosT was heterologously expressed according to the protocol previously described for DevS (12). Briefly, BL21gold DE3 cells were co-transformed with pET23a+ GAFDosT and pT-GroE. The cells were grown on Luria-Bertani agar plates containing both ampicillin (50 μg/ml) and chloramphenicol (34 μg/ml). Overnight cultures were grown at 37 °C and then used to inoculate flasks containing 1.5 liter of Luria-Bertani medium supplemented with ampicillin (100 μg/ml) and chloramphenicol (34 μg/ml). The cells were grown at 37 °C and 230 rpm until an OD600 reached 0.8-1.0. At that time isopropyl 1-thio-β-D-galactopyranoside (1 mM) and hemin (30 mg/l) were added. The cells were incubated for an additional 20 h at 18 °C and then harvested by centrifugation at 5000 rpm for 25 min.
GAFDosT Purification
The cells were lysed in 50 mM sodium phosphate, pH 7.6, containing 10% glycerol, 200 mM NaCl, 1% Triton X-100, 0.5 mg/ml lysozyme, 5 mM MgCl2, 5 mM ATP and the protease inhibitors antipain (1 μg/ml), leupeptin (1 μM), pepstatin (1 μM), and PMSF (0.1 mM). The cell suspension was incubated with shaking at 37 °C for 30 min. The cell membranes were disrupted by sonication using a Branson sonicator (VWR Scientific) while cooling on ice. Cell debris was removed by centrifugation at 35000 rpm for 1 h at 4 °C. The soluble extract was applied to a 5-ml HisTrap™ HP column (GE Healthcare) at a rate of 1 ml/min. The column was then washed with 50 ml each of 20 and 50 mM imidazole in 50 mM sodium phosphate, pH 7.6, 10% glycerol, and 500 mM NaCl at a rate of 2 ml/min. The recombinant protein was eluted with 50 ml of 250 mM imidazole in the same buffer. The protein was then mixed with AcTEV™ (Invitrogen) protease (10 μg/μl) and DTT (1 mM) and dialysed for four days at 4 °C against 20 mM HEPES, pH 7.6, containing 150 mM NaCl, 1 mM DTT, and 10% glycerol. The cleaved protein was separated from the His6-tagged counterpart using a 5-ml HisTrap™ HP column, then concentrated, and oxidized with potassium ferricyanide (10 mg/ml). Potassium ferricyanide was removed using a PD10 column (GE Healthcare) equilibrated with 20 mM HEPES, pH 7.6, containing 150 mM NaCl, and virtually homogeneous ferric GAFDosT was concentrated to ∼ 0.5 mM, as estimated based on the Soret absorbance at 407 nm using the extinction coefficient of 166,076 M-1cm-1 previously calculated for DevS based on the correlation between amino acid analysis and heme content (12).
Crystallization and Data Collection
Crystallization conditions were identified by the hanging drop vapor diffusion method using an Index high throughput screen matrix (Hampton Research) and a nanoliter drop setter Mosquito (TTP LabTech). Diffraction-quality crystals were generated in the 24-well crystallization plates by mixing 1-2 μl of 0.5 mM fully oxidized GAFDosT with 2 μl of well-solution containing 50% Tacsimate, pH 6.0, a crystallization reagent composed of a mixture of seven organic acid salts. Prior to data collection, the crystals were plunged in the well solution supplemented with 20% glycerol, then flash-frozen in liquid nitrogen. Native and two-wavelength anomalous dispersion x-ray diffraction data were collected at 100-110 K at beamline 8.3.1, Advanced Light Source, Lawrence Berkeley National Laboratory. Diffraction data reduction was performed using HKL2000 (27) or MOSFLM (28) software. Anomalous diffraction data were collected from one crystal at two wavelengths, one corresponding to the median between the Fe peak and the inflection point, another, at 375 eV higher (Table 1). The crystal diffracted in the P43 space group and had two molecules per asymmetric unit.
Table 1.
Diffraction data, phasing and refinement statistics
| Native | Fe anomalous dispersion | ||
|---|---|---|---|
| Data collection | |||
| Space group | P43 | P43 | |
| Cell dimensions | |||
| a, b, c (Å) | 87.9, 87.9, 66.8 | 88.3, 88.3, 66.4 | 88.3, 88.3, 66.4 |
| α, β, γ (°) | 90, 90, 90 | 90, 90, 90 | 90, 90, 90 |
| Peak/Inflection Median | Remote | ||
| Wavelength | 1.11587 | 1.73989 | 1.65312 |
| Resolution (Å) | 2.3 | 3.1 | 2.95 |
| Molecules in the asymmetric unit | 2 | 2 | 2 |
| Rsym (in last shell)1 | 6.7 (48.8) | 8.2 (25.1) | 8.1 (33.8) |
| I / σI | 43.0 (4.6) | 31.0 (6.4) | 30.5 (4.5) |
| Completeness (%) | 100.0 (99.8) | 100.0 (99.8) | 100.0 (100.0) |
| Redundancy | 7.9 (6.4) | 7.6 (6.9) | 7.6 (6.9) |
| Refinement statistics | |||
| Resolution (Å) | 2.3 | ||
| No. reflections | 21731 | ||
| Rwork / Rfree | 23.6/28.9 | ||
| No. atoms | |||
| Protein | 2262 | ||
| Heme | 86 | ||
| O2 ligand | 2 | ||
| Water | 115 | ||
| B-factors | |||
| Protein | 50.7 | ||
| Heme | 37.1 | ||
| O2 ligand | 43.5 | ||
| Water | 42.5 | ||
| R.m.s deviations | |||
| Bond lengths (Å) | 0.022 | ||
| Bond angles (°) | 2.28 | ||
Values in parentheses are for highest-resolution shell.
Structure Determination and Refinement
The ELVES automated software system (29) was used to determine the GAFDosT crystal structure from the anomalous dispersion of the heme iron. ELVES identified and refined positions of the two possible Fe sites. Initial phases with an overall figure of merit of 0.20 were improved by solvent flattening (mean figure of merit after solvent flattening 0.67) to provide an interpretable electron density map. Automated model building with ARP/wARP (30) and RESOLVE (31) placed a polyalanine backbone for 76% of residues in the asymmetric unit. The remaining model was traced manually with COOT (32), alternated with TLS and positional refinement against the 2.3 Å native data set using REFMAC5 (33, 34). The composite omit map was calculated using CNS (35).
The final refined model includes 146 (60-205) and 149 (60-208) amino acid residues in chains A and B in an asymmetric unit, respectively, each bound to a heme prosthetic group with the distal pocket occupied with a water molecule (chain A) or dioxygen (chain B) as the second axial ligand (Table 1). The monitoring of quality of the final structure with PROCHECK indicated 90.2% residues in most favored, 5.7% residues in additional allowed, 1.6% residues in generously allowed, and 2.5% (3 residues) in disallowed regions of the Ramachandran plot for chain A, and 84.7% residues in most favored, 11.3% residues in additional allowed, 2.4% residues in generously allowed, and 1.6% (2 residues) in disallowed regions for chain B.
Results
GAFDosT Photoreduction
During the first few seconds of diffraction data collection, the color of the irradiated part of the crystal changed to a more saturated hue of red (Fig. S1) and remained that way under prolonged x-ray exposure. This phenomenon can be readily explained by x-ray induced photoreduction of metal centers (36-38), which has been studied particularly for hemoproteins (39, 40). Thus, the crystal structure reported in this work is most likely for a reduced state of the protein, even though initially its fully oxidized form was used to generate the crystals.
Overall Structure of GAFDosT
The GAFDosT structure was determined to a resolution of 2.3 Å by using heme Fe as an anomalously scattering atom (Table 1). The asymmetric unit contains two differently heme iron-ligated GAFDosT monomers adopting similar conformations (r.m.s.d. = 0.5 Å for Cα atoms). Although, as expected, the overall GAFDosT topology resembles that of previously defined GAF and PAS domains (Fig. 1), GAFDosT bears little structural similarity to previously characterized heme oxygen-sensing PAS domains (22-26) (Fig. 1A, B). Firstly, in GAFDosT, heme binds in a virtually orthogonal orientation with respect to the twisted surface of the β sheet (Fig. 1A), in contrast to the more co-planar orientation of heme in the PAS domain (Fig. 1B). Secondly, the histidine residue serving as a proximal axial ligand originates from the different structural elements: an equivalent of the α3 helix in the PAS domain and a bend of the long β3-β4 loop in GAFDosT (see Fig. 2A for a reference). Collectively, the heme binding mode in GAFDosT is similar to the cyclic nucleotide binding in GAF, rather than heme binding in a PAS domain, even though GAFDosT contains a five-stranded anti-parallel β sheet instead of the six-stranded one found in GAF motifs that bind cyclic nucleotides (41) (Fig. 1C) or linear tetrapyrrole chromophores (42) (Fig. 1D). The β sheet of GAFDosT is packed directly against two long anti-parallel α helices (α1 and α4) on one side of the sheet and the short α3 helix on the opposite side (Fig. 2), whereas in the PAS domain, a pocket between the α3 helix and the β sheet accommodates heme.
Figure 1.

GAF and PAS sensory domains. Ribbon diagrams of GAF and PAS domains from different organisms are shown in the same orientation. Bound ligands are highlighted in yellow, PDB ID codes of the shown structures are in parentheses.
Figure 2.
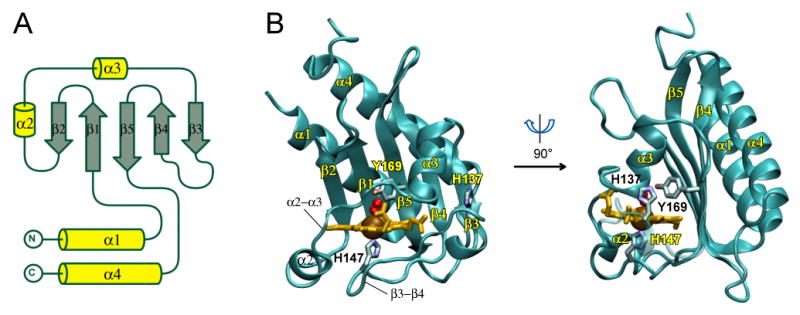
Overall structure of GAFDosT. A, Topology diagram of GAFDosT is shown. B, Ribbon representation of the two orthogonal views of GAFDosT. The O2 ligand is represented by red spheres, and the heme (orange), and H137, H147, and Y169 are shown as sticks.
Heme Binding Site
The heme in GAFDosT is solvent-shielded by a short α2 helix and the α2-α3 connecting loop, both of which encircle the heme along the macrocycle edge, making contacts at residues Tyr98, Arg106, Ile109, Gly110, Ser111, Leu112, Glu114, Gly115, Arg116, Gly117, and Val118, which are within 4 Å of the heme. In addition, the long β3-β4 loop generates a proximal (with respect to heme) surface of GAFDosT, contacting heme at residues Ile134, Ala139, Ser140, Val141, Gly142, Phe143, Pro144, His147, Pro148, Pro149, Met150, Phe153, and Thr171 (marked by blue triangles in Fig. 3), which are within 6 Å of the heme macrocycle. This latter arrangement constitutes a proximal heme binding motif with a proximal iron axial ligand, H147 (highlighted in cyan).
Figure 3.
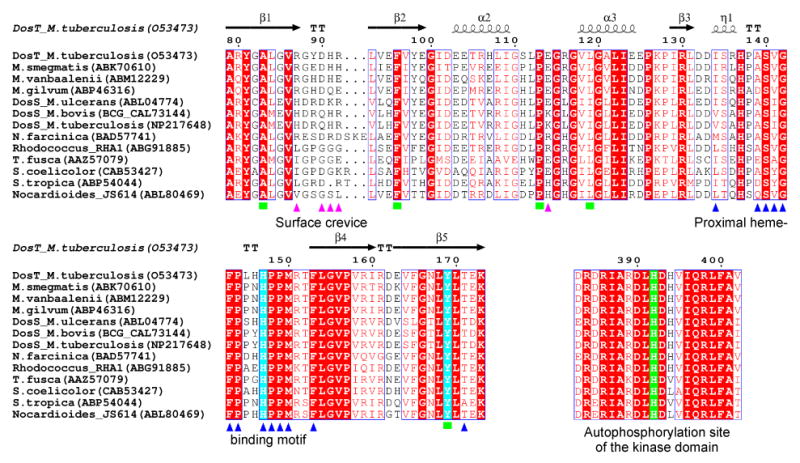
Heme-binding and ligand-binding motifs. Two fragments of multiple sequence alignments between putative two-component sensory histidine kinases from different organisms are shown. Accession numbers of the proteins in Swiss-Prot/TrEMBL (http://us.expasy.org/sprot) or NCBI (http://www.ncbi.nlm.nih.gov) databases are given next to the name of the host organism (M. tuberculosis, Mycobacterium tuberculosis; M. smegmatis, Mycobacterium smegmatis; M. vanbaalenii, Mycobacterium vanbaalenii; M. gilvum, Mycobacterium gilvum, M. ulcerans, Mycobacterium ulcerans; M. bovis, Mycobacterium bovis; N. farcinica, Nocardia farcinica; T. fusca, Thermobifida fusca; S. coelicolor, Streptomyces coelicolor, S. tropica, Salinispora tropica). Secondary structure annotation and residue numbering on top correspond to GAFDosT of M. tuberculosis. The α-helices are represented by spirals and β-strands by arrows. Alignments were performed for the full-length sequences using the MAP algorithm as implemented in the BCM Search Launcher (59). Entire alignments are shown in the Supplementary Figure S2. Residues constituting the proximal heme binding motif as deduced from the crystal structure are marked with blue triangles. Residues constituting the distal ligand-binding pocket are marked with green squares. Residues making up the surface crevice are marked with pink triangles. Invariant H147 and Y169 are highlighted in cyan. Highly conserved H392 of the C-terminal kinase domain implicated as the site of autophosphorylation (9, 10) is highlighted in green.
Ligand Binding Site
A small ligand-binding pocket with an accessible volume of 10 Å3, as determined using a 1.4 Å probe, is located on the distal side of the heme (Fig. 4A). Five side chains within 4 Å of the heme (marked by green squares in Fig. 3), spread along the primary sequence, constitute a ligand-binding GAF motif: A83-F96-P113-L119-Y169, which may convey a signal simultaneously to the different regions of GAFDosT. The hydroxyphenyl ring of Y169 protrudes from the β5 strand with the long axis parallel to the heme plane and the OH-group projecting onto the nitrogen atom of the pyrrole ring I (Fig. 4A). The plane of the Y169 ring is orthogonal to the heme plane with the ring edge only 3.44 Å away from the heme δ-meso-carbon atom, suggesting π–π interactions between these aromatic systems. Y169 separates the ligand-binding pocket from a larger connected cavity (accessible volume of 45.0 Å3) comprised of an amino acid motif, R87-L119-I123-N167-Y169. The cavity accommodates two water molecules separated by 2.5 Å from each other in the O2-bound monomer and one water molecule in the O2-free monomer. These water molecules H-bond to the guanidinium group of R87 and the carboxamide group of N167 (Fig. 4A).
Figure 4.

O2 binding in GAFDosT. A, GAFDosT tunnel-connected ligang-binding pocket and the adjacent cavity are shown. The O2 ligand and the water molecules that may indicate a ligand migration route through the protein matrix are represented by the red spheres. B, Semi-transparent surface of GAFDosT is shown. The putative port of the ligand entry is pointed at by a blue arrow. C, The solvent-accessible molecular surface of the deoxy form color-coded for electrostatic potential as generated with GRASP is shown. The deepest shades of red and blue correspond to potentials of -5.5 and 7.3 kcal, respectively. The dipole moment of 275 debye is represented by a cyan arrow.
The tunnel-connected cavities can be thought of as a pathway leading from the ligand-binding site to a small pore on the molecular surface adjacent to a surface crevice formed by the set of residues R87, D90, H91, R92, E114 (marked by pink triangles in Fig. 3) holding an acetate group bound in both monomers of the crystal structure (Fig. 4B). The surface pore may serve as a port of ligand entry. The 275 debye molecular dipole moment of GAFDosT points straight through that pore (Fig. 4C).
Binding of a Second Axial Iron Ligand
In one of the two monomers in the asymmetric unit, weak electron density for a water molecule centered within 3.7 Å of the heme iron and at an H-bond distance of 2.46 Å from the Y169 phenolic O atom is evident in the electron density composite omit map (Fig. 5A). The water molecule tends to maintain a perfect H-bonding geometry to Y169 at the expense of the coordination bond to the heme iron. Consistent with reduction of the Fe center during x-ray data collection, this water molecule might have been released from the iron coordination sphere but nevertheless trapped in the vicinity by an H-bond to Y169.
Figure 5.
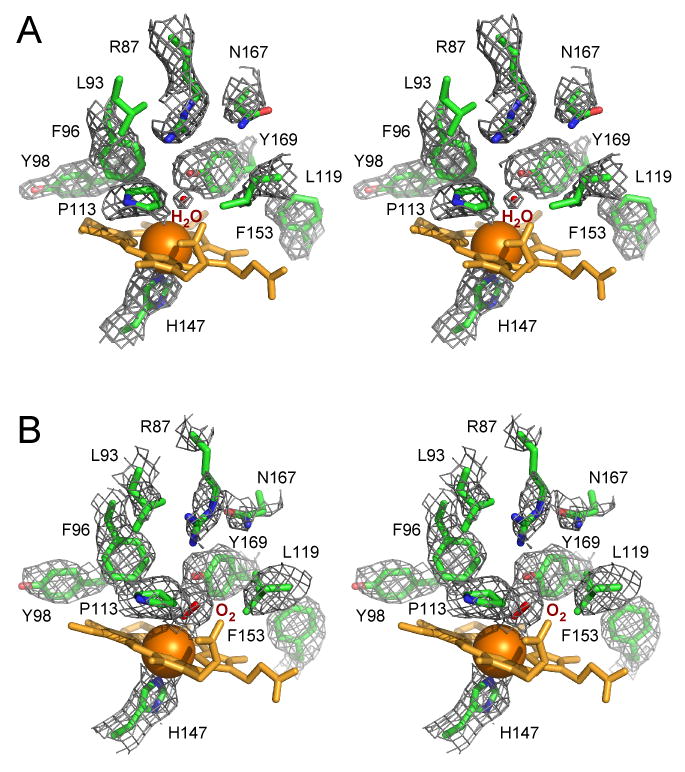
Electron density map. Fragments of the composite omit electron density map generated around ligand-binding site contoured at 1.1 σ are shown by a gray mesh in stereo mode for the deoxy (A) and oxy (B) GAFDosT. To avoid excessive cluttering, heme (orange) was excluded from the map calculation in (A) and (B), and Leu93 was excluded in (A) only. Amino acid side chains are in green, oxygen atoms in red, nitrogen in blue.
In contrast, prominent electron density was observed next to the heme iron in the second monomer in the asymmetric unit (Fig. 5B), where an axial water ligand was also placed initially. Later in the refinement, the residual Fo-Fc map revealed a positive peak adjacent to the oxygen atom, consistent with the binding of a diatomic molecule as a sixth iron ligand. Three diatomic gases, O2, CO, and NO, have been shown to bind and modulate the autokinase activity of DevS and DosT (13, 14). We reasoned that O2, abundant under the aerobic conditions used for crystallization and data collection, has the highest probability to be a second axial ligand in the irradiated crystals. Therefore, O2 was fitted into the electron density (Fig. 5B) with the full occupancy within 2.60 Å of the heme iron for the proximal oxygen atom (with respect to heme iron), and 2.50 Å of the Y169 OH-group for the distal oxygen atom and 2.94 for the proximal one, suggesting a strong H-bonding role for Y169. The Fe-O bond in GAFDosT (2.60 Å) is somewhat longer that reported in oxy-complex of the heme-bound PAS domain of Escherichia coli EcDos (2.37 Å (PDB ID code 1VB6) (26) and 2.31 Å (PDB ID code 1S66) (25)). In contrast, the Fe-O bond reported for the Bradyrhizobium japonicum FixL oxy-complex (PDB ID code 1DP6) (43) is notably shorter (1.81 Å), perhaps due to the polar environment of the O2-binding pocket caused by the proximity of the side chain of the PAS domain invariant arginine. This trend in Fe-O bond distances is consistent with the Fe-O stretching frequencies observed in the resonance Raman spectra. Indeed, the Fe-O2 stretching mode is observed near 560 cm-1 in DevS (65% identity to DosT, including the H-bonding distal tyrosine residue) (44) and EcDos (45), but at 571 cm-1 in FixL (46).
The oxygen molecule is tilted at an ∼123° angle to the heme plane and leans toward the porphyrin γ-meso-carbon atom. The bend angle of O2 in GAFDosT is close to those, 118° (26) and 130° (25), previously observed in the crystal structures reported for E. coli EcDOS. As in GAFDosT, in both EcDos x-ray structures only one of the two protein monomers in an asymmetric unit is in the oxy form. For B. japonicum FixL, the reported bend angles for O2 and NO are 142° (43) and 122° (43), respectively. At the same time, both CO and CN- bind almost orthogonally to the heme plane (24, 47), thus excluding a possibility of any of them being bound in the GAFDosT sensing pocket. Given the demonstrated ease of x-ray induced heme iron photoreduction (39, 40) and the abundance of oxygen (but not NO) in the air, coordination of the oxygen molecule in GAFDosT almost certainly occurred to the ferrous iron in the crystal during diffraction data collection.
Inspection of the crystal structure reported here indicates that the distal Y169 cannot itself coordinate to the heme Fe atom without a significant conformational rearrangement of the distal heme pocket.
Conformational Differences between GAFDosT Monomers
Small conformational differences observed between differently ligated GAFDosT monomers largely converge to two protein regions, the N-terminus of the α2 and the C-terminus of the α3 helices, where pairs of consecutive glutamate residues, E103-E104 and E124-E125, respectively, are located (Fig. 6). The occurrence of pairs of negatively charged residues conserved between DosT and DevS (Fig. 3) in both conformationally variable spots is intriguing and may suggest that the surface electrostatic potential is modulated during signaling, possibly affecting downstream interactions with other protein domains. However, as far as the conformational changes are concerned, GAFDosT does not operate as an isolated domain, hence, the possibility remains that it may behave differently as a part of the full-length enzyme.
Figure 6.
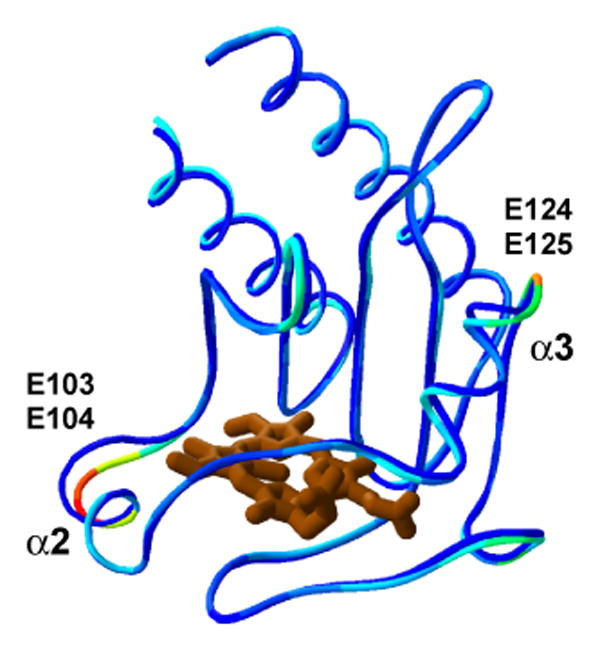
Conformational differences between GAFDosT monomers. Superimposition of the two GAFDosT monomers in the asymmetric unit is shown as a ribbon diagram. C-termini are trimmed up to A201 to emphasize the structural differences between monomers by coloring the oxy form according to the r.m.s. deviations (highest in red, lowest in blue). The deoxy form is shown as a blue ribbon.
Heme-Binding and Ligand-Binding Motifs
A BLAST search of the NCBI protein database against the full-length M. tuberculosis DosT sequence returns thirteen prokaryotic proteins with sequence homology extending nearly the entire protein length, including an N-terminal GAF domain and a C-terminal kinase region (Fig. S2). Two fragments of the Supplementary Figure S2 representing the structurally defined portion of the N-terminal GAF domain and the autophosphorylation site of the C-terminal kinase domain are shown in Fig. 3. This group of clearly related proteins in addition to DosT includes three DevS proteins from Mycobacterium species and nine proteins of unknown function from aerobic bacteria. Worth mentioning is that His392 (highlighted in green in Figure 3), implicated as the site of autophosphorylation in DosT (10) and DevS (9), is invariant in all thirteen proteins. Also, the iron proximal ligand H147 (highlighted in cyan) is one of two invariant histidine residues in the heme-binding GAF motif, with the other, H137, situated on the domain surface (Fig. 2B), suggesting a role for it in protein-protein interactions. Y169, which provides the H-bond to the bound O2 ligand, is also invariant.
The alignments show conservation of the proximal heme-binding and ligand-binding motifs as they were deduced from the GAFDosT crystal structure, suggesting that these bacterial proteins may all be utilized by their host organisms as heme-based GAF sensors for adaptive responses to fluctuating O2, CO, or NO levels. Thus, nine of the total of thirteen residues (marked by blue triangles in Fig. 3) that constitute the have been observed in sperm motif Ile134-Ala139-Ser140-Val141-Gly142-Phe143-Pro144-His147-Pro148-Pro149-Met150-Phe153-Thr/Ala171 (boldface indicates invariant residues) are invariant in all the putative family members, suggesting a common heme binding mode. Four of the total five residues (marked by green squares) of the ligand-binding motif Ala83-Phe96-Pro113-Leu(Ile)119-Tyr169 are invariant, whereas leucine at position 119 is substituted by isoleucine in DevS sequences. At the same time, the residues contacting the heme edge are more variable. In contrast, the residues R87, D90, H91, R92, and E114 (marked by pink triangles) constituting the surface crevice adjacent to the putative port of ligand entry (Fig. 4B,C) are, remarkably, least conserved amongst all the residues of the N-terminal GAF domain.
Discussion
Understanding oxygen deprivation and NO/CO signaling in the obligate aerobic pathogen M. tuberculosis is an important pharmacological objective since in the dormant state achieved through the expression of the Dos regulon genes M. tuberculosis is least susceptible for treatment with the available antimycobacterial drugs. In this work, we report the x-ray structure of the heme-bound GAFDosT, which may serve as a prototype for the heme-based GAF sensory domains of histidine kinases.
Despite the recognized similarities of structural topologies between GAF and PAS domains (Fig. 1), the heme binding mode of GAFDosT differs from that of the PAS domains, in both heme orientation and in specific heme-protein and ligand-protein contacts. GAFDosT provides the first insight into the ligand-binding pocket architecture of heme-based GAF sensors. It predicts a key role for Y169 in sensor-ligand interactions, as Y169 is the only residue in the GAFDosT ligand-binding site strategically positioned to provide an H-bond to the bound oxygen. The immediate presence of the Y169 OH-group in GAFDosT contrasts with the hydrophobic environment of the heme-containing PAS-domain of FixL sensors that govern nitrogen fixation in Rhizobia, in which the side chain of a highly conserved arginine enters the O2-binding pocket to directly interact with the bound oxygen only in response to its binding (22, 24).
Precedents for a tyrosine in the distal pocket of heme proteins that bind diatomic gaseous ligands are available in the literature. Tyrosine is the primary factor responsible for high oxygen affinity in heme enzymes acting as NO dioxygenases, such as truncated-N hemoglobins from Ascaris (48) or M. tuberculosis (49), that catalyze NO detoxification to an innocuous nitrate under hypoxic conditions. Replacement of tyrosine by phenylalanine in truncated-N hemoglobin increases the O2 rate dissociation constant (koff) by two orders of magnitude (50). However, in NO dioxygenases, O2 is stabilized by two H-bond donor residues, tyrosine and glutamine (51), whereas in GAFDosT Y169 is the only residue in the ligand-binding site capable of providing an H-bond to finely tune affinity of the sensor for a precise response to a given oxygen concentration.
As the heme in GAFDosT is not readily accessible from the environment, the ligand molecule has to migrate to the active site across the protein matrix, probably via tunnel-connected cavities on the distal side of the heme. The limited number of water molecules associated via H-bonds with tunnel amino acid residues (Fig. 4A,B) may delineate a putative ligand migration route. Y169, which deeply protrudes into the sensing pocket, blocks the continuity of the tunnel and is a potential barrier for ligand diffusion. Thus, protein motions would be expected to affect the dynamics of ligand migration along the tunnel. In this regard, small cavities (13-45 Å3) have been observed in sperm whale myoglobin that are recognized to act as transient binding sites for gaseous ligands O2, NO, and CO (52-56).
Although a conformational switch following binding of a signaling ligand has been postulated for oxygen sensors (57), the experimentally observed magnitudes of such changes vary between deoxy and oxy states among the two heme-containing sensory PAS domains for which crystal structures are available. Sizable and highly localized conformational differences between differently ligated heme domains were described for the Escherichia coli O2 sensor EcDos (25, 26), where a methionine side chain axially coordinates to the heme iron in the absence of the O2 ligand. Less extensive changes accompany O2 binding in FixL sensors (22-24, 43). Even smaller conformational changes between differently ligated GAFDosT monomers observed in this study may result from crystal lattice limitations, since binding of atmospheric oxygen in the crystal likely occurred as a result of x-ray induced Fe3+ photoreduction. Alternatively, since the heme binding mode in GAFDosT is very different compared to that in more extensively studied heme-based PAS sensors, the modest conformational variations observed between the two GAFDosT structures may be indicative of a new mode of signal propagation in heme-based sensors.
In summary, the determination of the first x-ray crystal structure of the oxygen sensing GAF domain, reported here, is an important step toward understanding the mechanism of signal recognition in the M. tuberculosis sensory histidine kinases DosT and DevS. The crystal structure reveals the key functional residues that are highly conserved in both proteins and sets up a framework in which to test the hypothesis. Thus, the H-bonding role of the distal tyrosine in discriminating the gaseous ligands has been confirmed in parallel studies (58) via site-directed mutagenesis of the full-length histidine kinase DevS, combined with analysis of the mutants in autophosphorylation assays and by resonance Raman spectroscopy.
Supplementary Material
Spectral characterization of GAFDosT (Figure 1S), GAFDosT x-ray induced photoreduction (Figure S2), and full-length multiple sequence alignments between putative two-component sensory protein-histidine kinases from different organisms (Figure S3). This material is available free of charge via the Internet at http:/pubs.acs.org
Acknowledgments
We thank Potter Wickware for critical reading of the manuscript, Clinton Nishida and Chris Waddling for assistance with software and instrumentation, and the staff members of beamline 8.3.1 at the Advanced Light Source at Lawrence Berkeley National Laboratory for assistance.
Abbreviations
- GAFDosT
N-terminal GAF sensory domain of DosT
- GAF
sensory domain named for its association with cGMP-regulated cyclic nucleotide phosphodiesterases, adenylate cyclases, and the bacterial transcriptional regulator FhlA
- PAS
sensory domain named for its association with the Per, ARNT, and Sim proteins
Footnotes
This work was supported by NIH RO1 grants AI74824 (P.O.M.) and GM078553 (L.M.P.). The Advanced Light Source is supported by the Director, Office of Science, Office of Basic Energy Sciences, of the U.S. Department of Energy under Contract No. DE-AC02-05CH11231.
Accession Numbers: Coordinates have been deposited with the Protein Data Bank with the accession code 2VZW.
References
- 1.Wayne LG, Sohaskey CD. Nonreplicating persistence of Mycobacterium tuberculosis. Annu Rev Microbiol. 2001;55:139–163. doi: 10.1146/annurev.micro.55.1.139. [DOI] [PubMed] [Google Scholar]
- 2.Ohno H, Zhu G, Mohan VP, Chu D, Kohno S, Jacobs WR, Jr, Chan J. The effects of reactive nitrogen intermediates on gene expression in Mycobacterium tuberculosis. Cell Microbiol. 2003;5:637–648. doi: 10.1046/j.1462-5822.2003.00307.x. [DOI] [PubMed] [Google Scholar]
- 3.Park HD, Guinn KM, Harrell MI, Liao R, Voskuil MI, Tompa M, Schoolnik GK, Sherman DR. Rv3133c/dosR is a transcription factor that mediates the hypoxic response of Mycobacterium tuberculosis. Mol Microbiol. 2003;48:833–843. doi: 10.1046/j.1365-2958.2003.03474.x. [DOI] [PMC free article] [PubMed] [Google Scholar]
- 4.Voskuil MI, Schnappinger D, Visconti KC, Harrell MI, Dolganov GM, Sherman DR, Schoolnik GK. Inhibition of respiration by nitric oxide induces a Mycobacterium tuberculosis dormancy program. J Exp Med. 2003;198:705–713. doi: 10.1084/jem.20030205. [DOI] [PMC free article] [PubMed] [Google Scholar]
- 5.Shiloh MU, Manzanillo P, Cox JS. Mycobacterium tuberculosis senses host-derived carbon monoxide during macrophage infection. Cell Host Microbe. 2008;3:323–330. doi: 10.1016/j.chom.2008.03.007. [DOI] [PMC free article] [PubMed] [Google Scholar]
- 6.Kumar A, Deshane JS, Crossman DK, Bolisetty S, Yan BS, Kramnik I, Agarwal A, Steyn AJ. Heme oxygenase-1-derived carbon monoxide induces the Mycobacterium tuberculosis dormancy regulon. J Biol Chem. 2008;283:18032–18039. doi: 10.1074/jbc.M802274200. [DOI] [PMC free article] [PubMed] [Google Scholar]
- 7.Kinger AK, Tyagi JS. Identification and cloning of genes differentially expressed in the virulent strain of Mycobacterium tuberculosis. Gene. 1993;131:113–117. doi: 10.1016/0378-1119(93)90678-v. [DOI] [PubMed] [Google Scholar]
- 8.Roberts DM, Liao RP, Wisedchaisri G, Hol WG, Sherman DR. Two sensor kinases contribute to the hypoxic response of Mycobacterium tuberculosis. J Biol Chem. 2004;279:23082–23087. doi: 10.1074/jbc.M401230200. [DOI] [PMC free article] [PubMed] [Google Scholar]
- 9.Saini DK, Malhotra V, Dey D, Pant N, Das TK, Tyagi JS. DevR-DevS is a bona fide two-component system of Mycobacterium tuberculosis that is hypoxia-responsive in the absence of the DNA-binding domain of DevR. Microbiology. 2004;150:865–875. doi: 10.1099/mic.0.26218-0. [DOI] [PubMed] [Google Scholar]
- 10.Saini DK, Malhotra V, Tyagi JS. Cross talk between DevS sensor kinase homologue, Rv2027c, and DevR response regulator of Mycobacterium tuberculosis. FEBS Lett. 2004;565:75–80. doi: 10.1016/j.febslet.2004.02.092. [DOI] [PubMed] [Google Scholar]
- 11.Sardiwal S, Kendall SL, Movahedzadeh F, Rison SC, Stoker NG, Djordjevic S. A GAF domain in the hypoxia/NO-inducible Mycobacterium tuberculosis DosS protein binds haem. J Mol Biol. 2005;353:929–936. doi: 10.1016/j.jmb.2005.09.011. [DOI] [PubMed] [Google Scholar]
- 12.Ioanoviciu A, Yukl ET, Moenne-Loccoz P, Ortiz de Montellano PR. DevS, a heme-containing two-component oxygen sensor of Mycobacterium tuberculosis. Biochemistry. 2007;46:4250–4260. doi: 10.1021/bi602422p. [DOI] [PMC free article] [PubMed] [Google Scholar]
- 13.Sousa EH, Tuckerman JR, Gonzalez G, Gilles-Gonzalez MA. DosT and DevS are oxygen-switched kinases in Mycobacterium tuberculosis. Protein Sci. 2007;16:1708–1719. doi: 10.1110/ps.072897707. [DOI] [PMC free article] [PubMed] [Google Scholar]
- 14.Kumar A, Toledo JC, Patel RP, Lancaster JR, Jr, Steyn AJ. Mycobacterium tuberculosis DosS is a redox sensor and DosT is a hypoxia sensor. Proc Natl Acad Sci U S A. 2007;104:11568–11573. doi: 10.1073/pnas.0705054104. [DOI] [PMC free article] [PubMed] [Google Scholar]
- 15.Nathan C, Ehrt S. Nitric oxide in tuberculosis. In: Rom W, Garay S, editors. Tuberculosis. Lippincott, Williams and Walkins; New York: 2003. pp. 215–235. [Google Scholar]
- 16.Brown GC. Regulation of mitochondrial respiration by nitric oxide inhibition of cytochrome c oxidase. Biochim Biophys Acta. 2001;1504:46–57. doi: 10.1016/s0005-2728(00)00238-3. [DOI] [PubMed] [Google Scholar]
- 17.Martin E, Davis K, Bian K, Lee YC, Murad F. Cellular signaling with nitric oxide and cyclic guanosine monophosphate. Semin Perinatol. 2000;24:2–6. doi: 10.1016/s0146-0005(00)80045-2. [DOI] [PubMed] [Google Scholar]
- 18.Martinez SE, Beavo JA, Hol WG. GAF domains: two-billion-year-old molecular switches that bind cyclic nucleotides. Mol Interv. 2002;2:317–323. doi: 10.1124/mi.2.5.317. [DOI] [PubMed] [Google Scholar]
- 19.Galperin MY. Bacterial signal transduction network in a genomic perspective. Environ Microbiol. 2004;6:552–567. doi: 10.1111/j.1462-2920.2004.00633.x. [DOI] [PMC free article] [PubMed] [Google Scholar]
- 20.Wagner JR, Brunzelle JS, Forest KT, Vierstra RD. A light-sensing knot revealed by the structure of the chromophore-binding domain of phytochrome. Nature. 2005;438:325–331. doi: 10.1038/nature04118. [DOI] [PubMed] [Google Scholar]
- 21.Ho YS, Burden LM, Hurley JH. Structure of the GAF domain, a ubiquitous signaling motif and a new class of cyclic GMP receptor. EMBO J. 2000;19:5288–5299. doi: 10.1093/emboj/19.20.5288. [DOI] [PMC free article] [PubMed] [Google Scholar]
- 22.Gong W, Hao B, Mansy SS, Gonzalez G, Gilles-Gonzalez MA, Chan MK. Structure of a biological oxygen sensor: a new mechanism for heme-driven signal transduction. Proc Natl Acad Sci U S A. 1998;95:15177–15182. doi: 10.1073/pnas.95.26.15177. [DOI] [PMC free article] [PubMed] [Google Scholar]
- 23.Miyatake H, Mukai M, Park SY, Adachi S, Tamura K, Nakamura H, Nakamura K, Tsuchiya T, Iizuka T, Shiro Y. Sensory mechanism of oxygen sensor FixL from Rhizobium meliloti: crystallographic, mutagenesis and resonance Raman spectroscopic studies. J Mol Biol. 2000;301:415–431. doi: 10.1006/jmbi.2000.3954. [DOI] [PubMed] [Google Scholar]
- 24.Hao B, Isaza C, Arndt J, Soltis M, Chan MK. Structure-based mechanism of O2 sensing and ligand discrimination by the FixL heme domain of Bradyrhizobium japonicum. Biochemistry. 2002;41:12952–12958. doi: 10.1021/bi020144l. [DOI] [PubMed] [Google Scholar]
- 25.Park H, Suquet C, Satterlee JD, Kang C. Insights into signal transduction involving PAS domain oxygen-sensing heme proteins from the x-ray crystal structure of Escherichia coli Dos heme domain (Ec DosH) Biochemistry. 2004;43:2738–2746. doi: 10.1021/bi035980p. [DOI] [PubMed] [Google Scholar]
- 26.Kurokawa H, Lee DS, Watanabe M, Sagami I, Mikami B, Raman CS, Shimizu T. A redox-controlled molecular switch revealed by the crystal structure of a bacterial heme PAS sensor. J Biol Chem. 2004;279:20186–20193. doi: 10.1074/jbc.M314199200. [DOI] [PubMed] [Google Scholar]
- 27.Otwinowski Z, Minor W. Processing of x-ray diffraction data collected in oscillation mode. Methods Enzymol. 1997;276:307–326. doi: 10.1016/S0076-6879(97)76066-X. [DOI] [PubMed] [Google Scholar]
- 28.Leslie AGW. Joint CCP4 ESF-EAMCB Newslett. Protein Crystallogr. Vol. 26 1992. [Google Scholar]
- 29.Holton J, Alber T. Automated protein crystal structure determination using ELVES. Proc Natl Acad Sci U S A. 2004;101:1537–1542. doi: 10.1073/pnas.0306241101. [DOI] [PMC free article] [PubMed] [Google Scholar]
- 30.Perrakis A, Morris R, Lamzin VS. Automated protein model building combined with iterative structure refinement. Nat Struct Biol. 1999;6:458–463. doi: 10.1038/8263. [DOI] [PubMed] [Google Scholar]
- 31.Terwilliger T. SOLVE and RESOLVE: automated structure solution, density modification and model building. J Synchrotron Radiat. 2004;11:49–52. doi: 10.1107/s0909049503023938. [DOI] [PubMed] [Google Scholar]
- 32.Emsley P, Cowtan K. Coot: model-building tools for molecular graphics. Acta Crystallogr D Biol Crystallogr. 2004;60:2126–2132. doi: 10.1107/S0907444904019158. [DOI] [PubMed] [Google Scholar]
- 33.Murshudov GN, Vagin AA, Dodson EJ. Refinement of macromolecular structures by the maximum-likelihood method. Acta Crystallogr D Biol Crystallogr. 1997;53:240–255. doi: 10.1107/S0907444996012255. [DOI] [PubMed] [Google Scholar]
- 34.Winn MD, Isupov MN, Murshudov GN. Use of TLS parameters to model anisotropic displacements in macromolecular refinement. Acta Crystallogr D Biol Crystallogr. 2001;57:122–133. doi: 10.1107/s0907444900014736. [DOI] [PubMed] [Google Scholar]
- 35.Brunger AT, Adams PD, Clore GM, Delano WL, Gros P, Grosse-Kunstleve RW, Jiang JS, Kuszewski J, Nilges M, Pannu NS. Crystallography and NMR system: a new software suite for macromolecular structure determination. Acta Crystallogr D. 1998;54:905–921. doi: 10.1107/s0907444998003254. [DOI] [PubMed] [Google Scholar]
- 36.Teng TY, Moffat K. Primary radiation damage of protein crystals by an intense synchrotron x-ray beam. J Synchrotron Radiat. 2000;7:313–317. doi: 10.1107/S0909049500008694. [DOI] [PubMed] [Google Scholar]
- 37.Ravelli RB, McSweeney SM. The ‘fingerprint’ that x-rays can leave on structures. Structure. 2000;8:315–328. doi: 10.1016/s0969-2126(00)00109-x. [DOI] [PubMed] [Google Scholar]
- 38.Burmeister WP. Structural changes in a cryo-cooled protein crystal owing to radiation damage. Acta Crystallogr D Biol Crystallogr. 2000;56:328–341. doi: 10.1107/s0907444999016261. [DOI] [PubMed] [Google Scholar]
- 39.Beitlich T, Kuhnel K, Schulze-Briese C, Shoeman RL, Schlichting I. Cryoradiolytic reduction of crystalline heme proteins: analysis by UV-Vis spectroscopy and x-ray crystallography. J Synchrotron Radiat. 2007;14:11–23. doi: 10.1107/S0909049506049806. [DOI] [PubMed] [Google Scholar]
- 40.Arcovito A, Moschetti T, D'Angelo P, Mancini G, Vallone B, Brunori M, Della Longa S. An x-ray diffraction and x-ray absorption spectroscopy joint study of neuroglobin. Arch Biochem Biophys. 2008 doi: 10.1016/j.abb.2008.03.026. in press. [DOI] [PubMed] [Google Scholar]
- 41.Martinez SE, Bruder S, Schultz A, Zheng N, Schultz JE, Beavo JA, Linder JU. Crystal structure of the tandem GAF domains from a cyanobacterial adenylyl cyclase: modes of ligand binding and dimerization. Proc Natl Acad Sci U S A. 2005;102:3082–3087. doi: 10.1073/pnas.0409913102. [DOI] [PMC free article] [PubMed] [Google Scholar]
- 42.Wagner JR, Zhang J, Brunzelle JS, Vierstra RD, Forest KT. High resolution structure of Deinococcus bacteriophytochrome yields new insights into phytochrome architecture and evolution. J Biol Chem. 2007;282:12298–12309. doi: 10.1074/jbc.M611824200. [DOI] [PubMed] [Google Scholar]
- 43.Gong W, Hao B, Chan MK. New mechanistic insights from structural studies of the oxygen-sensing domain of Bradyrhizobium japonicum FixL. Biochemistry. 2000;39:3955–3962. doi: 10.1021/bi992346w. [DOI] [PubMed] [Google Scholar]
- 44.Yukl ET, Ioanoviciu A, de Montellano PR, Moenne-Loccoz P. Interdomain interactions within the two-component heme-based sensor DevS from Mycobacterium tuberculosis. Biochemistry. 2007;46:9728–9736. doi: 10.1021/bi7008695. [DOI] [PubMed] [Google Scholar]
- 45.Tomita T, Gonzalez G, Chang AL, Ikeda-Saito M, Gilles-Gonzalez MA. A comparative resonance Raman analysis of heme-binding PAS domains: heme iron coordination structures of the BjFixL, AxPDEA1, EcDos, and MtDos proteins. Biochemistry. 2002;41:4819–4826. doi: 10.1021/bi0158831. [DOI] [PubMed] [Google Scholar]
- 46.Tamura K, Nakamura H, Tanaka Y, Oue S, Tsukamoto K, Nomura M, Tsuchiya T, Adachi S, Takahashi S, Iizuka T, Shiro Y. Nature of endogenous ligand binding to heme iron in oxygen sensor FixL. J Am Chem Soc. 1996;118:9434–9435. [Google Scholar]
- 47.Key J, Moffat K. Crystal structures of deoxy and CO-bound bjFixLH reveal details of ligand recognition and signaling. Biochemistry. 2005;44:4627–4635. doi: 10.1021/bi047942r. [DOI] [PubMed] [Google Scholar]
- 48.Minning DM, Gow AJ, Bonaventura J, Braun R, Dewhirst M, Goldberg DE, Stamler JS. Ascaris haemoglobin is a nitric oxide-activated ‘deoxygenase’. Nature. 1999;401:497–502. doi: 10.1038/46822. [DOI] [PubMed] [Google Scholar]
- 49.Milani M, Pesce A, Nardini M, Ouellet H, Ouellet Y, Dewilde S, Bocedi A, Ascenzi P, Guertin M, Moens L, Friedman JM, Wittenberg JB, Bolognesi M. Structural bases for heme binding and diatomic ligand recognition in truncated hemoglobins. J Inorg Biochem. 2005;99:97–109. doi: 10.1016/j.jinorgbio.2004.10.035. [DOI] [PubMed] [Google Scholar]
- 50.Couture M, Yeh SR, Wittenberg BA, Wittenberg JB, Ouellet Y, Rousseau DL, Guertin M. A cooperative oxygen-binding hemoglobin from Mycobacterium tuberculosis. Proc Natl Acad Sci U S A. 1999;96:11223–11228. doi: 10.1073/pnas.96.20.11223. [DOI] [PMC free article] [PubMed] [Google Scholar]
- 51.Ouellet Y, Milani M, Couture M, Bolognesi M, Guertin M. Ligand interactions in the distal heme pocket of Mycobacterium tuberculosis truncated hemoglobin N: roles of TyrB10 and GlnE11 residues. Biochemistry. 2006;45:8770–8781. doi: 10.1021/bi060112o. [DOI] [PubMed] [Google Scholar]
- 52.Tilton RF, Jr, Kuntz ID, Jr, Petsko GA. Cavities in proteins: structure of a metmyoglobin-xenon complex solved to 1.9 A. Biochemistry. 1984;23:2849–2857. doi: 10.1021/bi00308a002. [DOI] [PubMed] [Google Scholar]
- 53.Brunori M, Gibson QH. Cavities and packing defects in the structural dynamics of myoglobin. EMBO Rep. 2001;2:674–679. doi: 10.1093/embo-reports/kve159. [DOI] [PMC free article] [PubMed] [Google Scholar]
- 54.Scott EE, Gibson QH, Olson JS. Mapping the pathways for O2 entry into and exit from myoglobin. J Biol Chem. 2001;276:5177–5188. doi: 10.1074/jbc.M008282200. [DOI] [PubMed] [Google Scholar]
- 55.Srajer V, Ren Z, Teng TY, Schmidt M, Ursby T, Bourgeois D, Pradervand C, Schildkamp W, Wulff M, Moffat K. Protein conformational relaxation and ligand migration in myoglobin: a nanosecond to millisecond molecular movie from time-resolved Laue x-ray diffraction. Biochemistry. 2001;40:13802–13815. doi: 10.1021/bi010715u. [DOI] [PubMed] [Google Scholar]
- 56.Schotte F, Lim M, Jackson TA, Smirnov AV, Soman J, Olson JS, Phillips GN, Jr, Wulff M, Anfinrud PA. Watching a protein as it functions with 150-ps time-resolved x-ray crystallography. Science. 2003;300:1944–1947. doi: 10.1126/science.1078797. [DOI] [PubMed] [Google Scholar]
- 57.Gilles-Gonzalez MA, Gonzalez G. Heme-based sensors: defining characteristics, recent developments, and regulatory hypotheses. J Inorg Biochem. 2005;99:1–22. doi: 10.1016/j.jinorgbio.2004.11.006. [DOI] [PubMed] [Google Scholar]
- 58.Yukl ET, Ioanoviciu A, Nakano MM, Ortiz de Montellano PR, Moenne-Loccoz P. A distal tyrosine residue is required for exogenous ligand discrimination in DevS from Mycobacterium tuberculosis. parallel submission to Biochemistry. doi: 10.1021/bi801234w. [DOI] [PMC free article] [PubMed] [Google Scholar]
- 59.Smith RF, Wiese BA, Wojzynski MK, Davison DB, Worley KC. BCM Search Launcher-an integrated interface to molecular biology data base search and analysis services available on the World Wide Web. Genome Res. 1996;6:454–462. doi: 10.1101/gr.6.5.454. [DOI] [PubMed] [Google Scholar]
Associated Data
This section collects any data citations, data availability statements, or supplementary materials included in this article.
Supplementary Materials
Spectral characterization of GAFDosT (Figure 1S), GAFDosT x-ray induced photoreduction (Figure S2), and full-length multiple sequence alignments between putative two-component sensory protein-histidine kinases from different organisms (Figure S3). This material is available free of charge via the Internet at http:/pubs.acs.org