Abstract
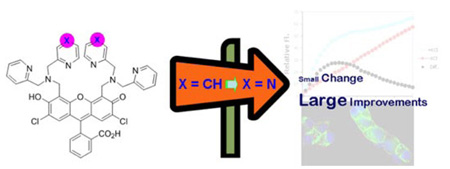
Substitution of one pyridine by pyrazine in each DPA appendage of ZP1, leads to a new zinc sensor, ZPP1, with a modified background fluorescence and zinc affinity. ZPP1 exhibits a two-step zinc response during fluorescence titrations, which leads to a new method for zinc quantification. The ability of ZPP1 to image and quantitate zinc was demonstrated in pancreatic Min6 cells.
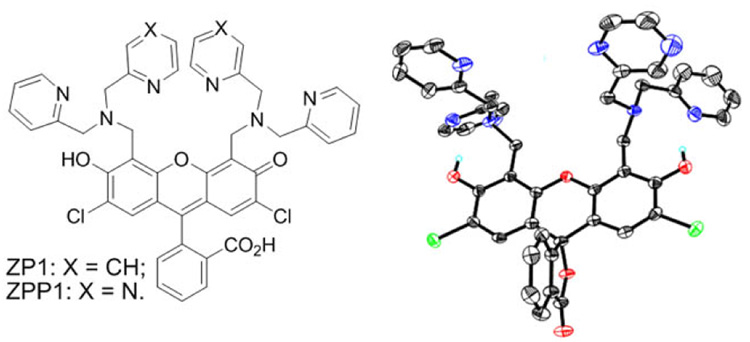
Mobile zinc ions both facilitate essential biological functions and mediate the pathophysiology of disease.1,2 An array of fluorescence sensors for mobile zinc(II) have been devised to help unravel these processes.3–6 No single sensor is universally suited for all zinc imaging studies, however. New sensors with modified chemical and photophysical properties are therefore in high demand, largely due to the variable concentrations, cellular locales, and organelle requirements for biological zinc. Sensors with different zinc affinities, lower background fluorescence, higher turn-on, and the ability to accurately quantitate zinc levels are desired, and a single sensor comprising several of the properties would be ideal. Here we report a new fluorescence sensor for mobile zinc, ZPP1, modified from our previously reported Zinpyr (ZP) family of zinc probes.7,8 ZPP1 exhibits lower background fluorescence and higher fluorescent turn-on when complexed with zinc, with lower apparent zinc affinity compared to its parent ZP1 (Chart 1). Most interestingly, ZPP1 exhibits distinct two-step fluorescence turn-on upon binding one vs. two equivalents of zinc, which can be utilized to quantify zinc via a novel protocol.
Chart 1.
ZP1 and ZPP1 (left) and X-ray structure (Supporting Information) of ZPP1 in its lactone form.
Our first-generation zinc sensor ZP1, although very bright, has relatively high background fluorescence and hence relatively low zinc turn-on due to protonation of the quenching units at physiological pH.9 The fluorescence of ZP1 increases by threefold upon zinc binding with an apparent affinity (Kd) in the sub-nM range.7 We anticipated that we could generate a new zinc sensor, ZPP1, with a lower pKa and zinc affinity by substituting one pyridine arm of ZP1 at each dipicolylamine (DPA) moiety with pyrazine, a stronger electron withdrawing group and weaker zinc-binding ligand (Chart 1). ZPP1 was synthesized in a manner analogous to that used for ZP1 by a Mannich reaction of 2’,7’-dichlorofluorescein (DCF) with 1-(pyrazin-2-yl)-N-(pyridin-2-ylmethyl)methanamine, which was obtained from coupling 2-picolylamine with (chloromethyl)pyrazine10 (Supporting Information). We confirmed the composition of ZPP1 by MS, NMR, UV-vis and fluorescence spectroscopy, and the structure by X-ray crystallography (Supporting Information).
The apo form of ZPP1 (5 µM) emits at 532 nm (λmax) upon excitation at 505 nm in pH 7 buffered solution (50 mM PIPES, 100 mM KCl). In its zinc-saturated state, the emission maximum of ZPP1 shifts to 523 nm. As for other members of the ZP family of sensors,3,9 protonation at the quenching units increases the fluorescence intensity of ZPP1 in a pH titration experiment (Figure S2), resulting in an apparent pKa value of 6.52, which is below physiological pH and significantly lower than that of ZP1. Accordingly, the background fluorescence of ZPP1 at physiological pH is almost seven times lower than that reported for ZP1 (Φapo = 0.38),7 with an observed quantum yield of 0.052. Hence, upon the addition of excess zinc, ZPP1 exhibits a significantly higher fluorescence increase (ΦZn = 0.70; ~13-fold turn-on) compared to ZP1. These results are similar to those obtained for ZP3, an earlier ZP1 derivative with a pKa value suppressed by introduction of electron withdrawing groups on the fluorophore.11 ZPP1, however, shows an even higher turn-on value than ZP3. ZPP1 also displays a good selectivity for zinc, similar to that of ZP1 and ZP3 (Figure S3). No fluorescence response occurs upon addition of Na+, K+, Mg2+ and Ca2+ to ZPP1, while divalent transition metals, such as Mn2+, Fe2+, Co2+, Ni2+ and Cu2+, quench the fluorescence.
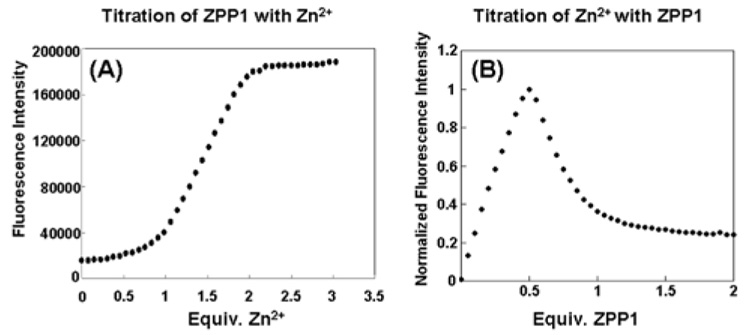
A remarkable property of ZPP1 was discovered in an experiment in which a constant amount of zinc chloride (5 µM) was titrated with ZPP1. As shown in Fig. 1B, there is a distinctive two-step fluorescence response upon addition of increasing amounts of ZPP1. The reason for this behavior is clear from Fig. 1A, in which zinc is added to ZPP1. Addition of up to 1 equiv of zinc results in only a slight fluorescence increase; addition of more than one equivalent leads to a significant, almost linear increase in fluorescence intensity that reaches its maximum near two equivalents. Since ZPP1 contains two apparent zinc-binding pockets, the following stepwise equilibria describe the binding events.
Figure 1.
Fluorescence response of ZPP1 (5µM) upon the addition of zinc (A) and fluorescence titration of Zn2+ (5 µM) upon stepwise addition of ZPP1 (B). Both experiments were performed in pH 7 PIPES buffer solution (50 mM) containing KCl (100 mM).
Mass balance⇌ equations corresponding to⇌ the above equilibria were solved by Newton-Raphson techniques using Excel software12 to compute the concentrations of individual species, which were subsequently used to fit the fluorescence titration data (Supporting Information). The experimental results agree well with the calculated values, and the fitting procedure returned two apparent association constants (K1app = 1.52×10¹¹ M−1, K2app = 1.02×10⁸ M−1) (Figure S5). Since most of the fluorescence increase occurs at the second zinc binding event, K2app should be considered as the apparent zinc affinity for fluorescence response, which is more than ten times lower than that of ZP1.7
We realized that the special zinc-response properties of ZPP1 offered a unique opportunity for zinc quantification. By fluorescence titration of a mobile zinc sample with ZPP1, we could determine the zinc concentration by measuring the concentration of sensor giving the maximum fluorescence response. This expectation was experimentally confirmed, as mentioned above and shown in Figure 1B. As predicted, titration of ZPP1 into a zinc solution first generated the highly fluorescent species ZPP1-Zn2, since excess zinc was available, generating an almost linear increase in fluorescence intensity at the beginning of the titration. When the concentration of ZPP1 reached half the concentration of total zinc ([ZPP1]total = 1/2 [Zn2+]total), the addition of more ZPP1 shifted the equilibrium to form ZPP1-Zn1 which is only weakly fluorescent. The fluorescence therefore decreased, even though more ZPP1 was added. At the sharp maximum point in the titration curve, the amount of ZPP1 added was equal to half of the total amount of zinc in solution, which allows for an accurate determination of mobile zinc concentration (Figure 1B). To the best of our knowledge, this type of quantification method has never been reported previously for zinc, and possibly for any other analyte.
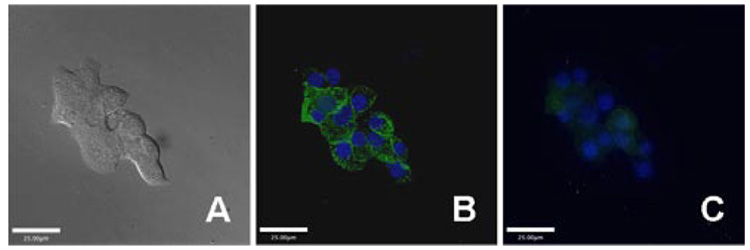
The properties of ZPP1 render it suitable for biological applications. To demonstrate the ability of ZPP1 as a fluorescent probe to image and quantitate endogenous zinc, we chose Min6, an insulinoma cell line that contains a relatively high concentration of mobile zinc packaged in insulin granules.13 Min6 cells were incubated with 20 µM ZPP1 overnight, although 2 h will suffice, and imaged using an inverted epifluorescence microscope. A vivid granule-like staining pattern localized mostly at the periphery of the cells, was observed, with bright spots consistent with zinc in the secretory granules. The bright fluorescence was quenched by addition of an excess of the membrane-permeant zinc chelator, N,N,N’,N’-tetra(2-picolyl)ethylenediamine (TPEN), consistent with fluorescence staining due to mobile zinc (Figure 2).
Figure 2.
Live Min6 cells were incubated with ZPP1 (green channel) and cell nuclei were stained with Hoechst 33258 (blue channel). (A): DIC image; and fluorescence images of (B) before and (C) after addition of TPEN. Bars are 25 µm.
Insulin release plays a major role in regulating blood-sugar levels,14 and the pancreatic granules can release insulin together with zinc upon stimulation.15 We next used ZPP1 to quantify zinc released from Min6 cells in response to high concentrations of extracellular glucose and KCl as stimuli. Min6 cells were grown in a T75 culture flask to ~ 90% confluence. Upon exposure to 20 mM glucose and 50 mM KCl, the cell medium (3 mL DMEM) was harvested and its zinc content was quantitated by ZPP1 titration as described above. The background fluorescence of free ZPP1 was subtracted from the titration curve, and the resulting plot exhibited a clear fluorescence maximum at 0.67 µM of ZPP1, revealing the concentration of released zinc to be 1.34 µM (Figure S6). Based on number of cells used in the experiment, we estimate that ~3.6 femtomoles of zinc on average were released per cell under these stimulation conditions. From the computed average cell volume of 4.5 pL (30 µm × 30 µm × 5 µm), we estimate the intracellular concentration of released zinc to be ~800 µM. This value is subject to errors in the estimated cell volume and will vary between intracellular compartments.
In conclusion, we have prepared a new zinc sensor, ZPP1, modified from the ZP sensor family by substitution of one pyridine by pyrazine at each DPA unit. ZPP1 exhibits low background fluorescence and hence a higher zinc-responsive fluorescence turn-on due to the lower pKa value of the quenching units compared to that of ZP1. ZPP1 exhibits a novel two-step fluorescence response toward zinc binding that can be applied to quantitate zinc concentration levels. ZPP1 selectively stains mobile zinc in the secretory granules of Min6 cells. Moreover, the amount of zinc released from these granules upon stimulation was quantified by ZPP1 using the newly discovered method. The advantages of incorporating pyrazine into the metal-binding units in this sensor can be generally applied to detect zinc, and possibly mercury and cadmium (Fig. S3), sensors as well. The detailed mechanism of stepwise zinc response by ZPP1 is under investigation.
Supplementary Material
Synthetic procedures, crystallographic details in CIF format, experimental details, and data fitting method. This material is available free of charge via the Internet at http://pubs.acs.org.
Acknowledgement
This work was supported by grant GM65519 from the National Institute of General Medical Sciences. X-a. Z. thanks the Swiss National Science Foundation and Roche Research Foundation for postdoctoral fellowship support. D. H. was supported by a Novartis UROP fellowship. Min6 cells were kindly provided by Dr. Andrey Kuznetsov from Prof. Louis Philipson’s laboratory at the University of Chicago. We thank Brian Wong for helpful comments on the manuscript and valuable discussion.
REFERENCES
- 1.Vallee BL, Falchuk KH. Physiol. Rev. 1993;73:79–118. doi: 10.1152/physrev.1993.73.1.79. [DOI] [PubMed] [Google Scholar]
- 2.Frederickson CJ, Koh J-Y, Bush AI. Nat. Rev. Neurosci. 2005;6:449–462. doi: 10.1038/nrn1671. [DOI] [PubMed] [Google Scholar]
- 3.Chang CJ, Lippard SJ. In: Neurodegenerative Diseases and Metal Ions. Sigel A, Sigel H, Sigel RKO, editors. Vol. 1. Chichester: John Wiley & Son, Ltd; 2006. pp. 321–370. [Google Scholar]
- 4.Jiang P, Guo Z. Coord. Chem. Rev. 2004;248:205–229. [Google Scholar]
- 5.Kikuchi K, Komatsu K, Nagano T. Curr. Opin. Chem. Biol. 2004;8:182–191. doi: 10.1016/j.cbpa.2004.02.007. [DOI] [PubMed] [Google Scholar]
- 6.Dai Z, Canary JW. New J. Chem. 2007;31:1708–1718. [Google Scholar]
- 7.Walkup GK, Burdette SC, Lippard SJ, Tsien RY. J. Am. Chem. Soc. 2000;122:5644–5645. doi: 10.1021/ja010059l. [DOI] [PubMed] [Google Scholar]
- 8.Burdette SC, Walkup GK, Spingler B, Tsien RY, Lippard SJ. J. Am. Chem. Soc. 2001;123:7831–7841. doi: 10.1021/ja010059l. [DOI] [PubMed] [Google Scholar]
- 9.Wong BA, Friedle S, Lippard SJ. Manuscript in preparation. [Google Scholar]
- 10.Abushanab E, Bindra AP, Goodman L, Petersen H., Jr J. Org. Chem. 1973;38:2049–2052. doi: 10.1021/jo00951a017. [DOI] [PubMed] [Google Scholar]
- 11.Chang CJ, Nolan EM, Jaworski J, Burdette SC, Sheng M, Lippard SJ. Chem. Bio. 2004;11:203–210. doi: 10.1016/j.chembiol.2004.01.017. [DOI] [PubMed] [Google Scholar]
- 12.Billo EJ. Excel for Chemists: a Comprehensive Guide. 2nd ed. New York: Wiley-VCH; 2001. [Google Scholar]
- 13.Priel T, Hershfinkel M. Biochem. Biophys. Res. Comm. 2006;346:205–212. doi: 10.1016/j.bbrc.2006.05.104. [DOI] [PubMed] [Google Scholar]
- 14.Taylor CG. Biometals. 2005;18:305–312. doi: 10.1007/s10534-005-3686-x. [DOI] [PubMed] [Google Scholar]
- 15.Gee KR, Zhou Z-L, Qian W-J, Kennedy R. J. Am. Chem. Soc. 2002;124:776–778. doi: 10.1021/ja011774y. [DOI] [PubMed] [Google Scholar]
Associated Data
This section collects any data citations, data availability statements, or supplementary materials included in this article.
Supplementary Materials
Synthetic procedures, crystallographic details in CIF format, experimental details, and data fitting method. This material is available free of charge via the Internet at http://pubs.acs.org.


