

Abstract
Background
The clinical use of the immunosuppressant calcineurin inhibitor cyclosporine is limited by its nephrotoxicity. This is enhanced when combined with the immunosuppressive mTOR inhibitor sirolimus. Nephrotoxicity of both drugs is not yet fully understood.
Methods
The goal was to gain more detailed mechanistic insights into the time-dependent effects of cyclosporine and sirolimus on the rat kidney by using a comprehensive approach including metabolic profiling in urine (1H-NMR spectroscopy), kidney histology, kidney function parameters in plasma, measurement of glomerular filtration rates, the oxidative stress marker 15-F2t-isoprostane in urine and immunosuppressant concentrations in blood and kidney. Male Wistar rats were treated with vehicle (controls), cyclosporine (10/25mg/kg/d) and/or sirolimus (1mg/kg/d) by oral gavage once daily for 6 and 28 days.
Results
Twenty-eight day treatment led to a decrease of glomerular filtration rates (cyclosporine -59%, sirolimus -25%). These were further decreased when both drugs were combined (-86%). Histology revealed tubular damage after treatment with cyclosporine, which was enhanced when sirolimus was added. No other part of the kidney was affected. 1H-NMR spectroscopy analysis of urine (day 6) revealed time-dependent changes of 2-oxoglutarate, citrate and succinate concentrations. In combination with increased urine isoprostane concentrations these changes indicated oxidative stress. After 28 days of cyclosporine treatment, urine metabonomics shifted to patterns typical for proximal tubular damage with reduction of Krebs cycle intermediates and trimethylamine-N-oxide concentrations whereas acetate, lactate, trimethylamine and glucose concentrations increased. Again, sirolimus enhanced these negative effects.
Conclusions
Our results indicate that cyclosporine and/or sirolimus induce damage of the renal tubular system. This is reflected by urine metabolite patterns, which seem to be more sensitive than currently used clinical kidney function markers such as creatinine concentrations in serum. Metabolic profiling in urine may provide the basis for the development of toxicodynamic monitoring strategies for immunosuppressant nephrotoxicity.
Keywords: Cyclosporine, Sirolimus, nephrotoxicity, metabonomics, urine molecular markers
Introduction
Three decades ago, the introduction of the immunosuppressant calcineurin inhibitor cyclosporine revolutionized transplantation medicine and established transplantation as a feasible treatment option for patients with end-stage organ failure. Today calcineurin inhibitors remain a cornerstone of the prophylaxis against allograft rejection (1, 2). Although in the past, due to their success in preventing rejection, toxicity of calcineurin inhibitors has largely been accepted. Attention has now increasingly focused on the fact that long-term use of calcineurin inhibitors such as cyclosporine is associated with a high risk of complications that can significantly compromise graft and patient survival (3). Acute and chronic toxicities include hypertension, diabetes, neurotoxicity (tremors and seizures) and renal dysfunction (4).
After kidney transplantation, calcineurin inhibitors contribute to chronic allograft nephropathy and have been identified as an independent risk factor and the major cause for late graft loss and increased patient mortality (5, 6). Although the underlying molecular mechanisms are not yet completely understood, cyclosporine toxicity involves oxidative stress, apoptosis, metabolic changes (7, 8) and an increase in vascular resistance resulting in decreased renal blood flow (9).
An attractive concept for reducing the prevalence of cyclosporine toxicity is its combination with other drugs that have additive or synergistic immunosuppressive activity and thus allow for lowering cyclosporine doses. In clinical trials, proliferation signal inhibitors such as sirolimus in combination with cyclosporine reduced the rate of acute rejection to less than 10%. This is despite markedly reduced exposures to both combination partners compared to the doses required for each agent alone to maintain clinical efficacy (10). The synergistic immunosuppressive activities of both drugs may be explained by the inhibition of subsequent steps in the activation and proliferation of T-lymphocytes. While cyclosporine blocks the progression of T-lymphocytes during the G0 to G1 transition of the cell cycle, sirolimus inhibits the mammalian target of rapamycin (mTOR), thereby blocking both the co-stimulation cascade, which augments interleukin-2 gene subscription during G0 to G1 progression, and the cytokine transduction pathway during the late G1 phase (11). As shown in clinical trials, when used without cyclosporine, sirolimus seems to lack nephrotoxicity (12, 13). However, there is some evidence that sirolimus may prolong kidney recovery and extend delayed graft function after ischemia/reperfusion injury (14, 15) by a mechanism that involves enhanced necrosis, apoptosis and decreased proliferation of renal tubular cells (16).
Although combing sirolimus with cyclosporine significantly reduces the incidence of acute rejection, in the long term, sirolimus enhances the negative effects of cyclosporine on the kidney and increases creatinine serum concentrations (17-20). Since both drugs share pharmacokinetic pathways involving cytochrome P450 3A enzymes and are substrates of the same drug transporters such as p-glycoprotein, this effect can partially be explained by pharmacokinetic drug-drug interactions (19). In addition, there is evidence for toxicodynamic interactions (7).
Chronic immunosuppressant nephrotoxicity not only plays a key role in chronic nephropathy after kidney transplantation, it is also a major source for kidney dysfunction following transplantation of non-renal solid organs such as the liver, heart and small intestine (2). While acute immunosuppressant toxicity is usually associated with increased drug exposure and can reliably be detected, diagnosis of chronic toxicity is more challenging (21). The development of more sensitive diagnostic tools is warranted (22). The key to reduce or avoid the negative effects of chronic rejection and immunosuppressant toxicity is early detection (6). Once detected, damage by chronic rejection can be reduced by immunological intervention and, in the case of immunosuppressant toxicity, by modification of the immunosuppressive drug regimen. An attractive strategy is the identification of early metabolic changes in the transplant organ, blood or urine as molecular “signatures”. In contrast to protein expression or histology changes, which take place over days or weeks, monitoring metabolic changes may allow for detection of an immediate response of immunological kidney damage and/or immunosuppressant toxicity (21, 23, 24). For the development of novel diagnostic strategies, a detailed understanding of the molecular mechanisms of the negative effects of cyclosporine alone and in combination with sirolimus is critical. The idea of using metabolic profiling to describe the effects of cyclosporine in the kidney is not new (23, 25). The only other study that has evaluated the negative effect of immunosuppressants on urine metabolite patterns was focused on cyclosporine only and used high doses of 45mg/kg/d (25).
It is the goal of the present study to gain more detailed insights into the time-dependent effects of cyclosporine and sirolimus alone and in combination on the rat kidney and into the underlying molecular mechanisms by using a more comprehensive approach that included molecular, histological and pathological parameters indicative for kidney dysfunction. Also, based on our own pilot studies, we used cyclosporine and sirolimus doses that were known to result in blood concentrations close to those found in transplant patients after oral dosing. These doses were given over an extended time period of 28 days. The reason for this study design was to avoid the triggering of acute toxicity and cell death, and to characterize the effects of long-term exposure on the biochemistry of the kidney as reflected in urine. This dosing better simulates clinical reality, as well as avoiding confounding biochemical effects caused by salt depletion as is applied in most rat studies of immunosuppressant nephrotoxicity (26).
Since current clinical markers used to monitor nephrotoxicity such as serum creatinine fail to discriminate patients at risk early (6), metabolic profiling in urine may provide the basis for the development of toxicodynamic drug monitoring strategies. This could help to identify at-risk patients earlier and allow for kidney rescue therapies to commence before structural damage occurs (24). Such new strategies could facilitate improved individualization of immunosuppressive therapy.
Material and Methods
Animals
All animal protocols were approved by the University of Colorado Internal Animal Care and Use Committee in accordance with the National Institutes of Health guidelines (NIH publication No. 80-123). Ten- to fourteen-week-old male rats (Wistar Furth), weighing 280 to 330g, obtained from Charles River Labs (Wilmington, MA), were housed in a temperature and light controlled environment with access to tap water and food ad libitum. After at least two weeks of acclimatization, immunosuppressant treatment commenced.
Drugs
Commercial oral drinking solutions of cyclosporine (Neoral®, Novartis Pharma S.A., East Hanover, NJ) and sirolimus (Rapamune, Wyeth-Ayerst, Princeton, NJ) were administered by daily oral gavage in a constant volume for 6 or 28 days, depending on group assignments. Sirolimus was administered in the unmodified formulation (1 mg/mL). Neoral® formulation was diluted in skim milk (1:10) to a final concentration of 10 mg/mL.
Experimental Groups
Sixty rats were randomly assigned to nine treatment groups (n=6/group):
| (I) | vehicle controls | (skim milk for 6/28 days) |
| (II) | cyclosporine | 10 mg/kg/day for 6 days |
| (III) | cyclosporine | 25 mg/kg/day for 6 days |
| (IV) | sirolimus | 1 mg/kg/d for 6 days |
| (V) | cyclosporine | 10 mg/kg/day + sirolimus 1 mg/kg/day for 6 days |
| (VI) | cyclosporine | 25 mg/kg/day + sirolimus 1 mg/kg/day for 6 days |
| (VII) | cyclosporine | 10 mg/kg/day for 28 days |
| (VIII) | sirolimus | 1 mg/kg/d for 28 days |
| (IX) | cyclosporine | 10 mg/kg/day + sirolimus 1 mg/kg/day for 28 days |
Experimental design
All drug doses were based on systematic dose finding studies during the development of the rat model, the goal of which was to achieve drug blood concentrations within limits that are reached in patients. Groups receiving twenty-five mg/kg/day cyclosporine were not included when long-term treatment effects were studied since a pilot study had shown that this dose in combination with 1 mg/kg/day sirolimus was associated with mortality of more than 50%.
Previous studies had shown that there still may be age-related differences in urine metabolite patterns in rats at the age used in the present study (27, 28). To minimize an age-related bias, rats were randomly assigned to the treatment and control groups.
On day 5 or 27, rats were placed in metabolic cages for 24h-urine collections. On the final day (6 or 28), two hours after receiving the final drug doses, animals were prepared for clearance measurements as described below. Animals were sacrificed to collect kidneys for histology and measurement of tissue drug concentrations, and whole blood for the determination of sirolimus/cyclosporine concentrations. Plasma analysis for creatinine and blood urea nitrogen (BUN) and urine analysis for creatinine was performed by the University of Colorado Hospital Laboratory (Director: Dr. R. Lepoff) using validated standard methods.
Twenty-four hour urine collections always bear the potential risk of secondary bacterial contamination that may lead to “after-the-fact” changes of metabolite concentrations in urine samples. Urine was collected into sterilized containers. The collection method had been validated in a previous study excluding significant contamination demonstrating that NMR metabolite spectra were identical when urine was extracted immediately versus after storage in a sterilized collection container after 24 hours. The lack of bacterial contamination was further confirmed by bacteriological and biochemical methods.
Renal Function
Renal function was determined using the fluorescein isothiocyanate (FITC)-inuline method (29, 30). Two hours after the final drug dosing, rats were placed on a thermostatically controlled surgical table and anesthetized by i.p. injection of ketamine (50mg/kg)/xylazine (10mg/kg) (KetaVed™/TranquiVed™,Vedco Inc., St.Joseph, MO). A 10-0 silicone catheter was inserted into the jugular vein for maintenance infusion. After injecting 2mL of normal saline to provide sufficient intravasal volume, diluted (FITC)-inuline (Sigma, St. Louis, MO) (0.75mg/100mL saline) plus albumin (2.25 g/ 100 mL saline) were administered via perfusion pump for 2 hours at a rate of 2mL/h as previously described by Lorenz and Gruenstein (30). To monitor blood pressure throughout the experiment, a pressure transducer catheter (Millar Instruments, Houston, TX) was inserted into the carotid artery. After 1.5 hours of inuline infusion, a median laparotomy was performed, and a 10-0 silicone catheter was inserted into the left ureter. Urine was collected for 0.5 hours, and rats were sacrificed thereafter. Inuline concentration in plasma and urine was determined by fluorescence spectroscopy (Perseptive Biosystems Cytoflour Series 4000). GFR values (μl/min) were calculated using the formula (UxV/P,) were U equals inuline concentration in urine, V is urine output over time and P is inuline concentration in plasma. For a baseline correction, blank control plasma and urine samples were loaded with different concentrations of inuline and fluorescence absorption was obtained.
Drug concentration measurements
All drug concentrations were determined 4 hours after last dosing, when animals were sacrificed following renal clearance function measurements. For cyclosporine/sirolimus measurements, whole blood samples (500 μL) were collected in heparinized tubes. Flash-frozen renal tissue (100 to 200mg) was mortared in liquid nitrogen and homogenized with 2 mL KH2PO4 buffer (pH 7.4). For protein precipitation, 800 μL methanol and 0.2 mmol/L ZnSO4 (80/20, v/v) were added to 200 μL of tissue/blood suspension. Cyclosporin D (250 μg/L, Novartis Pharma AG, Basel, Switzerland) was added as an internal standard for cyclosporine derivates and ascomycin (Sigma-Aldrich, St. Louis, MO) as an internal standard for sirolimus (7). After centrifugation (13,000g, 5 min, 4°C), 100 μL of the supernatant was injected into the HPLC system onto the extraction column. Cyclosporine and sirolimus were quantified using a validated HPLC-MS assay (7).
Histology
For hematoxylin and eosin (H.E.) staining, kidney tissue samples were fixed in 10% buffered formaldehyde and embedded in paraffin, incubated for 5 minutes in Harris hematoxylin solution and for 60 seconds in eosin solution. Sections were washed with plain water, differentiated in 1% hydrochloric acid (HCl)+50% ethanol, and stain intensity was optimized in ammonia water. Finally, sections were rinsed in 70% ethyl alcohol and dehydrated in xylene solution.
Semi-quantitative scoring system
Evaluation of kidney histology was carried out in a blinded manner. Histologies were graded in regards to their tubular epithelial aspects, glomerular and vascular alterations in 10 to 15 randomly selected non-overlapping fields (x220) per rat on H.E. stains according to criteria published by Lombardi et al. (31). Tubular injury (TI) was graded (0 to 3) based on the presence dilation, atrophy, interstitional widening and presence of vacuolization. Glomerular injury (GI) was graded (0 to 3) for cellularity and capillary tuft collapse (percentage of glomeruli) as a marker for glomerular ischemia and damage. Renal arterioli were evaluated with respect to the presence of hyalinosis or thrombosis (0/1).
1H NMR Spectroscopy
1H-NMR urine analysis was performed using a Varian INOVA NMR 600MHz spectrometer equipped with a 5-mm HCN-PFG probe. Five hundred and fifty μL of urine were buffered with 73μL of 0.2mol/L potassium phosphate buffer in D2O prior to analysis. The pH was finally adjusted to 5.65 - 5.75 with NaOD and DCl. To suppress water in urine, a standard Varian pre-saturation sequence was used. 1H-NMR spectra were obtained at 600 MHz using a spectral width of 12 ppm and 32K data arrays, and 64 scans with 90° flip angle. A D1 time of 14.8 seconds was used which was required to fully relax all protons in the samples including the TMSP (trimethylsilyl propionic-2,2,3,3,-d4 acid dissolved in D2O to 50mmol/L) protons. Analysis of NMR data was performed using the MesTreC software version 4.4.1.0 (MesTreLab Research, Coruna, Spain). Drift correction, zero filling from 32K to 64K data points and a Gaussian window function were applied to the FID prior to Fourrier transformation. Spectra were referred to TMSP (0ppm) as an external standard. Prior to integration, all 1H NMR spectra were manually corrected for phase and baseline distortions. Because of different overall urine concentrations, all spectra were normalized so that the total area of each urine spectrum reached the same value (32, 33).
15-F2t-Isoprostane (previous nomenclature: 8-iso-prostaglandin-F2α)
Urine samples were analyzed using a validated LC/LC-MS/MS method (34). The HPLC system consisted of Agilent series 1100 components (Santa Clara, CA) and was set up similar to that used for quantification of immunosuppressant concentrations (7). It was interfaced with a triple quadrupole mass spectrometer (API5000, Applied Biosystems, Foster City, CA) run in negative multiple reaction monitoring (MRM) mode. Peak area ratios obtained from MRM mode of the mass transitions for 15-F2t-isoprostane (m/z 353 → 193) and the internal standard 15-F2t-isoprostane-d4 (m/z 357 → 197) were used for quantification.
Statistical analysis
All numerical data are presented as mean ± standard deviation. One-way analysis of variance (ANOVA) followed by the least significant difference (LSD) method was used to determine group differences. Additional group comparison was performed using post-hoc Holm-Sidak analysis. The significance level was set at p<0.05 for all tests. As mentioned above, each experimental group consisted of six animals. Software used were SigmaPlot (version 9.01) and SigmaStat (version 3.11) both by Systat Software, Point Richmond, CA, USA.
Results
Physiological changes (Table 1)
Table 1.
Changes in blood urea nitrogen, blood creatinine and body weight in the different treatment groups (all values are means ± standard deviations), n=6/group, one-way ANOVA among groups: p<0.001 for each parameter
| blood creatinine [mg/dL] | blood urea nitrogen [mg/dL] | body weight [% change over treatment time] | ||
|---|---|---|---|---|
| control | 0.4±0.1 | 17±3 | 7±1 (day6) 27±3 (day28) | |
| 6 days | CsA10 | 0.8±0.0 | 17±2 | 8±4 |
| CsA25 | 1.0±0.1* | 25±5 | 1±3* | |
| Rapa1 | 0.4±0.1 | 16±4 | 9±5 | |
| CsA10/Rapa1 | 0.8±0.5 | 48±31* | -7±3* | |
| CsA25/Rapa1 | 1.8±0.9* | 86±26* | -11±5* | |
| 28 days | CsA10 | 0.7±0.1 | 34±6 | 36±5* |
| Rap1 | 0.6±0.1 | 19±1 | 23±12 | |
| CsA10/Rapa1 | 0.8±0.2 | 42±13* | 4±7* | |
significant compared to untreated controls using a post-hoc pairwise multiple comparison (Holm-Sidak method).
Healthy control rats showed a weight gain of 7 ± 1% after 6 days. In contrast, rats treated with a combination of cyclosporine (10 or 25 mg/kg/day) and 1 mg/kg/day sirolimus for 6 days had a significant weight loss of -7 ± 3% and -11 ± 5%, respectively. The long-term combination treatment group that received 10 mg/kg/day cyclosporine plus 1 mg/kg/day sirolimus had a significantly lower weight gain (4 ± 7%) compared to untreated controls (27 ± 3% after 28 days) whereas a single treatment with either sirolimus or cyclosporine alone for 28 days had no negative effect on weight gain.
Serum creatinine and blood urea nitrogen concentrations (Table 1)
All cyclosporine-treated rats showed at least a trend towards higher serum creatinine concentrations compared to controls but there was no difference between days 6 and 28. Serum creatinine concentrations were significantly higher than in the vehicle control group when rats were treated with a combination of 25 mg/kg/day cyclosporine and 1 mg/kg/day sirolimus for 6 days (1.8±0.9 versus control: 0.4±0.1mg/dL, p<0.001). Sirolimus alone did not significantly increase serum creatinine concentrations after 6 or 28 days. Changes observed in serum creatinine concentrations were accompanied by similar changes in blood urea nitrogen concentrations. Overall, the time-dependent differences between days 6 and 28 that were observed for fluorescein isothiocyanate inuline clearance, kidney histology and urine metabolite patterns (vide infra) were not reflected by creatinine in serum or blood urea nitrogen concentrations.
Glomerular filtration rates (Figure 1)
Figure 1.

Change in glomerular filtration rates (GFR) in the different treatment groups (all GFR values corrected for animal body weight and presented as means + standard deviations (n=6/group)), differences between groups was significant at p<0.001 (one-way ANOVA) *significant compared to untreated controls using a post-hoc pairwise multiple comparison (Holm-Sidak method).
Groups: con: vehicle-treated controls, CsA10: 10 mg/kg/day cyclosporine, CsA25: 25 mg/kg/day cyclosporine, Rapa1: 1 mg/kg/day sirolimus, CsA10/Rapa1: co-administration of 10 mg/ kg/ day cyclosporine and 1 mg/kg/day sirolimus, CsA25/Rapa1: co-administration of 25 mg/kg/day cyclosporine and 1 mg/kg/day sirolimus.
Interestingly, compared to inuline clearance rates in controls (358±132μL/min/100g body weight), sirolimus (1mg/kg/day) also slightly reduced glomerular filtration rates after 6 and 28 days. Cyclosporine treatment had a more significant effect than sirolimus, resulting in glomerular filtration rates of 96±37μL/min/100g body weight (10mg/kg/day) and 88± 77μL/min/100g body weight (25mg/kg/day) after 6 days. The most severe reduction of inuline clearance was seen after long-term (28-day) treatment with a combination of 10 mg/kg/day cyclosporine and 1 mg/kg/day sirolimus (50± 48μL/ min/100g body weight).
Histology
After 6 days of treatment, none of the treatment groups revealed histological alterations to their kidney compared to vehicle-treated controls (results not shown). However, after 28 days of treatment, in the rats treated with cyclosporine, sirolimus or a combination of both, morphologic alterations were clearly seen that were mainly focused on the tubuli. Glomeruli and arterioli in these groups were again not different from control animals, and there was no evidence for necrosis or fibrosis.
After 28 days of combined cyclosporine/sirolimus treatment (Figure 2D), kidney cortex morphology displayed the most extensive changes seen as patchy alterations (inhomogeneous damage), which was the result of severe shrinking of the proximal tubular cytoplasm and atrophy plus luminal dilation of the distal tubular system in large parts (score 2+ to 3). Treatment with cyclosporine alone led to macro- and microvesicular tubular epithelial vacuolization (scores 2- to 2+) that was not seen in controls but had hardly any impact on tubular cell morphology (0 to 1) (Figure 2C). In rats treated with sirolimus alone, tubular damage was observed to a lesser degree than in the combined groups especially with a lesser degree of tubular cell vacuolization but with severe aspects of tubular epithelial atrophy (score 2+) (Figure 2B). In summary, the combination of 10 mg/kg cyclosporine and 1 mg/kg sirolimus for 28 days resulted in morphologic changes in the kidney that were the most severe with its main emphasis on the tubular system. In comparison, cyclosporine alone mainly induced tubular vacuolization and the main effect of sirolimus treatment was tubular atrophy.
Figure 2.
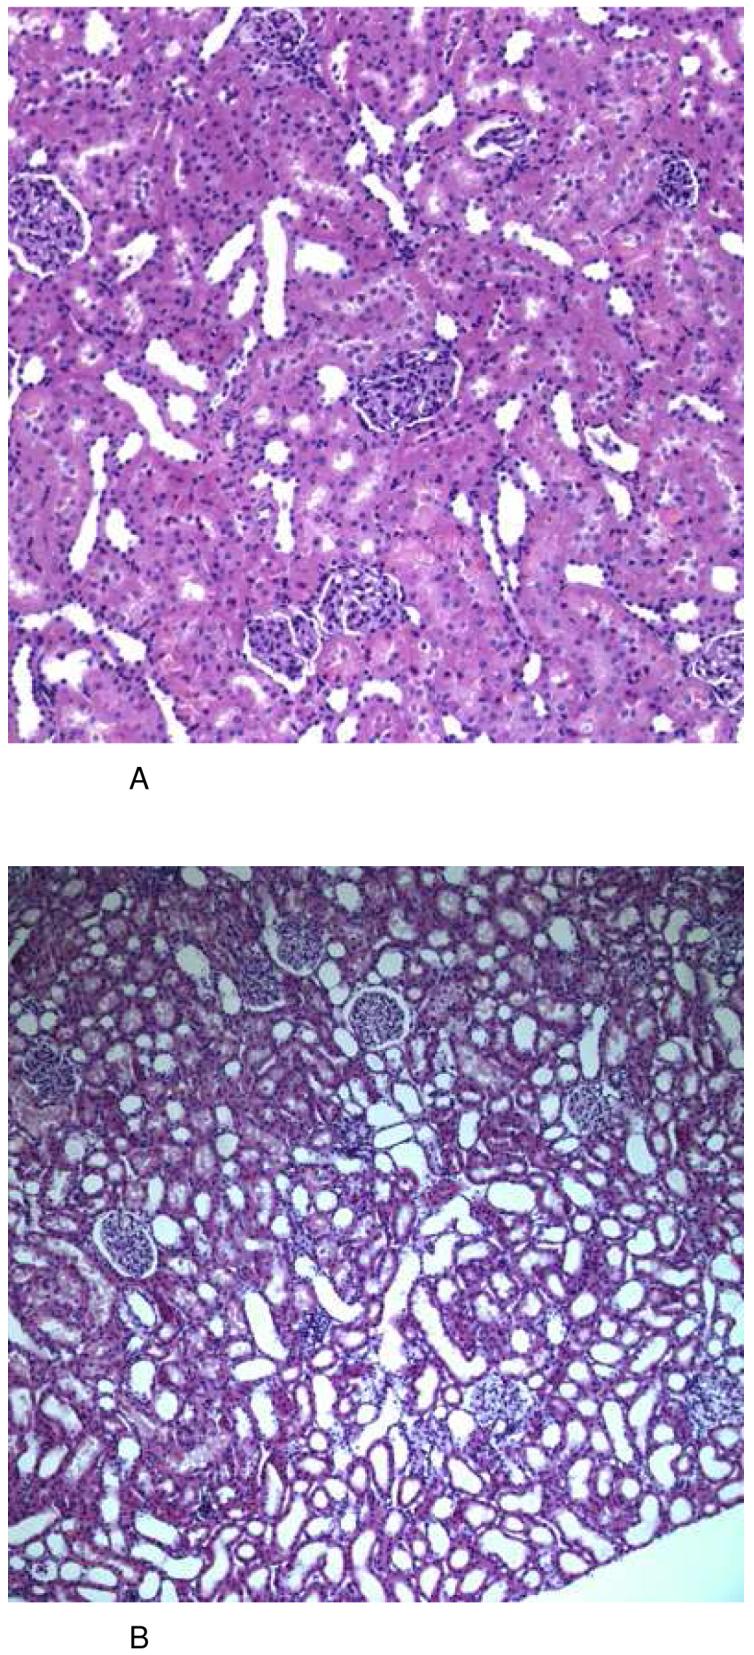
Representative histology (HE stain) of kidney tissues from the different treatment groups at day 28 (total number of tissue samples evaluated: n=6/ treatment group, all histologies (A-C): magnification 10×22, (D): magnification 20×22).
After 6 days of treatment, none of the groups revealed any significant histological changes in comparison to kidneys from vehicle-treated controls (A). After treatment with sirolimus (1 mg/kg/day), kidneys revealed alterations of the tubular system appearing as severe atrophy and dilation. These changes were reproducible and clearly detectable in every animal (B). Following long-term treatment with cyclosporine (10 mg/kg/day), kidneys showed a patchy alteration caused again by mild tubular atrophy (shrinking of the proximal tubular cytoplasm) plus atrophy and luminal dilation of the distal tubulus system. As another typical finding, there was a most significant presence of micro- and macrovesicular occlusion bodies in almost all tubular epithelial cells (C). These changes were similar and much more pronounced in the group receiving a combination treatment protocol of sirolimus and cyclosporine (D).
Groups: con: vehicle-treated controls, CsA10: 10 mg/kg/day cyclosporine, CsA25: 25 mg/kg/day cyclosporine, Rapa1: 1 mg/kg/day sirolimus, CsA10/Rapa1: co-administration of 10 mg/ kg/ day cyclosporine and 1 mg/kg/day sirolimus, CsA25/Rapa1: co-administration of 25 mg/kg/day cyclosporine and 1 mg/kg/day sirolimus.
Blood and tissue drug concentrations (Figure 3)
Figure 3. Blood and kidney tissue concentrations of cyclosporine and sirolimus 4 hours after the last dose.


A) cyclosporine blood concentrations 4 hours after the last dose (all concentrations are presented as means + standard deviations (p=0.031); B) sirolimus blood concentrations 4 hours after the last dose (p<0.001); C) cyclosporine kidney tissue concentrations (p<0.001); D) sirolimus kidney tissue concentrations (p<0.001), all groups n=6, group comparison by one-way ANOVA
Groups: con: vehicle-treated controls, CsA10: 10 mg/kg/day cyclosporine, CsA25: 25 mg/kg/day cyclosporine, Rapa1: 1 mg/kg/day sirolimus, CsA10/Rapa1: co-administration of 10 mg/ kg/ day cyclosporine and 1 mg/kg/day sirolimus, CsA25/Rapa1: co-administration of 25 mg/kg/day cyclosporine and 1 mg/kg/day sirolimus.
Although cyclosporine blood concentrations basically remained unaffected when cyclosporine and sirolimus were co-administered (Figure 3A), cyclosporine drug concentrations within the kidney were significantly increased after 6 days. This interaction was less pronounced after 28 days (Figure 3C). Co-administration of cyclosporine significantly increased sirolimus blood concentrations after 6 and 28 days (Figure 3B). Also, sirolimus tissue concentrations were several-fold higher in the presence than in the absence of cyclosporine:1 mg/kg/day sirolimus for 6 days: sirolimus kidney tissue concentration: 0.3± 0.1ng/mg wet weight, after 28 days: 0.1± 0.002ng/mg; sirolimus +10mg/kg/day cyclosporine: 4.3-fold increase of tissue sirolimus concentrations, sirolimus +25 mg/kg/day cyclosporine: 6.3-fold increase (all after 6 days); +10 mg/kg/day cyclosporine (28 days): 7-fold increase (Figure 3 D).
15-F2t-isoprostane concentrations in urine (Figure 4)
Figure 4. 15-F2t-Isoprostane concentrations in urine after 6 and 28 days of treatment.

All concentrations were normalized to urine creatinine concentration to compensate for differences in urine concentrations and are shown as means + standard deviations (n=6 for all groups). Group comparison (one-way ANOVA) failed to show statistically significant differences (p=0.054).
Groups: con: vehicle-treated controls, CsA10: 10 mg/kg/day cyclosporine, CsA25: 25 mg/kg/day cyclosporine, Rapa1: 1 mg/kg/day sirolimus, CsA10/Rapa1: co-administration of 10 mg/ kg/ day cyclosporine and 1 mg/kg/day sirolimus, CsA25/Rapa1: co-administration of 25 mg/kg/day cyclosporine and 1 mg/kg/day sirolimus.
Compared to untreated controls, 15-F2t-isoprostanes showed a tendency of higher concentrations in urine (one-way ANOVA: p=0.054). Highest 15-F2t-isoprostanes concentrations in urine (normalized based on creatinine concentrations) were observed after treatment with sirolimus alone and when sirolimus and cyclosporine were co-administered for 6 days (mean concentrations 6 to 10-fold higher than vehicle-treated controls). After 28 days, 15-F2t-isoprostanes concentrations tended to be lower than in corresponding treatment groups after 6 days.
Metabolite patterns in urine as assessed by 1H NMR spectroscopy (Figures 5-8)
Figure 5. Changes in urine metabolite patterns after 6 days of treatment.

The pattern changes observed matched those typically associated with free radical formation (58), (all urine metabolites determined semi-quantitatively by 1H-NMR, all values were normalized based on the total integral and are presented as means + standard deviations (n=6 for all groups), group comparison by one-way ANOVA, *significance levels estimated using a post-hoc pairwise multiple comparison (Holm-Sidak method).
Groups: con: vehicle-treated controls, CsA10: 10 mg/kg/day cyclosporine, CsA25: 25 mg/kg/day cyclosporine, Rapa1: 1 mg/kg/day sirolimus, CsA10/Rapa1: co-administration of 10 mg/ kg/ day cyclosporine and 1 mg/kg/day sirolimus, CsA25/Rapa1: co-administration of 25 mg/kg/day cyclosporine and 1 mg/kg/day sirolimus.
Figure 8. Representative 1H-NMR spectra (aliphatic region) of urine extracts after treatment for 28 days.

The total number of urine samples evaluated for each group was n=6. Signal assignments: 1 drug vehicle compounds, 2 lactate, 3 alanine, 4 acetate, 5 succinate, 6 2-oxoglutarate, 7 citrate, 8 dimethylamine, 9 trimethylamine, 10 dimethyl glycine, 11 creatine, 12a/b creatinine, 13 trimethylamine oxide, 14 taurine, 15 hippurate, 16 α-glucose.
Groups: con: vehicle-treated controls, CsA10: 10 mg/kg/day cyclosporine, CsA25: 25 mg/kg/day cyclosporine, Rapa1: 1 mg/kg/day sirolimus, CsA10/Rapa1: co-administration of 10 mg/ kg/ day cyclosporine and 1 mg/kg/day sirolimus, CsA25/Rapa1: co-administration of 25 mg/kg/day cyclosporine and 1 mg/kg/day sirolimus.
Following 6 days of treatment, changes in the biochemical profiles of urine were generally less pronounced and exhibited higher standard deviations than after the 28-day treatment. Changes observed in urine metabolite 1H NMR spectra compared to controls after 6 days of treatment were reduced concentrations of citrate, succinate and 2-oxoglutarate (only statistically significant when 10 mg/kg/day cyclosporine and 1 mg/kg/day sirolimus were co-administered) and increased concentrations of lactate, acetate, creatine, trimethylamine (TMA), and hippurate (Figure 5). Also, concentrations of trimethylamine-N-oxide (TMAO) in urine were found to be elevated in the groups treated with sirolimus for 6 days, but not in those rats receiving cyclosporine alone. Treatment with cyclosporine or cyclosporine in combination with sirolimus displayed not only more extensive negative effects on the kidney after 28 than after 6 days but also time-dependent differences in the metabolite patterns. Compared to untreated controls, concentrations of glucose (control =sirolimus <cyclosporine <<cyclosporine+sirolimus) and lactate (control <sirolimus <cyclosporine <<cyclosporine+sirolimus) significantly increased (Figures 6 and 7). The same applied for acetate concentrations (control <<sirolimus =cyclosporine =cyclosporine+ sirolimus) (Figure 6). Creatinine, hippurate, as well as key metabolites of the Krebs cycle including citrate and 2-oxoglutarate (2-OG), were significantly decreased (creatinine: control =sirolimus =cyclosporine >>cyclosporine +sirolimus; hippurate: control >>sirolimus =cyclosporine =cyclosporine+ sirolimus; citrate: control >sirolimus >cyclosporine >>cyclosporine+ sirolimus; 2-oxoglutarate: control =cyclosporine >sirolimus =cyclosporine+ sirolimus) (Figure 6). TMAO significantly decreased (control >>sirolimus =cyclosporine =cyclosporine+ sirolimus) whereas TMA increased in all groups compared to the controls (control <cyclosporine <cyclosporine+ sirolimus <<sirolimus) (Figure 7). Changes in succinate concentrations did not change with statistical significance but there was a trend towards lower concentrations in rats treated with sirolimus and cyclosporine+ sirolimus compared to the controls (Figure 6). Figures 8 and 9 show representative series of 1H NMR spectra (day 28) from the urine of treated and control animals. It must be noted that these spectra show ethanol signals, however, only in the animals that received cyclosporine and/or sirolimus and not in the control animals that received only skim milk. The drug formulations are the most probable source. The presence of ethanol in the drug formulations was confirmed by analysis of diluted samples of the formulations using NMR spectroscopy. As mentioned above, bacterial contamination is another potential source of alcohols that cannot completely be excluded. The fact that ethanol was only detected in spectra of animals that received the study drugs and in none of the animals that received skim milk only and that urine from treated animals and controls was always collected under the same conditions and at the same time makes drug formulations the more likely source.
Figure 6.

Changes in urine metabolite patterns after 28 days of treatment as assessed by 1H-NMR spectroscopy- urine metabolites associated with S3 tubular damage (44), (all urine metabolites determined semi-quantitatively by 1H-NMR, all values were normalized based on the total integral and are presented as means + standard deviations (n=6 for all groups), group comparison by one-way ANOVA, *significance levels estimated using a post-hoc pairwise multiple comparison (Holm-Sidak method).
Groups: con: vehicle-treated controls, CsA10: 10 mg/kg/day cyclosporine, CsA25: 25 mg/kg/day cyclosporine, Rapa1: 1 mg/kg/day sirolimus, CsA10/Rapa1: co-administration of 10 mg/ kg/ day cyclosporine and 1 mg/kg/day sirolimus, CsA25/Rapa1: co-administration of 25 mg/kg/day cyclosporine and 1 mg/kg/day sirolimus.
Figure 7.

Changes in urine metabolite patterns after 28 days of treatment as assessed by 1H-NMR spectroscopy (all urine metabolites determined semi-quantitatively by 1H-NMR, all values were normalized based on the total integral and are presented as means + standard deviations (n=6 for all groups), group comparison by one-way ANOVA, *significance levels estimated using a post-hoc pairwise multiple comparison (Holm-Sidak method).
Groups: con: vehicle-treated controls, CsA10: 10 mg/kg/day cyclosporine, CsA25: 25 mg/kg/day cyclosporine, Rapa1: 1 mg/kg/day sirolimus, CsA10/Rapa1: co-administration of 10 mg/ kg/ day cyclosporine and 1 mg/kg/day sirolimus, CsA25/Rapa1: co-administration of 25 mg/kg/day cyclosporine and 1 mg/kg/day sirolimus.
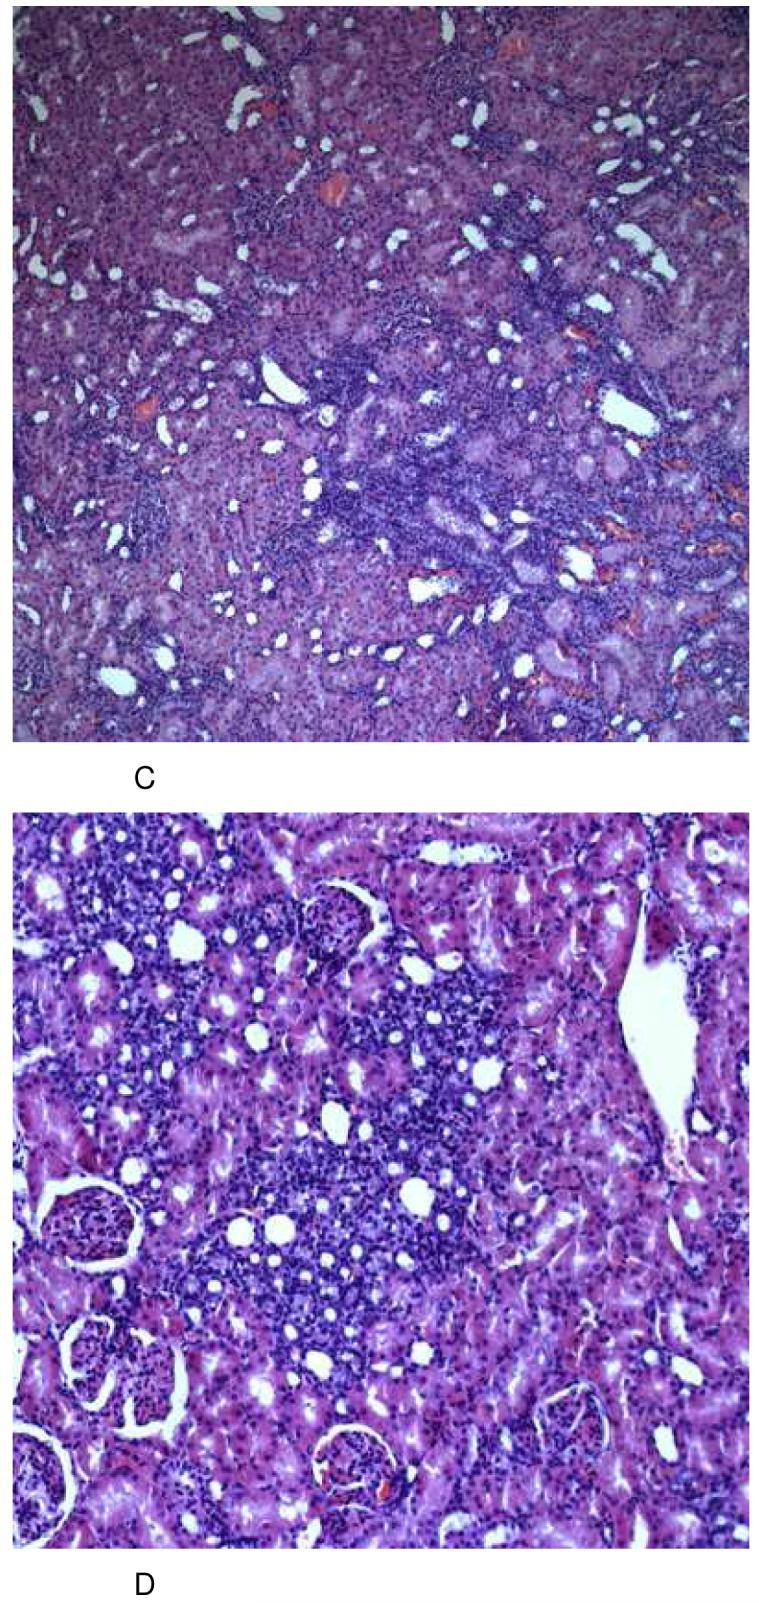
Figure 9. Representative 1H-NMR spectra (aromatic region) of urine extracts after treatment for 28 days.
The total number of urine samples evaluated for each group was n=6. Glucose, urea and hippurate signals are shown.
Groups: con: vehicle-treated controls, CsA10: 10 mg/kg/day cyclosporine, CsA25: 25 mg/kg/day cyclosporine, Rapa1: 1 mg/kg/day sirolimus, CsA10/Rapa1: co-administration of 10 mg/ kg/ day cyclosporine and 1 mg/kg/day sirolimus, CsA25/Rapa1: co-administration of 25 mg/kg/day cyclosporine and 1 mg/kg/day sirolimus.
Discussion
The goal of the present study was to assess the time-dependent effects of cyclosporine and its combination with sirolimus on the kidney and to evaluate the underlying molecular mechanisms. In previous animal studies on immunosuppressant nephrotoxicity, it has been well established that rat kidneys are less sensitive to the negative effects of cyclosporine than humans (35). Two major strategies have been used in the past to circumvent this problem; one is the use of high cyclosporine doses (25), the second is based on the so-called salt-depleted rat model (19, 20, 36), originally developed and described by Elzinga et al (37). Although the salt-depleted rat model represents a reproducible setting for cyclosporine toxicity, as of yet, the exact biochemical mechanisms remain unknown, and, as in cases of using supra-clinical doses, it remains unclear how valid extrapolation of such data to transplant patients really is. It seems reasonable to expect that a model using normally fed rats that are exposed to doses of cyclosporine and other immunosuppressants resulting in blood concentrations close to the clinically relevant range over a sufficient period of time will better transfer to the clinical situation and increase the impact of pathophysiological, histological and biochemical changes found. Vice versa, in less physiologic models that use salt-depletion or supra-clinical doses to accelerate the development of immunosuppressant nephrotoxicity, results may be of limited use. Our experiments show that treatment of rats with cyclosporine for 28 days with or without the addition of sirolimus is sufficient to result in a detectable impairment of renal function (demonstrated by a significant reduction of glomerular filtration rates) and histomorphologic alterations (tubular vacuolization, tubular epithelial damage) that are considered typical for cyclosporine toxicity (38).
Cyclosporine and sirolimus blood concentrations, as measured using a specific and validated LC-MS/MS assay, were close to those reported in kidney graft patients after 4 hours (39). Doses of 1 mg/kg/day sirolimus, depending on the absence or presence of cyclosporine, led to average blood concentrations between 3.2 ± 1.7 and 18.7 ± 7.2 ng/mL, respectively, after 4 hours (Figure 3B), which yielded trough blood concentrations (C24h) most likely at the lower end of the target blood concentration range of transplant patients (usually 3-15 ng/mL). We also confirmed as already reported in clinical studies (40) and other animal models (17, 41) that the negative effects of cyclosporine on kidney function are enhanced by co-administration of sirolimus.
After establishing the validity of our rat model, we characterized the corresponding metabolic changes in urine caused by immunosuppressants. The 6-day time-point was chosen to assess time-dependency of histological and biochemical changes and to assess as to whether changes in urine metabolite patterns allow for prediction of renal histological and pathophysiological changes seen after 28 days of treatment. The time-dependency of the urine metabolite pattern changes found was more extensive than could be expected based on the existing literature. In retrospect, it would have been of advantage to collect urine at additional time points between 6 and 28 days, to follow the time-dependent changes in more detail, and to exclude that other important changes caused by additional toxicodynamic processes that may have occurred between days 6 and 28 were missed. Our data provides the rationale for the design of a future study that takes advantage of our non-invasive bioanalytical strategy and studies the time-dependency of urine metabolite patterns in response to immunosuppressant exposure in greater detail.
Our previous studies suggested that the negative effect of cyclosporine and its enhancement by sirolimus are mediated by a decrease in mitochondrial energy metabolism, caused by an increase in reactive oxygen species (7). 15-F2t-isoprostanes are considered to be reliable and chemically stable in vivo markers for oxidative stress (42, 43) and it reasonable to assume that their concentrations in urine are a valid surrogate marker for the amount of immunosuppressant-induced oxygen radical formation in the kidney. As shown in Figure 4, 15-F2t-isoprostane urine concentrations in groups treated for 6 days showed the following rank order: 10 mg/kg/day cyclosporine <25 mg/kg/day cyclosporine <1mg/kg/day sirolimus <10 mg/kg/day cyclosporine+1 mg/kg/day sirolimus <25 mg/kg/day cyclosporine+1 mg/kg/day sirolimus. These data match our previous findings that showed higher intracellular oxygen radical concentrations following sirolimus treatment than after cyclosporine exposure alone (7). After 6 days, urine 15-F2t-isoprostane concentrations in the cyclosporine treated groups paralleled the decrease of glomerular filtration rate in the absence of any histological damage. In the long-term treatment, although now structural and functional changes in the kidney increased, 15-F2t-isoprostane urine concentrations decreased but were still above controls. Thus, these results indicate a possible involvement of free radicals, especially in the early course of immunosuppressant induced toxicity.
1H NMR has been described as a valuable tool to detect changes in urine metabolites (44-46) that could be correlated with specific histopathologic changes induced by certain nephrotoxins like hexachlorbutadiene (HCBD) (47) or S-(1,2-dichlorovinyl)-L-homocysteine (DCVHC) (48). In these animal studies, proximal tubular injury was associated with increased urine concentrations of glucose, lactate, hydroxybutyrate and decreased concentrations of hippurate, creatinine, succinate and citrate. Medullary injury including papillary necrosis was associated with an increase in TMAO, TMA, actetate and succinate (44, 45, 49, 50). TMA, a volatile substance synthesized from choline in the gut before absorption into the blood system, is metabolized by flavin-containing monooxygenase into TMAO (50, 51).
In an earlier study on patients with kidney transplantation, urine analysis by 1H NMR also revealed increased levels of acetate, succinate, glycine, alanine, dimethylamine (DMA) and TMAO in patients with delayed or non-function of the graft. Since only the differences of TMAO were altered significantly, the authors concluded that this alone could serve as a future marker for post-transplant dysfunction (52), a statement that has to be questioned now, considering our data and the aforementioned results of other studies. It is reasonable to expect that alterations of urine metabolite patterns as molecular markers of renal damage are not specific.
In a previous study, rats were treated with 45mg/kg/day cyclosporine, which resulted in increased urine concentrations of glucose, acetate, TMA and succinate on day 7 (25). These results are consistent with our findings after 6 days. On the other hand, changes in urine metabolite patterns observed after 28 days of treatment with cyclosporine or a combination of cyclosporine and sirolimus in our study, match those described for nephrotoxins causing (pars recta) tubular injury (47, 48). This corresponds to the histology results that also showed specific tubular damage.
Overall, our data indicated that the extent of changes in urine metabolic patterns reflects the severity of kidney damage as evaluated by histology and reduction in glomerular filtration rates. Transporters for glucose, lactate and Krebs cycle intermediates have been identified in the brush border membrane of the tubuli (53). Krebs cycle intermediates imported from urine are used as energy substrates by proximal tubular cells (54). After 28 days of treatment, cyclosporine alone and, to a larger extent, in combination with sirolimus increased lactate and glucose concentrations in urine and decrease the concentrations of Krebs cycle intermediates (Figure 6). As a possible mechanism, this suggests that the proximal tubulus cells cannot utilize glucose and lactate as energy substrates as usual and have to compensate by importing more Krebs cycle intermediates from the urine. Krebs cycle intermediates are imported from urine by the sodium-dicarboxylate symporter NaDC-3 transporter that is mostly located in the proximal tubulus cells in the kidney (55). Our results provide additional evidence that any changes in urine metabolite patterns are mainly induced by the negative effects of cyclosporine with and without co-administration of sirolimus on the proximal tubulus cell. If this hypothesis is true, changes in urine metabolite patterns observed in our rat study were mainly caused by active compensation of the negative effects of cyclosporine on the proximal tubulus cells.
Comparison of the urine metabolite patterns and isoprostane concentrations in urine showed that there is a time-dependent shift from primarily oxidative stress after 6 days of treatment to injury of the proximal tubuli after 28 days. This is not unexpected since cyclosporine toxicity is mediated by oxygen radical formation (7) and can be expected to precede tubular injury. Our results indicate that it will be important in future studies to include several time points in urine metabolic profiling studies since the metabolite patterns differ depending on the time-dependent stage of injury.
For the enhancement of cyclosporine toxicity by sirolimus, two potential mechanisms can be described: a toxicodynamic mechanism involving a synergistic inhibition of high-energy phosphate metabolism (7) and a toxicokinetic interaction leading to increased cyclosporine kidney tissue concentrations in the presence of sirolimus (19). Our study results support both mechanisms. Co-administration of sirolimus and cyclosporine enhances the distribution of both cyclosporine and sirolimus into the kidney tissue and adds to the negative effects of cyclosporine on cell metabolism as reflected in an increase of isoprostane concentrations in urine and changes in the urine metabolite pattern.
Although it is well recognized that sirolimus alone does not induce nephrotoxicity (12, 13, 56, 57), our study shows that the kidney is not completely inert against sirolimus. Despite the fact that sirolimus treatment does not increase serum creatinine concentrations, changes in kidney histology were observed after 28 days, which typically appeared as a dilatation and atrophy of the tubular system. Also, sirolimus treatment showed a trend towards a decrease of glomerular filtration rates (Figure 1), an increase of urine isoprostane concentrations and a significant alteration of urine metabolite pattern (Figures 5-9).
If our experimental results in rats translate into the clinical situation, our study will have important implications for the management of transplant patients treated with cyclosporine and/or sirolimus, since one of the major problems with the diagnosis of immunosuppressant toxicity is that the currently used diagnostic markers such as creatinine in serum and kidney histology are rather insensitive or impractical. There is a significant lag time between the onset of immunosuppressant toxicity and the time-point when these markers show changes that are considered clinically relevant (6). Our results provide a potential explanation for these phenomena. Serum creatinine is mainly a marker for glomerular dysfunction but it seems that during immunosuppressant treatment, damage of the tubular system precedes that of the glomeruli. We were able to demonstrate that in addition to creatinine in serum, the monitoring of metabolites in urine such as glucose, isoprostanes and/or Krebs cycle intermediates may confer critical information. It is reasonable to expect that monitoring these urine metabolites either as a single or a combinatorial marker has the potential to be more sensitive than creatinine concentrations in serum since these are directly affected by the toxicodynamic effects of cyclosporine and/or sirolimus while creatinine will start to change only after secondary effects such as inflammation and/or interstitial fibrosis has negatively effected glomerular function. A clinical trial to assess whether the results of the present study can be translated to transplant patients is currently in progress. However, a brief summary of the first clinical results of a single dose (5 mg/kg cyclosporine in its Neoral formulation), placebo-controlled, cross-over healthy volunteer study suggests that this may indeed be the case, and this has been recently described by our group in a review paper (22).
In summary, (A) we established a normal-salt rat model for immunosuppressant nephrotoxicity based on drug exposure similar to patients; (B) we showed that the biochemical signature of cyclosporine and sirolimus is time-dependent, with oxidative stress dominating early after-treatment initiation and tubular damage after long-term treatment; (C) our metabolic profiling data that was supported by kidney histologies suggested that the negative effects of cyclosporine and/or sirolimus are focused on the proximal tubuli while other parts of the kidney such as glomeruli were not affected after 28 days of treatment; (D) we showed that both toxicokinetic and -dynamic mechanisms may be the reason for the enhancement of the negative effects of cyclosporine on the kidney by sirolimus and, most importantly, (E) our data supports our hypothesis that the negative effects of cyclosporine and/or sirolimus on the kidney are reflected by changes in urine metabolite patterns that are closely connected to histological and biochemical changes and seem to be more sensitive than monitoring serum creatinine and blood urea nitrogen concentrations.
Our study provides a first step towards translational studies to assess the potential value of urine isoprostane, glucose and Krebs cycle intermediate concentrations in urine to develop a toxicodynamic therapeutic drug monitoring strategy for transplant patients (24). It also generated hypotheses for further in-depth mechanistic studies to evaluate the reasons for the changes of urine metabolite patterns by cyclosporine and/or sirolimus. Our data suggest that the proximal tubulus cells and the NaDC3 transporter are of special interest.
Non-Standard Abbreviations
- Rapa
Sirolimus
- CsA
Cyclosporine
- D2O
Deuterooxide
- DCI
Deuterochloride
- FID
Free induction decay
- H.E.
Hematoxylin and eosin staining
- HCN PFG
Hydrogen carbon nitrogen PF gradient
- HPLC
High-performance liquid chromatography
- MRM mode
Multi reaction monitoring mode
- MS
Mass spectrometry
- MS/MS
Tandem mass spectrometry
- mTOR
Mammalian target of rapamycin
- NaOD
Deuterated sodium hyrdroxide
- NMR
Nuclear magnetic resonance spectroscopy
- TMA
Trimethyl amine
- TMAO
Trimethyl amine-N-oxide
Footnotes
Financial Support
The study was supported by the United States National Institutes of Health (NIH), grants R01 DK065094 and P30 DK048520 (Mass Spectrometry Core).
References
- (1).Meier-Kriesche HU, Hricik DE. Are we ready to give up on calcineurin inhibitors? Am J Transplant. 2006;6:445–446. doi: 10.1111/j.1600-6143.2006.01233.x. [DOI] [PubMed] [Google Scholar]
- (2).Ojo AO, Held PJ, Port FK, Wolfe RA, Leichtman AB, Young EW, Arndorfer J, Christensen L, Merion RM. Chronic renal failure after transplantation of a nonrenal organ. N Engl J Med. 2003;349:931–940. doi: 10.1056/NEJMoa021744. [DOI] [PubMed] [Google Scholar]
- (3).Shihab FS. Cyclosporine nephropathy: pathophysiology and clinical impact. Semin Nephrol. 1996;16:536–547. [PubMed] [Google Scholar]
- (4).Guerra G, Srinivas TR, Meier-Kriesche HU. Calcineurin inhibitor-free immunosuppression in kidney transplantation. Transpl Int. 2007;20:813–827. doi: 10.1111/j.1432-2277.2007.00528.x. [DOI] [PubMed] [Google Scholar]
- (5).Campistol JM, Grinyo JM. Exploring treatment options in renal transplantation: the problems of chronic allograft dysfunction and drug-related nephrotoxicity. Transplantation. 2001;71:SS42–51. [PubMed] [Google Scholar]
- (6).Chapman JR, O’Connell PJ, Nankivell BJ. Chronic renal allograft dysfunction. J Am Soc Nephrol. 2005;16:3015–3026. doi: 10.1681/ASN.2005050463. [DOI] [PubMed] [Google Scholar]
- (7).Christians U, Gottschalk S, Miljus J, Hainz C, Benet LZ, Leibfritz D, Serkova N. Alterations in glucose metabolism by cyclosporine in rat brain slices link to oxidative stress: interactions with mTOR inhibitors. Br J Pharmacol. 2004;143:388–396. doi: 10.1038/sj.bjp.0705939. [DOI] [PMC free article] [PubMed] [Google Scholar]
- (8).Trapp A, Weis M. The impact of immunosuppression on endothelial function. J Cardiovasc Pharmacol. 2005;45:81. doi: 10.1097/00005344-200501000-00014. [DOI] [PubMed] [Google Scholar]
- (9).Gardiner SM, March JE, Kemp PA, Fallgren B, Bennett T. Regional haemodynamic effects of cyclosporine A, tacrolimus and sirolimus in conscious rats. Br J Pharmacol. 2004;141:634–643. doi: 10.1038/sj.bjp.0705659. [DOI] [PMC free article] [PubMed] [Google Scholar]
- (10).Kahan BD. Sirolimus: a comprehensive review. Expert Opin Pharmacother. 2001;2:1903–1917. doi: 10.1517/14656566.2.11.1903. [DOI] [PubMed] [Google Scholar]
- (11).Neuhaus P, Klupp J, Langrehr JM. mTOR inhibitors: an overview. Liver Transpl. 2001;7:473–484. doi: 10.1053/jlts.2001.24645. [DOI] [PubMed] [Google Scholar]
- (12).Groth CG, Backman L, Morales JM, Calne R, Kreis H, Lang P, Touraine JL, Claesson K, Campistol JM, Durand D, Wramner L, Brattstrom C, Charpentier B, Sirolimus European Renal Transplant Study Group Sirolimus (rapamycin)-based therapy in human renal transplantation: similar efficacy and different toxicity compared with cyclosporine. Transplantation. 1999;67:1036–1042. doi: 10.1097/00007890-199904150-00017. [DOI] [PubMed] [Google Scholar]
- (13).Kreis H, Cisterne JM, Land W, Wramner L, Squifflet JP, Abramowicz D, Campistol JM, Morales JM, Grinyo JM, Mourad G, Berthoux FC, Brattstrom C, Lebranchu Y, Vialtel P. Sirolimus in association with mycophenolate mofetil induction for the prevention of acute graft rejection in renal allograft recipients. Transplantation. 2000;69:1252–1260. doi: 10.1097/00007890-200004150-00009. [DOI] [PubMed] [Google Scholar]
- (14).Davis C. Sirolimus delays renal allograft recovery. Am J Transplant. 2003;3:363–365. doi: 10.1034/j.1600-6143.2003.00116.x. [DOI] [PubMed] [Google Scholar]
- (15).McTaggart RA, Gottlieb D, Brooks J, Bacchetti P, Roberts JP, Tomlanovich S, Feng S. Sirolimus prolongs recovery from delayed graft function after cadaveric renal transplantation. Am J Transplant. 2003;3:416–423. doi: 10.1034/j.1600-6143.2003.00078.x. [DOI] [PubMed] [Google Scholar]
- (16).Lieberthal W, Fuhro R, Andry CC, Rennke H, Abernathy VE, Koh JS, Valeri R, Levine JS. Rapamycin impairs recovery from acute renal failure: role of cell-cycle arrest and apoptosis of tubular cells. Am J Physiol Renal Physiol. 2001;281:F693–706. doi: 10.1152/ajprenal.2001.281.4.F693. [DOI] [PubMed] [Google Scholar]
- (17).Andoh TF, Lindsley J, Franceschini N, Bennett WM. Synergistic effects of cyclosporine and rapamycin in a chronic nephrotoxicity model. Transplantation. 1996;62:311–316. doi: 10.1097/00007890-199608150-00002. [DOI] [PubMed] [Google Scholar]
- (18).Nielsen FT, Ottosen P, Starklint H, Dieperink H. Kidney function and morphology after short-term combination therapy with cyclosporine A, tacrolimus and sirolimus in the rat. Nephrol Dial Transplant. 2003;18:491–496. doi: 10.1093/ndt/18.3.491. [DOI] [PubMed] [Google Scholar]
- (19).Podder H, Stepkowski SM, Napoli KL, Clark J, Verani RR, Chou TC, Kahan BD. Pharmacokinetic interactions augment toxicities of sirolimus/cyclosporine combinations. J Am Soc Nephrol. 2001;12:1059–1071. doi: 10.1681/ASN.V1251059. [DOI] [PubMed] [Google Scholar]
- (20).Shihab FS, Bennett WM, Yi H, Choi SO, Andoh TF. Sirolimus increases transforming growth factor-beta1 expression and potentiates chronic cyclosporine nephrotoxicity. Kidney Int. 2004;65:1262–1271. doi: 10.1111/j.1523-1755.2004.00498.x. [DOI] [PubMed] [Google Scholar]
- (21).Christians U, Reisdorph N, Klawitter J, Schmitz V. Biomarkers of immunosuppressive drug toxicity. Curr Opin Organ Transplant. 2005;10:284–294. [Google Scholar]
- (22).Christians U, Schmitz V, Schoning W, Bendrick-Peart J, Klawitter J, Haschke M, Klawitter J. Toxicodynamic Therapeutic Drug Monitoring of Immunosuppressants: Promises, Reality, and Challenges. Ther Drug Monit. 2008;30:151–158. doi: 10.1097/FTD.0b013e31816b9063. [DOI] [PubMed] [Google Scholar]
- (23).Raulf F. Novel biomarkers of allograft rejection: ‘omics’ approaches start to deliver. Curr Opin Organ Transplant. 2005;10:295–300. [Google Scholar]
- (24).Wishart DS. Metabolomics: the principles and potential applications to transplantation. Am J Transplant. 2005;5:2814–2820. doi: 10.1111/j.1600-6143.2005.01119.x. [DOI] [PubMed] [Google Scholar]
- (25).Lenz EM, Bright J, Knight R, Wilson ID, Major H. Cyclosporin A-induced changes in endogenous metabolites in rat urine: a metabonomic investigation using high field 1H NMR spectroscopy, HPLC-TOF/MS and chemometrics. J Pharm Biomed Anal. 2004;35:599–608. doi: 10.1016/j.jpba.2004.02.013. [DOI] [PubMed] [Google Scholar]
- (26).Klawitter J, Schmitz V, Klawitter J, Benrick-Peart J, Christians U. Proteomic-Metabonomic Evaluation of the Salt-Depleted Rat Model To Study Chronic Nephropathy. Am J Transplant. 2007;7:430. [Google Scholar]
- (27).Schnackenberg LK, Sun J, Espandiari P, Holland RD, Hanig J, Beger RD. Metabonomics evaluations of age-related changes in the urinary compositions of male Sprague Dawley rats and effects of data normalization methods on statistical and quantitative analysis. BMC Bioinformatics. 2007;8(Suppl 7):S3. doi: 10.1186/1471-2105-8-S7-S3. [DOI] [PMC free article] [PubMed] [Google Scholar]
- (28).Williams RE, Lenz EM, Lowden JS, Rantalainen M, Wilson ID. The metabonomics of aging and development in the rat: an investigation into the effect of age on the profile of endogenous metabolites in the urine of male rats using 1H NMR and HPLC-TOF MS. Mol Biosyst. 2005;1:166–175. doi: 10.1039/b500852b. [DOI] [PubMed] [Google Scholar]
- (29).Fleck C. Determination of the glomerular filtration rate (GFR): methodological problems, age-dependence, consequences of various surgical interventions, and the influence of different drugs and toxic substances. Physiol Res. 1999;48:267–279. [PubMed] [Google Scholar]
- (30).Lorenz JN, Gruenstein E. A simple, nonradioactive method for evaluating single-nephron filtration rate using FITC-inulin. Am J Physiol. 1999;276:F172–177. doi: 10.1152/ajprenal.1999.276.1.F172. [DOI] [PubMed] [Google Scholar]
- (31).Lombardi D, Gordon KL, Polinsky P, Suga S, Schwartz SM, Johnson RJ. Salt-sensitive hypertension develops after short-term exposure to Angiotensin II. Hypertension. 1999;33:1013–1019. doi: 10.1161/01.hyp.33.4.1013. [DOI] [PubMed] [Google Scholar]
- (32).Akira K, Masu S, Imachi M, Mitome H, Hashimoto M, Hashimoto T. 1H NMR-based metabonomic analysis of urine from young spontaneously hypertensive rats. J Pharm Biomed Anal. 2008;46:550–556. doi: 10.1016/j.jpba.2007.11.017. [DOI] [PubMed] [Google Scholar]
- (33).Dieterle F, Ross A, Schlotterbeck G, Senn H. Probabilistic quotient normalization as robust method to account for dilution of complex biological mixtures. Application in 1H NMR metabonomics. Anal Chem. 2006;78:4281–4290. doi: 10.1021/ac051632c. [DOI] [PubMed] [Google Scholar]
- (34).Haschke M, Zhang JL, Kahle C, Klawitter J, Korecka M, Shaw LM, Christians U. Quantification of 15-F2t-isoprostane in human urine and plasma using high-performance liquid chromatography-atmospheric pressure chemical ionization-tandem mass spectrometry. Clin Chem. 2006 doi: 10.1373/clinchem.2006.078972. in press. [DOI] [PubMed] [Google Scholar]
- (35).Racusen LC, Solez K. Cyclosporine nephrotoxicity. Int Rev Exp Pathol. 1988;30:107–157. doi: 10.1016/b978-0-12-364930-0.50007-5. [DOI] [PubMed] [Google Scholar]
- (36).Andoh TF, Bennett WM. The synergistic effects of cyclosporine and sirolimus (reply) Transplantation. 1997;63:1703–1704. doi: 10.1097/00007890-199706150-00031. [DOI] [PubMed] [Google Scholar]
- (37).Elzinga LW, Rosen S, Bennett WM. Dissociation of glomerular filtration rate from tubulointerstitial fibrosis in experimental chronic cyclosporine nephropathy: role of sodium intake. J Am Soc Nephrol. 1993;4:214–221. doi: 10.1681/ASN.V42214. [DOI] [PubMed] [Google Scholar]
- (38).Mihatsch MJ, Thiel G, Ryffel B. Histopathology of cyclosporine nephrotoxicity. Transplant Proc. 1988;20:759–771. [PubMed] [Google Scholar]
- (39).Canadian Neoral Renal Transplantation Study Group Absorption profiling of cyclosporine microemulsion (neoral) during the first 2 weeks after renal transplantation. Transplantation. 2001;72:1024–1032. doi: 10.1097/00007890-200109270-00008. [DOI] [PubMed] [Google Scholar]
- (40).Kahan BD, The Rapamune US Study Group Efficacy of sirolimus compared with azathioprine for reduction of acute renal allograft rejection: a randomised multicentre study. Lancet. 2000;356:194–202. doi: 10.1016/s0140-6736(00)02480-6. [DOI] [PubMed] [Google Scholar]
- (41).Brook NR, Waller JR, Bicknell GR, Nicholson ML. Cyclosporine and rapamycin act in a synergistic and dose-dependent manner in a model of immunosuppressant-induced kidney damage. Transplant Proc. 2005;37:837–838. doi: 10.1016/j.transproceed.2004.12.147. [DOI] [PubMed] [Google Scholar]
- (42).Lawson JA, Rokach J, FitzGerald GA. Isoprostanes: formation, analysis and use as indices of lipid peroxidation in vivo. J Biol Chem. 1999;274:24441–24444. doi: 10.1074/jbc.274.35.24441. [DOI] [PubMed] [Google Scholar]
- (43).Roberts LJ, Morrow JD. Measurement of F(2)-isoprostanes as an index of oxidative stress in vivo. Free Radic Biol Med. 2000;28:505–513. doi: 10.1016/s0891-5849(99)00264-6. [DOI] [PubMed] [Google Scholar]
- (44).Bairaktari E, Katopodis K, Siamopoulos KC, Tsolas O. Paraquat-induced renal injury studied by 1H nuclear magnetic resonance spectroscopy of urine. Clin Chem. 1998;44:1256–1261. [PubMed] [Google Scholar]
- (45).Neild GH, Foxall PJ, Lindon JC, Holmes EC, Nicholson JK. Uroscopy in the 21st century: high-field NMR spectroscopy. Nephrol Dial Transplant. 1997;12:404–417. doi: 10.1093/ndt/12.3.404. [DOI] [PubMed] [Google Scholar]
- (46).Shockcor JP, Holmes E. Metabonomic applications in toxicity screening and disease diagnosis. Curr Top Med Chem. 2002;2:35–51. doi: 10.2174/1568026023394498. [DOI] [PubMed] [Google Scholar]
- (47).Gartland KP, Bonner FW, Nicholson JK. Investigations into the biochemical effects of region-specific nephrotoxins. Mol Pharmacol. 1989;35:242–250. [PubMed] [Google Scholar]
- (48).Anthony ML, Beddell CR, Lindon JC, Nicholson JK. Studies on the comparative toxicity of S-(1,2-dichlorovinyl)-L-cysteine, S-(1,2-dichlorovinyl)-L-homocysteine and 1,1,2-trichloro-3,3,3-trifluoro-1-propene in the Fischer 344 rat. Arch Toxicol. 1994;69:99–110. doi: 10.1007/s002040050144. [DOI] [PubMed] [Google Scholar]
- (49).Holmes E, Bonner FW, Nicholson JK. 1H NMR spectroscopic and histopathological studies on propyleneimine-induced renal papillary necrosis in the rat and the multimammate desert mouse (Mastomys natalensis) Comp Biochem Physiol C Pharmacol Toxicol Endocrinol. 1997;116:125–134. doi: 10.1016/s0742-8413(96)00146-6. [DOI] [PubMed] [Google Scholar]
- (50).Podadera P, Sipahi AM, Areas JA, Lanfer-Marquez UM. Diagnosis of suspected trimethylaminuria by NMR spectroscopy. Clin Chim Acta. 2005;351:149–154. doi: 10.1016/j.cccn.2004.09.006. [DOI] [PubMed] [Google Scholar]
- (51).Lang DH, Yeung CK, Peter RM, Ibarra C, Gasser R, Itagaki K, Philpot RM, Rettie AE. Isoform specificity of trimethylamine N-oxygenation by human flavin-containing monooxygenase (FMO) and P450 enzymes: selective catalysis by FMO3. Biochem Pharmacol. 1998;56:1005–1012. doi: 10.1016/s0006-2952(98)00218-4. [DOI] [PubMed] [Google Scholar]
- (52).Foxall PJ, Mellotte GJ, Bending MR, Lindon JC, Nicholson JK. NMR spectroscopy as a novel approach to the monitoring of renal transplant function. Kidney Int. 1993;43:234–245. doi: 10.1038/ki.1993.37. [DOI] [PubMed] [Google Scholar]
- (53).Wright E. Transport of metabolic intermediates across renal membrane brush border membrane vesicles brane. Ann Rev Physiol. 1985;47:127–141. doi: 10.1146/annurev.ph.47.030185.001015. [DOI] [PubMed] [Google Scholar]
- (54).Mandel LJ. Metabolic substrates, cellular energy production, and the regulation of proximal tubular transport. Annu Rev Physiol. 1985;47:85–101. doi: 10.1146/annurev.ph.47.030185.000505. [DOI] [PubMed] [Google Scholar]
- (55).Burckhardt BC, Burckhardt G. Transport of organic anions across the basolateral membrane of proximal tubule cells. Rev Physiol Biochem Pharmacol. 2003;146:95–158. doi: 10.1007/s10254-002-0003-8. [DOI] [PubMed] [Google Scholar]
- (56).Gonwa TA, Hricik DE, Brinker K, Grinyo JM, Schena FP. Improved renal function in sirolimus-treated renal transplant patients after early cyclosporine elimination. Transplantation. 2002;74:1560–1567. doi: 10.1097/00007890-200212150-00013. [DOI] [PubMed] [Google Scholar]
- (57).Johnson RW, Kreis H, Oberbauer R, Brattstrom C, Claesson K, Eris J. Sirolimus allows early cyclosporine withdrawal in renal transplantation resulting in improved renal function and lower blood pressure. Transplantation. 2001;72:777–786. doi: 10.1097/00007890-200109150-00007. [DOI] [PubMed] [Google Scholar]
- (58).Robertson DG, Reily MD, Sigler RE, Wells DF, Paterson DA, Braden TK. Metabonomics: evaluation of nuclear magnetic resonance (NMR) and pattern recognition technology for rapid in vivo screening of liver and kidney toxicants. Toxicol Sci. 2000;57:326–337. doi: 10.1093/toxsci/57.2.326. [DOI] [PubMed] [Google Scholar]