Abstract
OBJECTIVE—Our previous studies demonstrated that nutrient regulation of mammalian target of rapamycin (mTOR) signaling promotes regenerative processes in rodent islets but rarely in human islets. Our objective was to extend these findings by using therapeutic agents to determine whether the regulation of glycogen synthase kinase-3 (GSK-3)/β-catenin and mTOR signaling represent key components necessary for effecting a positive impact on human β-cell mass relevant to type 1 and 2 diabetes.
RESEARCH DESIGN AND METHODS—Primary adult human and rat islets were treated with the GSK-3 inhibitors, LiCl and the highly potent 1-azakenpaullone (1-Akp), and with nutrients. DNA synthesis, cell cycle progression, and proliferation of β-cells were assessed. Measurement of insulin secretion and content and Western blot analysis of GSK-3 and mTOR signaling components were performed.
RESULTS—Human islets treated for 4 days with LiCl or 1-Akp exhibited significant increases in DNA synthesis, cell cycle progression, and proliferation of β-cells that displayed varying degrees of sensitivity to rapamycin. Intermediate glucose (8 mmol/l) produced a striking degree of synergism in combination with GSK-3 inhibition to enhance bromodeoxyuridine (BrdU) incorporation and Ki-67 expression in human β-cells. Nuclear translocation of β-catenin responsible for cell proliferation was found to be particularly sensitive to rapamycin.
CONCLUSIONS—A combination of GSK-3 inhibition and nutrient activation of mTOR contributes to enhanced DNA synthesis, cell cycle progression, and proliferation of human β-cells. Identification of therapeutic agents that appropriately regulate GSK-3 and mTOR signaling may provide a feasible and available approach to enhance human islet growth and proliferation.
Type 1 and 2 diabetes result from the inability of pancreatic β-cells to secrete insulin necessary to maintain normal glucose homeostasis due to an acquired secretory defect and/or inadequate β-cell mass (1,2). Studies by Dor et al. (3) and Teta et al. (4) emphasized the importance of the proliferative capacity of existing adult mouse β-cells to significantly contribute to the maintenance of β-cell mass during adulthood.
Mammalian target of rapamycin (mTOR) integrates signals derived from growth factors and nutrients to regulate protein translation, DNA synthesis, cell size, and proliferation (5–10). Target of rapamycin complex 1 (TORC1) is a functional association of mTOR with the scaffolding protein, raptor, whereas TORC2 is the functional association of mTOR with the protein, rictor. Rapamycin is able to disrupt raptor-mTOR interaction, whereas the rictor-mTOR complex is resistant to short-term exposure to rapamycin (6). Two prominent downstream targets of mTOR are 70-kDa ribosomal protein S6 kinase (S6K1) and eukaryotic initiation factor 4E–binding protein 1 (4EBP1). The overactivation of mTOR/S6K1 due to excess nutrients exerts a feedback inhibition through the upstream insulin receptor substrates 1 and 2 of insulin signaling that leads to decreased phosphorylation and activity of Akt (1,11).
Glycogen synthase kinase-3 (GSK-3) derives its name from its ability to phosphorylate glycogen synthase and to suppress glycogen synthesis in skeletal muscle, but since this initial observation, a myriad of other GSK-3 targets have been identified (12–14). Two isoforms of GSK-3, α and β, exist and have overlapping functions. Lithium, an agent used as a mood stabilizer for decades, was first connected to GSK-3 inhibition for its ability to mimic Wnt signaling in Xenopus development (15,16). Lithium also inhibits inositol monophosphatase and other related phosphomonoesterases (17). Recently, more specific and potent small molecule GSK-3 inhibitors have been developed, of which 1-azakenpaullone (1-Akp) is among the most potent and selective (18,19).
Our previous studies demonstrated that glucose, leucine, cAMP, and modulation of ATP-sensitive K+ (KATP) channels stimulate mTOR-dependent DNA synthesis and cell cycle progression in rat islets in a rapamycin-sensitive manner (20–23). In contrast to rat islets, human islets exhibited a variable response to these same stimuli, based on mTOR/S6K1 phosphorylation, and rarely increased DNA synthesis or entered the cell cycle. Because our previous studies on nutrient regulation of mTOR in rat islets identified a substantial dependence on mitochondrial metabolism, we extended our studies to nutrient metabolites. In preliminary experiments with the palmitate metabolite acetoacetate, we determined that the lithium component in commercially available acetoacetate salt significantly enhanced DNA synthesis and cell cycle progression in rodent and human islets in a rapamycin-sensitive manner. These effects of lithium were consistent with earlier findings by Sjoholm et al. (24), demonstrating that lithium triggered DNA synthesis in fetal rat islets, although the mechanism responsible for this effect was not identified. Here, we show that LiCl and the highly potent and specific GSK-3 inhibitor, 1-Akp, in combination with glucose, possess the ability to stimulate mTOR-dependent DNA synthesis, cell cycle progression, and proliferation of β-cells in human islets.
RESEARCH DESIGN AND METHODS
Lithium chloride (LiCl) was from Sigma, rapamycin was from Biomol, and 1-Akp was from Calbiochem.
Human islets.
Human islets were obtained from National Institutes of Health (NIH)-sponsored Islet Cell Resource (ICR) Basic Science Islet Distribution Program Centers (see acknowledgments for Centers) and the Juvenile Diabetes Research Foundation (JDRF) Human Islet Distribution Program at Washington University. All studies involving the use of isolated, cadaver-derived human islets were approved by the Washington University Human Studies Committee. Human islet donor data are as follows: 27 donors; 10 ICR Centers; 17 men, 10 women; age, mean 43.9 years (range 17–66); BMI, mean 29.3 (range 16.7–44.9); cold ischemia time, mean 9 h 6 min (range 1 h 25 min to 18 h 29 min); purity, mean 72.9% (range 20–95%); and viability, mean 90.3% (range 65–100%). Islets were handpicked for experiments.
Rat islet isolation.
Rat islets were obtained from adult male Sprague-Dawley rats (∼250 g; Harlan Sprague-Dawley) as previously described (20). Studies were approved by the Washington University Animal Studies Committee.
[3H]thymidine incorporation.
Islets (100) were cultured in Petri dishes for 4 days in 1 ml Connaught Medical Research Laboratories (CMRL) 1066 media [8 mmol/l glucose, 10% fetal bovine serum (FBS), 2 mmol/l l-glutamine, 100 units/ml penicillin, and 100 μg/ml streptomycin] with treatment conditions as indicated in the figure legends at 37°C. During the final 24 h of the 96-h incubation, 10 μCi [3H]thymidine (Perkin-Elmer) was added, and [3H]thymidine incorporation was determined by trichloroacetic acid extraction and scintillation counting.
Flow cytometry.
Islets (200) were cultured for 4 days in 1 ml CMRL as described in the figure legends. Islets were dispersed with Dispase (Roche) in Ca2+- and Mg2+-free Hanks solution at 31°C. Cells were rinsed with PBS plus 1% FBS and resuspended in PBS plus 1% FBS containing 250 μg/ml RNase A and 10 μg/ml propidium iodide. The DNA content was analyzed using a FACSCalibur instrument, and data were analyzed with CellQuest software (20).
Immunohistochemistry.
For Ki-67 expression, BrdU incorporation, and β-catenin nuclear translocation, human or rat islets (50–100) were treated for 4 days (1 day for β-catenin) and then dispersed using Accutase (Innovative Cell Technologies), and single-cell suspensions were cytospun onto coated slides (3,000–4,000 cells/slide). Cells were fixed in 4% paraformaldehyde, permeabilized using 1% Triton X-100 for 30 min, and blocked with 3% BSA for 1 h at room temperature. Indirect immunofluorescence was performed using primary antibodies, rabbit anti-insulin (1:100; Cell Signaling), mouse anti–Ki-67 (1:100; Dako), mouse anti–β-catenin (1:2,000; BD Biosciences), and secondary antibodies, Alexa 488 goat anti-rabbit (1:1,000) and Alexa 555 goat anti-mouse (1:1,000) (Molecular Probes). Nuclei were counterstained with 4′,6-diamindino-2-phenylindole (DAPI; Molecular Probes). Images were acquired using an Olympus BX61W1 microscope equipped with Olympus DP 70 cooled digital color camera.
Paraffin-embedded human islet sections (20–30 islets/section) were deparaffinized using xylene and rehydrated with graded alcohol. Antigen retrieval was carried out by microwaving the sections in 1 mmol/l EDTA, pH 8.0, for 15 min at high power followed by blocking in 3% BSA for 1 h at room temperature. The primary and secondary antibodies used were the same as above. For BrdU immunostaining, 1 μl cell proliferation labeling reagent (Amersham) was added to the treatment medium during the last 24 h of the 4-day incubation period and processed according to the manufacturer's protocol. Zeiss confocal microscope LSM 510 was used for Z-Stack analysis to confirm colocalization of Ki-67 or BrdU with insulin in human islets.
Proliferating β-cells were reported as the fold increase in Ki-67+ or BrdU+ insulin+/insulin+ cells compared with 5 mmol/l glucose. Nuclear translocation of β-catenin in β-cells is reported as fold increase in colocalized nuclear β-catenin+ insulin+/insulin+ cells.
Insulin secretion and content.
Islets were cultured for 4 days in CMRL medium containing 10% FBS, 8 mmol/l glucose ± 5 mmol/l LiCl or 5 μmol/l 1-Akp at 37°C. Static insulin secretion and islet insulin content were assayed as described in the figure legend.
Western blotting.
Islets (100) were incubated in CMRL medium with 0.1% BSA (1 ml) and treated as indicated in the figure legends for 30 min. Islet proteins were resolved by SDS-PAGE, transferred to nitrocellulose, and immunoblotted using ECL (Amersham) for detection of total and phosphorylated forms of GSK-3α and -3β (Ser 21/9), total β-catenin, and phosphorylated S6 and Akt (Ser473) (Cell Signaling).
Expression of data and statistics.
Data are presented as means ± SE. Statistically significant differences were assessed with unpaired t tests or one-way ANOVA followed by Newman-Keuls multiple comparison test. Significant differences are indicated by *P < 0.05, **P < 0.01, and ***P < 0.001.
RESULTS
Effects of LiCl and 1-Akp on mTOR-mediated DNA synthesis.
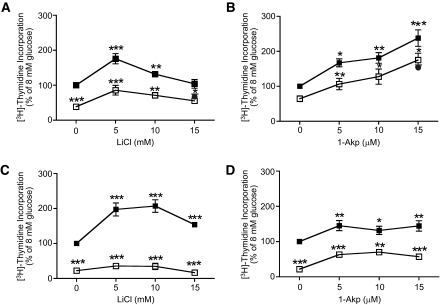
Fig. 1A shows that LiCl at 5 and 10 mmol/l significantly enhanced DNA synthesis in human islets above that of 8 mmol/l glucose, whereas 15 mmol/l LiCl did not. Rapamycin (25 nmol/l) significantly inhibited DNA synthesis at all concentrations of LiCl (0, 5, 10, and 15 mmol/l) in the presence of 8 mmol/l glucose. Rapamycin at 100 nmol/l failed to inhibit DNA synthesis below that at 25 nmol/l rapamycin. As shown in Fig. 1B, 1-Akp at 5, 10, and 15 μmol/l significantly enhanced DNA synthesis in human islets above that of 8 mmol/l glucose alone. Although 25 nmol/l rapamycin significantly inhibited DNA synthesis at 5, 10, and 15 μmol/l 1-Akp, the total amount of [3H]thymidine incorporation continued to rise with increasing doses of 1-Akp. Rapamycin at 100 nmol/l failed to significantly inhibit DNA synthesis below that of 25 nmol/l rapamycin.
FIG. 1.
Dose response of LiCl and 1-Akp on mTOR-dependent DNA synthesis in human and rat islets. Human (A and B) or rat (C and D) islets (100) were cultured for 4 days in CMRL-1066 medium containing 10% FBS, 8 mmol/l glucose ± rapamycin, LiCl, or 1-Akp as indicated. [3H]thymidine was added to each dish 24 h before the end of the 4-day period. Data are the means ± SE; n = 3 experiments (except at 15 mmol/l LiCl n = 2) (A); n = 5 experiments (except at 15 μmol/l 1-Akp n = 2) with duplicate or triplicate samples in each experiment (B); n = 3 with duplicate samples in each experiment (C and D). *P < 0.05, **P < 0.01, and ***P < 0.001 indicate significant differences from 8 mmol/l glucose alone. ▪, 8 mmol/l glucose; □, 8 mmol/l glucose + Rap 25 nmol/l; •, 8 mmol/l glucose + Rap 100 nmol/l.
Figure 1C shows that LiCl at 5, 10, and 15 mmol/l significantly enhanced DNA synthesis above that of 8 mmol/l glucose in rat islets and was highly sensitive to inhibition by rapamycin. Although 1-Akp (Fig. 1D) significantly increased DNA synthesis in rat islets above 8 mmol/l glucose alone, it did not continue to rise with increasing concentrations of 1-Akp in contrast to human islets (Fig. 1B). Rapamycin (25 nmol/l) significantly inhibited DNA synthesis at 0, 5, 10, and 15 μmol/l 1-Akp.
Effects of exogenous insulin on DNA synthesis.
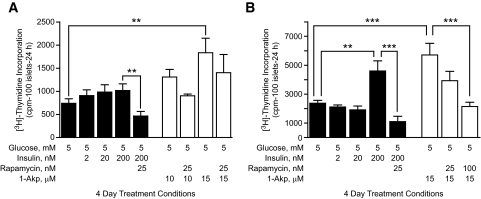
Figure 2A (filled columns) indicates that exogenous insulin (2, 20, or 200 nmol/l) failed to significantly increase DNA synthesis in human islets above that of basal glucose (5 mmol/l). 1-Akp (Fig. 2A, open columns) at 10 and 15 μmol/l shows a marked increase in DNA synthesis. These studies suggest that stimulatory actions of 1-Akp on DNA synthesis are independent of endogenous insulin through the insulin signaling pathway. Rapamycin (25 nmol/l) significantly reduced DNA synthesis induced by 5 mmol/l glucose plus 200 nmol/l insulin, even below the levels at 5 mmol/l glucose. 1-Akp–dependent DNA synthesis in human islets was modestly, but not significantly, sensitive to rapamycin.
FIG. 2.
Effects of exogenous insulin on mTOR-dependent DNA synthesis in human and rat islets. Human islets (A) or rat islets (B) (100) were cultured for 4 days in CMRL-1066 medium containing 10% FBS, 5 mmol/l glucose ± rapamycin, insulin, or 1-Akp as indicated. [3H]thymidine was added to each dish 24 h before the end of the 4-day period. Data are the means ± SE of n = 3 experiments with triplicate samples in each experiment. **P < 0.01 and ***P < 0.001 denote significant differences between the bracketed conditions. cpm, counts per minute.
In contrast to human islets, rat islets (Fig. 2B) show significantly enhanced DNA synthesis at 200 nmol/l insulin. As in human islets (Fig. 2A), 25 nmol/l rapamycin significantly reduced DNA synthesis induced by 5 mmol/l glucose plus 200 nmol/l insulin. Rapamycin (25 nmol/l) reduced, whereas 100 nmol/l rapamycin completely inhibited, 15 μmol/l 1-Akp–mediated enhancement of DNA synthesis. Rat islets also incorporated significantly more [3H]thymidine overall than human islets.
GSK-3 inhibition and cell cycle progression.
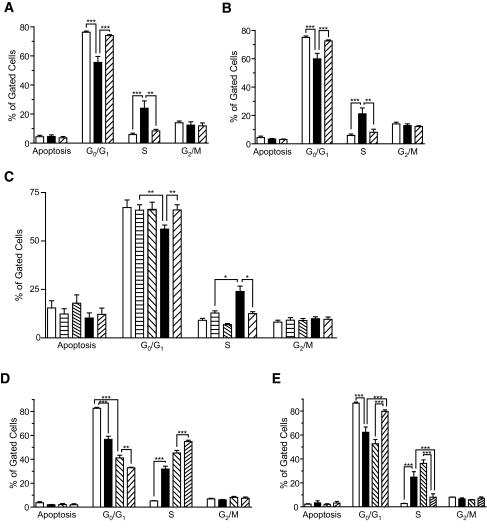
In Fig. 3A, exposure of human islets to 10 mmol/l LiCl plus 5 mmol/l glucose, conditions that enhance basal DNA synthesis (data not shown), resulted in a significant decrease of cells in G0/G1 phase (76 ± 1.4 to 55 ± 4.0%), an increase of cells in S phase (5.4 ± 0.9 to 24 ± 5.0%), and a retention of cells in G2/M (12%) compared with 5 mmol/l glucose. Rapamycin (100 nmol/l) prevented the progression of cells from G0/G1 to S phase.
FIG. 3.
Lithium- and 1-Akp–mediated promotion of cell cycle progression in human and rat islet cells is blocked by rapamycin. Human (A–C) and rat (D and E) (200) islets were cultured in CMRL containing 10% FBS, 5 or 8 mmol/l glucose, and LiCl or 1-Akp ± rapamycin as indicated. At the end of the 4-day incubation period, islets were dispersed into single cells and processed as described in research design and methods to determine cell cycle progression. Data are the means ± SE of n = 2 experiments with duplicate samples in each experiment (A and B; A: □, 5 mmol/l glucose; ▪, 5 mmol/l glucose + 10 mmol/l LiCl;  , 5 mmol/l glucose + 10 mmol/l LiCl + 100 nmol/l rapamycin. B: □, 5 mmol/l glucose; ▪, 5 mmol/l glucose + 15 μmol/l 1-Akp;
  , 5 mmol/l glucose + 15 μmol/l 1-Akp + 100 nmol/l rapamycin.), n = 3 experiments with duplicate samples (C; □, 5 mmol/l glucose;
  , 8 mmol/l glucose;
  , 8 mmol/l glucose + 100 nmol/l rapamycin; ▪, 8 mmol/l glucose + 15 μmol/l 1-Akp;
  , 8 mmol/l glucose + 15 μmol/l 1-Akp + 100 nmol/l rapamycin), n = 2 experiments with duplicate samples (D; □, 5 mmol/l glucose; ▪, 5 mmol/l glucose + 10 mmol/l LiCl;
  , 8mmol/l glucose;
  , 8 mmol/l glucose + 10 mmol/l LiCl), and n = 3 experiments with triplicate samples (E; □, 5 mmol/l glucose; ▪, 8 mmol/l glucose;
  , 8 mmol/l glucose + 15 μmol/l 1-Akp;
  , 8 mmol/l glucose + 15 μmol/l 1-Akp + 100 nmol/l rapamycin). **P < 0.01 and ***P < 0.001 denote significant differences between the bracketed conditions.
As shown in Fig. 3B, human islets exposed to 15 μmol/l 1-Akp mimicked the stimulatory effects of LiCl on cell cycle progression (Fig. 3A) in a rapamycin-sensitive manner. There was no detection of increased apoptosis under these conditions as shown in Fig. 3B.
In Fig. 3C, an increase in glucose from 5 to 8 mmol/l failed to exert any significant effects on G0/G1, S, or G2/M phases in human islets. In contrast, exposure of human islets to 8 mmol/l glucose plus 15 μmol/l 1-Akp significantly decreased cells in G0/G1 and increased cells in S phase with no change in G2/M. All of these changes were blocked by rapamycin.
In Fig. 3D, exposure of rat islets to 10 mmol/l LiCl at 5 mmol/l glucose resulted in a significant decrease of cells in G0/G1 phase, an increase of cells in S phase, and a retention of cells in G2/M. Exposure of rat islets to an increase of glucose from 5 to 8 mmol/l alone produced a greater change from G0/G1 to S phase than LiCl at 5 mmol/l glucose. This effect of 8 mmol/l glucose on cell cycle progression was further increased by LiCl. This demonstrates the striking effect of glucose on cell cycle progression in rat islets in contrast to human islets (Fig. 3C). In Fig. 3E, exposure of rat islets to 8 mmol/l glucose compared with 5 mmol/l glucose resulted in a significant decrease of cells in Go/G1 phase and an increase of cells in S phase that was further increased by 1-Akp in a rapamycin-sensitive manner.
Effects of lithium and 1-Akp on insulin secretion and content.
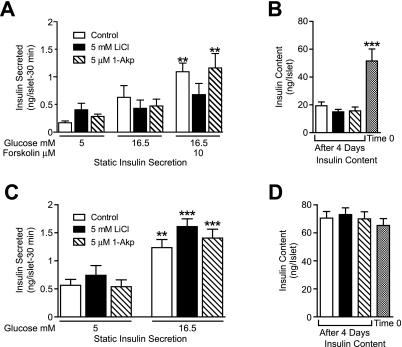
Figure 4A shows that after 4 days, human islets in all three treatment groups fail to significantly increase insulin secretion in response to 16.5 mmol/l glucose. The addition of forskolin, to increase cAMP concentrations, in combination with 16.5 mmol/l glucose significantly increased insulin secretion in control and 1-Akp–treated islets but not with LiCl treatment. Total islet insulin content on day 4 (Fig. 4B) was significantly reduced compared with time 0 in all three treatment conditions, however, there were no differences between the treatment groups on day 4. In contrast, rat islets (Fig. 4C) secrete insulin in response to glucose in all three treatment conditions, and no significant difference in insulin content between treatment groups or reduction from time 0 to day 4 was seen (Fig. 4D).
FIG. 4.
Glucose-stimulated insulin secretion and insulin content in human and rat islets. Human (A and B) or rat (C and D) islets were cultured in CMRL-1066 medium containing 10% FBS, 8 mmol/l glucose ± LiCl or 1-Akp as indicated. At the end of 4 days, islets were incubated for 1 h in CMRL containing 5 mmol/l glucose and then four to eight aliquots of 10 islets were counted for each treatment group. Islets were preincubated for 30 min in CMRL (5 mmol/l glucose), and medium was replaced with CMRL 5, 16.5 mmol/l glucose, or 16.5 mmol/l glucose + 10 μmol/l forskolin for 30 min. Supernatants and islet insulin content were assayed by radioimmunoassay. Insulin content from three to four aliquots of 10 islets was also measured at the start of the incubation period (Time 0). Data are the means ± SE from n = 3 experiments with duplicate or quadruplicate samples in each experiment. A and C: **P < 0.01 and ***P < 0.001 indicate significant differences from 5 mmol/l glucose alone or with LiCl or 1-Akp. B: ***P < 0.001 indicates significant differences between Time 0 and 4-day incubation with 8 mmol/l glucose alone or with LiCl or 1-Akp.
Effects of glucose and GSK-3 inhibitors on β-cell proliferation in human islets.
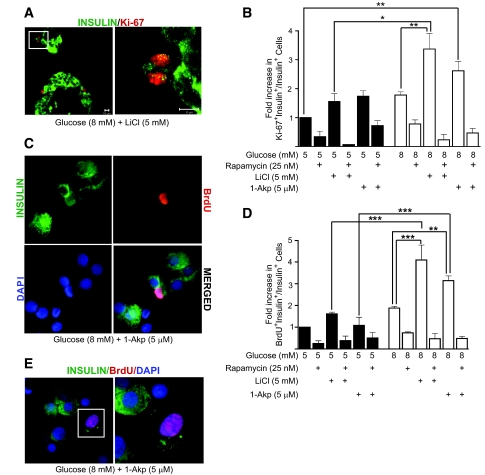
Figure 5B demonstrates that human islets treated with 5 mmol/l LiCl or 5 μmol/l 1-Akp in the presence of 5 or 8 mmol/l glucose alone did not significantly increase the number of Ki-67+/insulin+ cells compared with 5 mmol/l glucose alone. However, combinations of 8 mmol/l glucose with either LiCl or 1-Akp show significant increases in Ki-67+/insulin+ cells compared with basal glucose. Glucose (8 mmol/l) plus LiCl significantly increased the number of Ki-67+/insulin+ cells compared with that of 8 mmol/l glucose alone or 5 mmol/l glucose plus LiCl. A fourfold increase in proliferating β-cells was noted in human islets treated with 8 mmol/l glucose plus LiCl (0.71 ± 0.3%) in contrast to 5 mmol/l glucose plus LiCl (0.168 ± 0.08%). Rapamycin treatment resulted in significantly fewer Ki-67+/insulin+ cells in all treatment conditions. Figure 5D shows that glucose and GSK-3 inhibitors have a similar effect on BrdU labeling in β-cells as observed with Ki-67. Glucose (8 mmol/l) plus LiCl or 1-Akp also significantly increased the number of BrdU+/insulin+ cells compared with that of 8 mmol/l glucose alone or 5 mmol/l glucose plus LiCl or 1-Akp. Figure 5A (left) is a representative confocal image of two paraffin-embedded intact human islets showing colocalization of Ki-67+ (red nuclei) and insulin+ (green cytoplasm) cells. Figure 5A, right panel (inset from left panel) is a Z-Stack image magnified to confirm colocalization of Ki-67 and insulin in two adjacent β-cells or a dividing β-cell. Figure 5C is a representative image of dispersed human β-cells stained for insulin and BrdU.
FIG. 5.
Lithium and 1-Akp in combination with glucose stimulates β-cell proliferation in human islets. A: Representative confocal image of paraffin-embedded intact human islets treated for 4 days with 8 mmol/l glucose and 5 mmol/l lithium. Image on the left was captured at 40×/1.3 oil objective showing nuclear Ki-67 expression (red) in insulin+ β-cells (green). On the right (from inset on top left) is a Z-Stack image taken at fivefold magnification to display confirmed colocalization of Ki-67 (red nuclei) and insulin (green cytoplasm) in two adjacent β-cells or a dividing β-cell. C: Representative immunofluorescent image of β-cell proliferation in dispersed islet cells treated for 4 days with 8 mmol/l glucose with 5 μmol/l 1-Akp as measured by BrdU incorporation (red nucleus) in insulin+ β-cells (green cytoplasm). Nuclei were stained with DAPI (blue). BrdU+ β-cell in the merged image is seen as a pink nucleus surrounded by green cytoplasm. B and D: Fold increase (with respect to 5 mmol/l glucose) in the ratio of proliferating β-cells to total number of insulin+ β-cells. Data presented are the mean ± SE of three independent experiments, with duplicate samples. For each group, ∼18,000 β-cells counted. E: Representative image of a poorly granulated β-cell showing BrdU incorporation (pink nucleus). On the right is a magnified image of the inset. B and D: *P < 0.05, **P < 0.01, and ***P < 0.001 indicate significant differences between the bracketed conditions. (Please see http://dx.doi.org/10.2337/db07-1208 for a high-quality digital representation of this figure.)
GSK-3 and mTOR signaling in human islets.
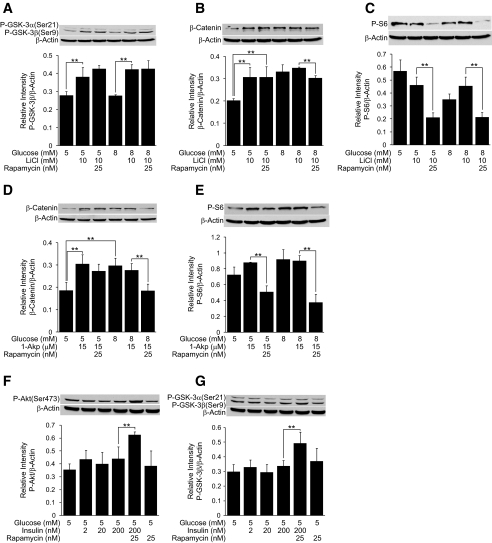
Figure 6A demonstrates that 10 mmol/l LiCl stimulates the phosphorylation of GSK-3β at both 5 and 8 mmol/l glucose in human islets. As shown in Fig. 6B, LiCl increases accumulation of β-catenin, a downstream target of GSK-3, at 5 mmol/l glucose that is consistent with GSK-3 inhibition. An increase in glucose from 5 to 8 mmol/l also increases β-catenin accumulation. LiCl fails to further enhance β-catenin accumulation above 8 mmol/l glucose. Although the stimulatory effect of LiCl on GSK-3β phosphorylation at basal glucose is rapamycin insensitive, the stimulatory effects of intermediate glucose in enhancing β-catenin accumulation revealed a small degree of rapamycin sensitivity. In Fig. 6C, an increase in glucose from 5 to 8 mmol/l failed to exert any significant effects on S6 phosphorylation, an indicator of mTOR activation, and 10 mmol/l LiCl was also ineffective. However, S6 phosphorylation was rapamycin sensitive.
FIG. 6.
GSK-3 and mTOR signaling in human islets. A–G: Human islets (100) were treated for 30 min in CMRL-1066 medium containing 0.1% BSA, 5 or 8 mmol/l glucose ± rapamycin, insulin (F and G), LiCl (A–C), or 1-Akp (D and E). Samples were processed for Western blotting and quantitated by densitometry. β-Actin was used as a protein loading control. Data are the means ± SE of n = 3 experiments, except n = 2 in F. **P < 0.01 indicates significant difference between the bracketed conditions.
In Fig. 6D, 10 μmol/l 1-Akp stimulated β-catenin accumulation at basal glucose in a rapamycin-insensitive manner. Glucose (8 mmol/l) also enhanced β-catenin accumulation above 5 mmol/l glucose, and 1-Akp did not further potentiate this increase. Enhanced accumulation of β-catenin by 8 mmol/l glucose and 1-Akp was rapamycin sensitive. In Fig. 6E, 1-Akp at 5 or 8 mmol/l glucose failed to increase S6 phosphorylation, and this basal level of S6 phosphorylation was rapamycin sensitive.
We next evaluated the effects of exogenous insulin on Akt and GSK-3β. As shown in Fig. 6F, increasing insulin from 2 to 200 nmol/l at 5 mmol/l glucose was ineffective in stimulating Akt phosphorylation. However, coincubation of human islets with 200 nmol/l insulin plus rapamycin resulted in a significant phosphorylation of Akt, indicating the presence of a negative feedback inhibition of IRS signaling. This enhanced phosphorylation of Akt is consistent with an increase in the phosphorylation of GSK-3, a downstream target of Akt as shown in Fig. 6G.
GSK-3 inhibition and β-catenin nuclear translocation.
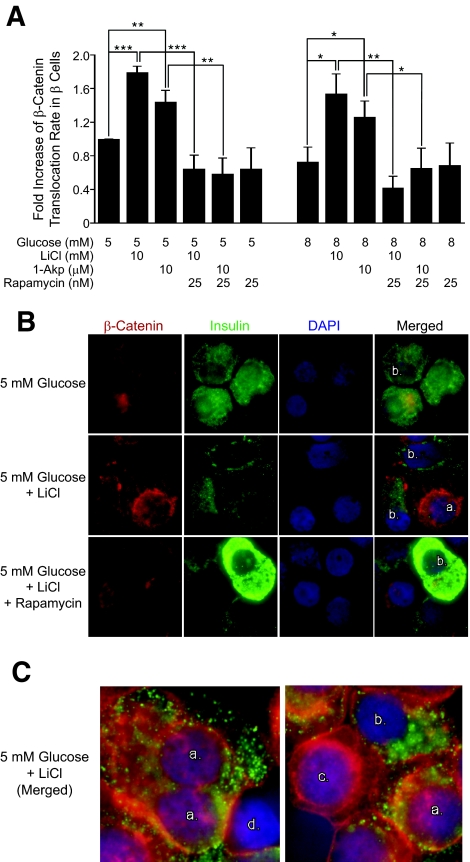
Because glucose or the GSK-3 inhibitors, LiCl and 1-Akp, increased steady-state levels of β-catenin in human islet cells, we assessed the degree of β-catenin translocation to the nucleus. Figure 7A and B indicate that 10 mmol/l LiCl and 10 μmol/l 1-Akp significantly increased nuclear translocation of β-catenin in human β-cells compared with 5 or 8 mmol/l glucose. Although increasing glucose from 5 to 8 mmol/l increased β-catenin accumulation (Fig. 6B and D), this did not result in the translocation of β-catenin to the nucleus. Unexpectedly, 25 nmol/l rapamycin strikingly blocked the increase in β-catenin translocation to the nucleus of human islet β-cells in the presence of lithium or 1-Akp. Human β-cells (green cytoplasm) were identified as positive for β-catenin nuclear translocation if nuclei were purple (combination of DAPI blue and β-catenin red). This staining pattern for nuclear β-catenin was also reported by Yi et al. (25).
FIG. 7.
Translocation of β-catenin in human islets. A: Fold increase in β-catenin nuclear translocation/insulin+ cells with respect to 5 mmol/l glucose. Data presented are the means ± SE of three independent experiments. For each group per experiment, ∼5,000–6,000 β-cells were counted. *P < 0.05, **P < 0.01, and ***P < 0.001 denote significant differences between the bracketed conditions. B: Representative immunofluorescent images of human islets treated for 1 day with 5 mmol/l glucose and 5 mmol/l LiCl ± 25 nmol/l rapamycin then dispersed into single cells and stained. Red, cytoplasmic β-catenin; purple center with red ring, translocated nuclear β-catenin; green, insulin+ β-cells. Nuclei were stained with DAPI (blue). C: Examples of cellular immunostaining used for quantitation criteria of nuclear β-catenin staining in β-cells. a: insulin positive (green cytoplasm), nuclear β-catenin positive (purple nucleus). b: insulin positive (green cytoplasm), nuclear β-catenin negative (blue nucleus). c: insulin negative, nuclear β-catenin positive (purple nucleus; red nuclear ring). d: insulin negative, nuclear β-catenin negative (blue nucleus). (Please see http://dx.doi.org/10.2337/db07-1208 for a high-quality digital representation of this figure.)
DISCUSSION
The focus of this study was to identify signaling pathways and potential therapeutic agents that would allow reproducible stimulation of DNA synthesis, cell cycle progression, and proliferation in human β-cells. We found that glucose, mTOR activity, and inhibition of GSK-3 together stimulated these regenerative processes in a highly reproducible manner in adult human β-cells regardless of sex, age, BMI, or isolation center.
Both LiCl and 1-Akp significantly enhanced DNA synthesis above that of 8 mmol/l glucose, and LiCl-mediated DNA synthesis was more sensitive to rapamycin than 1-Akp. This finding suggested that a component of 1-Akp–stimulated DNA synthesis in human islets is mTOR independent. Although lithium at higher concentrations decreased DNA synthesis in human islets, this did not appear to be due to apoptosis because cell cycle analysis (Fig. 3A and B) failed to detect a significant degree of apoptosis under similar conditions. Mussmann et al. (18) reported that lithium produces toxic effects at concentrations >3 mmol/l in the cell line, INS-1E, but this is not the case in human or rodent islets. Our studies also determined that the increase in DNA synthesis induced by lithium and 1-Akp in human islets was not due to the effects of endogenous insulin through the insulin signaling pathway (Fig. 2A).
At basal glucose, lithium and 1-Akp produced a similar magnitude of entry of human and rat islet cells into the cell cycle. Human islet cells did not enter the cell cycle in response to 8 mmol/l glucose but required GSK-3 inhibition. In contrast, rat islets cells entered the cell cycle in response to 8 mmol/l glucose, which was further increased by both lithium and 1-Akp.
Although human islets treated for 4 days with 8 mmol/l glucose ± 1-Akp secreted insulin in response to 16.5 mmol/l glucose plus forskolin, a significant loss of insulin content in human islets occurred as a consequence of the 4-day culture in all treatment conditions. Efrat and colleagues (26) found that expanding dispersed human islets resulted in lower levels of insulin content, but subsequent treatment with β-cellulin resulted in redifferentiation with restoration of β-cell gene expression and insulin content. Although our treatment conditions enhance expansion of human β-cells, this strategy alone may not be optimal to maintain or restore differentiation. Our immunohistochemical analysis of the colocalization of Ki-67 or BrdU with insulin has provided insights into this objective. A number of human β-cells positive for Ki-67 or BrdU had only a few insulin granules in the cytoplasm (Fig. 5E). Such poorly granulated cells were not included in our proliferation data, which may be an underestimation of actual human β-cell proliferation. This population of β-cells will be the focus of future studies aimed at maintaining or restoring insulin gene expression.
Studies also focused on gaining insights into the signaling mechanism whereby GSK-3 inhibition affects DNA synthesis, cell cycle progression, and proliferation in a rapamycin-sensitive manner. We observed that GSK-3 inhibition, in the presence of 5 or 8 mmol/l glucose, resulted in increases in β-catenin accumulation and translocation, whereas an increase in glucose concentration alone results only in β-catenin accumulation. The increase in β-catenin accumulation due to an increase in glucose concentration showed a small degree of rapamycin sensitivity. Importantly, β-catenin translocation in response to GSK-3 inhibition was significantly rapamycin sensitive and may represent an important mechanism responsible for the ability of rapamycin to inhibit DNA synthesis, cell cycle progression, and β-cell proliferation. Recent studies proposed that β-catenin signaling is both necessary and sufficient for β-cell proliferation in mouse islets (27) and that overexpression of GSK-3 in mice reduces β-cell mass (28). However, these studies did not address the role of mTOR in combination with β-catenin signaling as a requirement for rodent β-cell proliferation. In addition, Wnt3a treatment failed to stimulate human β-cell proliferation (27), suggesting that a more direct inhibition of GSK-3 may be required for β-catenin translocation. Mussmann et al. (18) demonstrated that GSK-3 inhibitors, 1-Akp and CHIR99021, promoted rat β-cell replication over the range of 1–20 μmol/l after 72-h incubation. These studies did not examine the effects of these inhibitors or the contribution of the nutrient glucose and the mTOR pathway in promoting human β-cell proliferation.
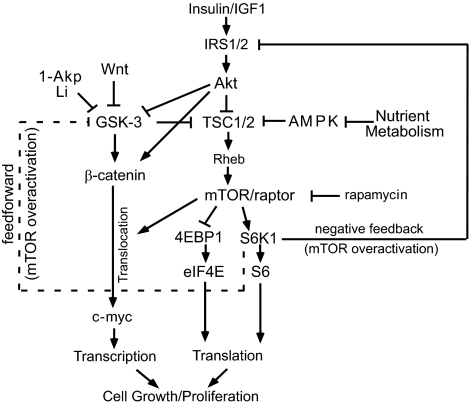
Recent studies by Inoki et al. (29) and Jin et al. (30) have identified in non–β-cells a key role for GSK-3, in a β-catenin–independent manner, to regulate mTOR signaling. They suggest that enhanced GSK-3 and AMP-activated protein kinase (AMPK) activities cooperate in the activation of TSC2 to inhibit mTOR activity. Collectively, their studies indicate that inhibition of GSK-3 is required for mTOR activation. Thus, we next examined whether GSK-3 inhibition has a positive effect on mTOR activation in human islets. GSK-3 inhibition exerted inconsistent and small effects on mTOR signaling in the presence of 5 or 8 mmol/l glucose (Fig. 6C and E). In the absence of glucose, GSK-3 inhibitors resulted in a small increase in S6 phosphorylation (data not shown). As shown in Fig. 8, both phosphorylation of GSK-3 and a decrease in AMPK due to increased nutrient metabolism play a key role in inhibiting TSC1/2 and in turn activate the mTOR pathway. Although our data demonstrate the existence of this pathway in primary islets, it is unclear at this point what role GSK-3 plays in mTOR regulation.
FIG. 8.
Proposed model involving GSK-3 inhibition and the mTOR pathway to stimulate human β-cell growth and proliferation. Increased nutrient metabolism inhibits AMPK activity, and LiCl or 1-Akp directly inhibits GSK-3. This blocks TSC1/2, resulting in mTOR activation and signaling to 4EBP1 and S6K1. An increased glucose concentration and/or GSK-3 inhibition results in increases in β-catenin steady-state levels. Direct inhibition of GSK-3 with LiCl or 1-Akp mediates β-catenin nuclear translocation that is rapamycin sensitive. Overactivation of mTOR/S6K1 results in feedback inhibition of IRS1/2 and Akt signaling. Overactivation of mTOR/S6K1 may also provide a feedforward mechanism that inhibits GSK-3 and increases in β-catenin steady-state levels but does not result in nuclear translocation (dashed line indicates a proposed pathway). AMPK, AMP-activated protein kinase; Rheb, Ras homolog enriched in brain; TSC, tuberous sclerosis complexes 1 and 2.
In contrast, mTOR exerts multiple effects on GSK-3 signaling in human β-cells (Fig. 8). Chronic overactivation of mTOR/S6K1 leads to a negative feedback of the insulin signaling pathway and reduced Akt phosphorylation and indirectly activates GSK-3. Insulin dose responses (Figs. 2 and 6F and G) revealed that human islets failed to signal through the insulin signaling cascade. This suggests that under these in vitro conditions, human islets exhibit a relatively high level of insulin resistance. Furthermore, rapamycin restores insulin sensitivity, suggesting that even basal levels of mTOR activation sufficiently engage feedback inhibition of the insulin signaling cascade in human islets, resulting in insulin resistance. Zhang et al. (31) propose that mTOR-dependent feedback inhibition of Akt may also result in a feedforward mechanism to regulate GSK-3 in the absence of Akt input. Although our studies show that 8 mmol/l glucose increases β-catenin accumulation, suggesting that this feedforward mechanism may regulate GSK-3/β-catenin in human islets, it is unclear why this does not result in detectable β-catenin nuclear translocation.
Significant findings reported here are the synergistic effects of 8 mmol/l glucose and GSK-3 inhibition to enhance human β-cell proliferation. In addition, the rapamycin sensitivity of β-catenin nuclear translocation may explain, in part, the mechanism whereby rapamycin inhibits these regenerative processes. Our data suggest that although mTOR activity is necessary, even basal levels may result in engagement of negative feedback from S6K1 and result in a relatively high constitutive level of GSK-3 activity in human islets in vitro. This may explain the need for direct inhibition of GSK-3 with therapeutic agents. Overall, these studies suggest that appropriate regulation of mTOR and GSK-3/β-catenin signaling in combination with strategies to maintain or restore differentiation may provide available approaches to expand human β-cell mass.
Acknowledgments
M.L.M. has received NIH Grants DK-006181 and DK-07296 and American Diabetes Association Grant 7-04-MN-32. The Washington University Diabetes Research and Training Center has received NIH Grant DK-56341.
No potential conflicts of interest relevant to this article were reported.
Human islets were obtained from NIH-sponsored ICR Basic Science Islet Distribution Program Centers [City of Hope, Southern California Islet Consortium, University of Wisconsin, University of Illinois (Chicago), University of Minnesota, University of Miami, University of Pennsylvania, University of Alabama (Birmingham), Northwestern University, and Washington University) and from the JDRF Human Islet Distribution Program at Washington University. Insulin radioimmunoassays were performed by the Washington University Diabetes Research and Training Center. The Washington University Department of Pathology and Immunology Research Histology and Tissue Microarray Core Laboratory prepared paraffin sections. We thank Drs. Joseph Corbo, Andrey Shaw, and Mark J. Miller for microscopy assistance.
Parts of this study were presented in poster form at the 67th Scientific Sessions of the American Diabetes Association 67th Scientific Sessions, Chicago, Illinois, 22–26 June 2007.
Published ahead of print at http://diabetes.diabetesjournals.org on 10 December 2008.
H.L., M.S.R., and K.L.P. contributed equally to this work.
The contents of this work are solely the responsibility of the authors and do not necessarily represent the official views of the National Institutes of Health (NIH) or American Diabetes Association (ADA).
The costs of publication of this article were defrayed in part by the payment of page charges. This article must therefore be hereby marked “advertisement” in accordance with 18 U.S.C. Section 1734 solely to indicate this fact.
REFERENCES
- 1.Rhodes CJ: Type 2 diabetes: a matter of β-cell life and death? Science 307: 380–384, 2005 [DOI] [PubMed] [Google Scholar]
- 2.Weir GC, Bonner-Weir S: Five stages of evolving β-cell dysfunction during progression to diabetes. Diabetes 53 (Suppl. 3): S16–S21, 2004 [DOI] [PubMed] [Google Scholar]
- 3.Dor Y, Brown J, Martinez OI, Melton DA: Adult pancreatic β-cells are formed by self-duplication rather than stem-cell differentiation. Nature 429: 41–46, 2004 [DOI] [PubMed] [Google Scholar]
- 4.Teta M, Rankin MM, Long SY, Stein GM, Kushner JA: Growth and regeneration of adult beta-cells does not involve specialized progenitors. Dev Cell 12: 817–826, 2007 [DOI] [PubMed] [Google Scholar]
- 5.McDaniel ML, Marshall CA, Pappan KL, Kwon G: Metabolic and autocrine regulation of the mammalian target of rapamycin by pancreatic β-cells. Diabetes 51: 2877–2885, 2002 [DOI] [PubMed] [Google Scholar]
- 6.Harris TE, Lawrence JC Jr: TOR signaling. Sci STKE 212, re15, 2003 [DOI] [PubMed] [Google Scholar]
- 7.Hay N, Sonenberg N: Upstream and downstream of mTOR. Genes Dev 18: 1926–1945, 2004 [DOI] [PubMed] [Google Scholar]
- 8.Fingar DC, Blenis J: Target of rapamycin (TOR): an integrator of nutrient and growth factor signals and coordinator of cell growth and cell cycle progression. Oncogene 23: 3151–3171, 2004 [DOI] [PubMed] [Google Scholar]
- 9.Pende M, Kozma SC, Jaquet M, Oorschot V, Burcelin R, Le Marchand-Brustel Y, Klumperman J, Thorens B, Thomas G: Hypoinsulinaemia, glucose intolerance and diminished β-cell size in S6K1-deficient mice. Nature 408: 994–997, 2000 [DOI] [PubMed] [Google Scholar]
- 10.Lee C-H, Inoki K, Guan K-L: mTOR pathway as a target in tissue hypertrophy. Annu Rev Pharmacol Toxicol 47: 443–467, 2007 [DOI] [PubMed] [Google Scholar]
- 11.Um SH, D'Alessio, Thomas G: Nutrient overload, insulin resistance, and ribosomal protein S6 kinase 1, S6K1. Cell Metabolism 3: 393–402, 2006 [DOI] [PubMed] [Google Scholar]
- 12.Frame S, Cohen P: GSK3 takes centre stage more than 20 years after its discovery. Biochem J 359: 1–16, 2001 [DOI] [PMC free article] [PubMed] [Google Scholar]
- 13.Kockeritz L, Doble B, Patel S, Woodgett JR: Glycogen synthase kinase-3: an overview of an over-achieving protein kinase. Curr Drug Targets 7: 1377–1388, 2006 [DOI] [PubMed] [Google Scholar]
- 14.Jope RS, Yuskaitis CJ, Beurel E: Glycogen synthase kinase-3 (GSK3): inflammation, diseases, and therapeutics. Neurochem Res 32: 577–595, 2007 [DOI] [PMC free article] [PubMed] [Google Scholar]
- 15.Stambolic V, Ruel L, Woodgett JR: Lithium inhibits glycogen synthase kinase-3 activity and mimics wingless signalling in intact cells. Curr Biol 6: 1664–1668, 1996 [DOI] [PubMed] [Google Scholar]
- 16.Klein P, Melton DA: A molecular mechanism for the effect of lithium on development. Proc Natl Acad Sci U S A 93: 8455–8459, 1996 [DOI] [PMC free article] [PubMed] [Google Scholar]
- 17.Phiel CJ, Klein PS: Molecular targets of lithium action. Annu Rev Pharmacol Toxicol 41: 789–813, 2001 [DOI] [PubMed] [Google Scholar]
- 18.Mussmann R, Geese M, Harder F, Kegel S, Andag U, Lomow A, Burk U, Onichtchouk D, Dohrmann C, Austen M: Inhibition of GSK3 promotes replication and survival of pancreatic beta cells. J Biol Chem 282: 12030–12037, 2007 [DOI] [PubMed] [Google Scholar]
- 19.Cohen P, Goedert M: GSK3 inhibitors: development and therapeutic potential. Nat Rev Drug Discov 3: 479–487, 2004 [DOI] [PubMed] [Google Scholar]
- 20.Kwon G, Marshall CA, Liu H, Pappan KL, Remedi MS, McDaniel ML: Glucose-stimulated DNA synthesis through mammalian target of rapamycin (mTOR) is regulated by KATP channels: effects on cell cycle progression in rodent islets. J Biol Chem 281: 3261–3267, 2006 [DOI] [PubMed] [Google Scholar]
- 21.Xu G, Kwon G, Cruz WS, Marshall CA, McDaniel ML: Metabolic regulation by leucine of translation initiation through the mTOR-signaling pathway by pancreatic β-cells. Diabetes 50: 353–360, 2001 [DOI] [PubMed] [Google Scholar]
- 22.Xu G, Kwon G, Marshall CA, Lin T-A, Lawrence JC Jr, McDaniel ML: Branched-chain amino acids are essential in the regulation of PHAS-I and p70 S6 kinase by pancreatic β-cells: a possible role in protein translation and mitogenic signaling. J Biol Chem 273: 28178–28184, 1998 [DOI] [PubMed] [Google Scholar]
- 23.Kwon G, Marshall CA, Pappan KL, Remedi MS, McDaniel ML: Signaling elements involved in the metabolic regulation of mTOR by nutrients, incretins, and growth factors in islets. Diabetes 53 (Suppl. 3): S225–S232, 2004 [DOI] [PubMed] [Google Scholar]
- 24.Sjoholm A, Welsh N, Hellerstrom C: Lithium increases DNA replication, polyamine content, and insulin secretion by rat pancreatic β-cells. Am J Physiol Cell Physiol 262: C391–C395, 1992 [DOI] [PubMed] [Google Scholar]
- 25.Yi F, Sun J, Lim GE, Fantus G, Brubaker PL, Jin T: Cross talk between the insulin and Wnt signaling pathways: evidence from intestinal endocrine L cells. Endocrinology 149: 2342–2351, 2008 [DOI] [PubMed] [Google Scholar]
- 26.Ouziel-Yahalom L, Zalzman M, Anker-Kitai L, Knoller S, Bar Y, Glandt M, Herold K, Efrat S: Expansion and redifferentiation of adult human pancreatic islet cells. Biochem Biophys Res Commun 341: 291–298, 2006 [DOI] [PubMed] [Google Scholar]
- 27.Rulifson IC, Karnik SK, Heiser PW, ten Berge D, Chen H, Gu X, Taketo MM, Nusse R, Hebrok M, Kim SK: Wnt signaling regulates pancreatic β-cell proliferation. Proc Natl Acad Sci U S A 104: 6247–6252, 2007 [DOI] [PMC free article] [PubMed] [Google Scholar]
- 28.Liu Z, Tanabe K, Bernal-Mizrachi E, Permutt MA: Mice with beta cell overexpression of glycogen synthase kinase-3β have reduced beta cell mass and proliferation. Diabetologia 51: 623–631, 2008 [DOI] [PubMed] [Google Scholar]
- 29.Inoki K, Ouyang H, Zhu T, Lindvall C, Wang Y, Zhang X, Yang Q, Bennett C, Harada Y, Stankunas K, Wang C, He X, MacDougald OA, You M, Williams BO, Guan K-L: TSC2 integrates Wnt and energy signals via a coordinated phosphorylation by AMPK and GSK3 to regulate cell growth. Cell 126: 955–968, 2006 [DOI] [PubMed] [Google Scholar]
- 30.Jin T, Fantus G, Sun J: Wnt and beyond Wnt: multiple mechanisms control the transcriptional property of β-catenin. Cell Signal 20: 1697–1704, 2008 [DOI] [PubMed] [Google Scholar]
- 31.Zhang HH, Lipovsky AI, Dibble CC, Sahin M, Manning BD: S6K1 regulates GSK3 under conditions of mTOR-dependent feedback inhibition of Akt. Mol Cell 24: 185–197, 2006 [DOI] [PMC free article] [PubMed] [Google Scholar]


