

Abstract
Observational studies have shown that the use of angiotensin-converting enzyme (ACE) inhibitors is associated with the maintenance of greater muscle strength and physical performance in older subjects. However, the mechanism that underlies these beneficial effects remains poorly understood. Because ACE inhibitors block the production of angiotensin II, which is a potent inhibitor of insulin-like growth factor-1 (IGF-1) production, it was hypothesized that treatment with ACE inhibitors is associated with higher levels of IGF-1. This hypothesis was tested in 745 subjects (417 women, 328 men) enrolled in the Invecchiare in Chianti study. Of these, 160 were receiving ACE inhibitors. The association between ACE inhibitor use and serum IGF-1 was tested by linear regression models. After adjusting for multiple potential confounders, serum levels of total IGF-1 were significantly higher in participants receiving ACE inhibitors (mean ± SD 129.0 ± 56.1 ng/ml) compared with the rest of the study population (mean ± SD 116.5 ± 54.8 ng/ml) (p <0.001). Participants with short (<3 years) and long (3 to 9 years) treatment durations had higher serum IGF-1 levels than participants who were not receiving ACE inhibitor treatment, but the difference was statistically significant only for the short-duration group (p <0.05). In conclusion, in older subjects, treatment with ACE inhibitors for <3 years is associated with significantly higher levels of IGF-1. This may be 1 of the mechanisms by which ACE inhibitors might slow the decreases in muscle strength and physical function that are often observed in older subjects.
Preclinical data have shown that angiotensin-converting enzyme (ACE) inhibition leads to a substantial reduction in angiotensin II tissue levels. In experimental animals, the infusion of angiotensin II produces muscle wasting and weight loss, independent of any change in blood pressure, possibly by inhibiting the production of insulin-like growth factor-1 (IGF-1),1 which is an important correlate of muscle strength and power in the older population.2,3
Consistent with this hypothesis, the upregulation of muscle-specific IGF-1 genes prevents angiotensin II–induced muscle wasting.4 Therefore, we hypothesized that ACE inhibitor use, by inhibiting angiotensin II, is associated with higher IGF-1 levels.
Methods
Study population
The Invecchiare in Chianti (InCHIANTI) study is a population-based epidemiologic study performed in Greve in Chianti and Bagno a Ripoli, 2 small towns in the Tuscany region of Italy. The study design was approved by the Italian National Institute of Research and Care on Aging Review Board. In 1998, 1,260 subjects aged ≥65 years were randomly selected from the population registries of the 2 municipalities. Of these, 1,154 (89%) agreed to be enrolled in the project. Participants received an extensive description of the study and agreed to participate in the project.5
The final analysis was performed in 745 participants (417 women, 328 men) who had complete data on drug use, serum total IGF-1 and total testosterone levels, and multiple covariates potentially relevant for this analysis (Table 1).
Table 1.
Characteristics of the study population according to angiotensin-converting enzyme inhibitor use in men and women
| Variable | Men (n = 328) ACE Inhibitor |
Women (n = 417) ACE Inhibitor |
||
|---|---|---|---|---|
| Nonusers (n = 264) |
Users (n = 64) |
Nonusers (n = 32) |
Users (n = 96) |
|
| Total IGF-1 (ng/ml)* | 129 ± 55 | 147 ± 59‡ | 106 ± 52 | 117 ± 51† |
| Age (yrs)* | 73.1 ± 6.4 | 74.2 ± 7.4‡ | 74.2 ± 7.0 | 76.5 ± 6.5† |
| Body mass index (kg/m2)* | 27.1 ± 3.3 | 26.9 ± 3.3 | 27.6 ± 4.4 | 28.4 ± 4.9 |
| Caloric intake (kcal/d)* | 2,208 ± 560 | 2,091 ± 580‡ | 1,752 ± 470 | 1,720 ± 522 |
| Smoking (pack = yrs)* | 23.05 ± 23.0 | 25.3 ± 24.8† | 2.7 ± 8.0 | 3.1 ± 11.7 |
| Alcohol (g/d)* | 25.8 ± 27.6 | 19.2 ± 20.8 | 7.0 ± 9.5 | 6.7 ± 10.7 |
| Hemoglobin (g/dl)* | 14.5 ± 1.1 | 14.3 ± 1.3 | 13.3 ± 1.0 | 13.3 ± 1.1 |
| Creatinine clearance (ml/24 h)* | 86.3 ± 24.3 | 82.9 ± 25.7 | 69.7 ± 20.7 | 67.1 ± 24.3 |
| Physical activity | ||||
| Sedentary | 23 (8.7%) | 3 (4.9%) | 71 (23.0%) | 20 (22%) |
| Light | 235 (89.0%) | 57 (93.4%) | 237 (76.7%) | 70 (76.9%) |
| Moderate to high | 6 (2.3%) | 1 (1.6%) | 1 (0.3%) | 1 (1.1%) |
| Hypertension | 78 (37%) | 32 (50%) | 108 (41%) | 58 (60.4%)‡ |
| Cardiac heart failure | 4 (1.9%) | 9 (14.1%)‡ | 7 (2.6%) | 9 (9.4%)† |
| Stroke | 11 (5.3%) | 5 (8.0%) | 5 (2.0%) | 4 (4.2%) |
| Cancer | 12 (5.7%) | 3 (4.7%) | 25 (9.5%) | 7 (7.3%) |
| Diabetes mellitus | 26 (12.4%) | 6 (9.4%) | 25 (9.5%) | 10 (10.4%) |
| Total testosterone (ng/ml)* | 4.4 ± 1.3 | 4.2 ± 1.3† | 0.64 ± 0.30 | 0.63 ± 0.32 |
| Interleukin-6 (pg/ml) median (IQR) | 3.0 (2.0) | 3.4 (2.6) | 2.7 (1.7) | 2.7 (1.9) |
| Glutamic oxaloacetic transaminase (U/L)* | 21.9 ± 7.9 | 22.4 ± 6.9 | 20.5 ± 7.0 | 19.6 ± 6.8 |
| Glutamic pyruvic transaminase (U/L)* | 20.9 ± 11.9 | 21.8 ± 11.2 | 18.7 ± 11.4 | 18.0 ± 8.7† |
| No. of medications* | 1.5 ± 1.7 | 3.5 ± 2.1‡ | 1.9 ± 1.9 | 3.5 ± 1.8‡ |
Values are expressed as mean ± SD.
p <0.05 compared with nonusers of the same gender.
p <0.001 compared with nonusers of the same gender.
IQR = interquartile range.
None of the participants considered in the study were taking steroids, growth hormone, IGF-1, and androgens/or estrogens.
Cardiovascular drugs
During the home interview, participants were asked to show the containers for prescription and nonprescription drugs taken regularly over the previous 2 weeks. Drugs used were coded by the Anatomical, Therapeutic and Chemical classification system, and information was collected on specific molecules, average daily doses, and times of treatment. For this analysis, cardiovascular drugs were coded as ACE inhibitors (captopril, benazepril, perindopril, enalapril, fosinopril, moexipril, quinapril, ramipril, lisinopril, delapril, cilazapril, and trandolapril), angiotensin type 1 receptor blockers (losartan and valsartan), calcium channel blockers, nitrates, β-adrenergic antagonists, central nervous system–acting antihypertensives, and diuretics.
One hundred sixty participants (96 women, 64 men) who reported using ACE inhibitors regularly for ≥2 weeks were considered ACE inhibitor users, whereas all the others were considered nonusers. The duration of ACE inhibitor treatment ranged from 2 weeks to 9 years. Twelve participants (9 women, 3 men) were taking angiotensin type 1 receptor blockers.
Hormone and cytokine assays
Fasting blood samples drawn from 7 to 8 a.m. were immediately processed, and 0.5-ml serum aliquots were stored at −80°C until analysis. Serum concentrations of total IGF-1 were measured in duplicate from frozen specimens by immunoradiometric assay, using commercial reagents (Diagnostic Systems Laboratories Corporation, Webster, Texas). Inter- and intra-assay coefficients of variation for 3 concentrations (low, medium, high) were all <10%. Total testosterone was assayed using commercial radioimmunologic kits (Diagnostic Systems Laboratories Corporation). For total testosterone, the minimum detection limit was 0.03 nmol/L; intra- and interassay coefficients of variation for 3 different concentrations were 9.6%, 8.1%, and 7.8% and 8.6%, 9.1%, and 8.4%, respectively.6 Serum levels of interleukin-6 were measured in duplicate by high-sensitivity enzyme-linked immunosorbent assays using commercial kits (Biosource International, Camarillo, California). The lower detectable limit was 0.1 pg/ml, with an interassay coefficient of variation of 7%.7
Assessment of covariates
Weight (kilograms) was measured using a high-precision mechanical scale. Standing height was measured to the nearest 0.1 cm. Body mass index was calculated as weight (kilogram) divided by height (meters) squared. Past physical activity was estimated from self-reports of recreational and work-related physical activities performed for ≥6 months over the previous years. Physical activity in the year before the interview was estimated from responses to multiple questions and coded as (1) sedentary: completely inactive or performing light-intensity physical activity (i.e., walking, light housework) <1 hour/week; (2) light physical activity: light-intensity physical activity 2 to 4 hours/week; or (3) moderate to high physical activity: light physical activity ≥5 hours/week or moderate physical activity (i.e., gymnastics, playing soccer, gardening) ≥1 to 2 hours/week. Average daily total energy (kilocalories) and alcohol intake (grams) were estimated by the European Prospective Investigation Into Cancer and Nutrition food frequency questionnaire.8 Participants were asked about present and past smoking habits, and pack-years, a measure of smoking exposure that combines intensity and duration, was calculated as packs smoked per day times years of smoking. Liver function was evaluated by glutamic oxaloacetic transaminase and glutamic pyruvic transaminase. Kidney function was assessed by creatinine clearance. Creatinine excretion was measured in 24-hour urine. Hemoglobin levels were analyzed within 6 hours using the autoanalyzer Sysmex SE-9000 (Sysmex Corporation, Kobe, Japan). The presence of selected medical conditions (diabetes, chronic heart failure, hypertension, cancer, stroke) was ascertained according to standard, pre-established criteria that combined information from self-reported physician diagnosis, current pharmacologic treatment, medical records, clinical examinations, and blood tests. Diagnostic algorithms were modified versions of those created for the Women’s Health and Aging Study.9
Statistical analysis
Variables are reported as mean values ± SDs. Differences in total IGF-1 between ACE inhibitor users and nonusers were tested using Student’s t test. To approximate normal distributions, log-transformed values for interleukin-6 were used in the analysis. The independent association of ACE inhibitors with IGF-1 was tested using linear multivariate regression models adjusted for potential confounders, including age, gender, body mass index, physical activity, smoking, alcohol and caloric intake, total testosterone, chronic diseases, liver and kidney function, and medication use. Relative ACE inhibitor potency was calculated by multiplying the dose equivalent (in relation to captopril) by the average daily dose.10 Differences in IGF-1 serum levels according to ACE inhibition relative potency quintiles were tested in gender- and age-adjusted analysis-of-covariance models and tests for linear trends.
Differences in IGF-1 serum levels according to treatment duration were tested using general linear models adjusted for age, gender, hypertension, cardiac heart failure, hypertension, coronary heart disease, diabetes, and number of medications.
In all analyses, a p value <0.05 was considered statistically significant. All analyses were performed using the SAS statistical package version 8.2 (SAS Institute Inc., Cary, North Carolina).
Results
Characteristics of the study population
The demographic and clinical characteristics of the study sample are reported in Table 1. IGF-1 serum levels were statistically higher in participants receiving treatment with ACE inhibitors compared with nonusers (Table 1). This relation was stronger in men (p <0.001) than in women (p = 0.02) (Table 1), but the gender–ACE inhibitor interaction was not significant (data not shown). In the 2 genders, ACE inhibitor users were older, more likely to have diagnoses of congestive heart failure or hypertension, and were taking more drugs. In men only, the use of ACE inhibitors was associated with lower caloric intake, lower serum testosterone, and a greater probability of smoking (Table 1). No significant association was found between ACE inhibitor use and interleukin-6 as well as hemoglobin levels. The diagnosis of hypertension was more frequent in ACE inhibitor users, although the association was statistically significant only in women.
Association between IGF-1 and ACE inhibitor use adjusted for confounders
After adjusting for potential confounders, including age, gender, body mass index, physical activity, caloric intake, smoking, alcohol consumption, testosterone levels, and other covariates, the positive association between ACE inhibitor use and total IGF-1 remained highly significant (p <0.001; Table 2).
Table 2.
Multivariate linear regression model with total insulin-like growth factor-1 as the dependent variable*
| Independent Variable | β ± SE | p Value |
|---|---|---|
| ACE inhibitors use | 14.24 ± 4.49 | <0.001 |
| Age (yrs) | −1.57 ± 0.31 | <0.001 |
| Gender (women vs men) | −17.02 ± 8.58 | 0.05 |
| Body mass index (kg/m2) | 0.12 ± 0.54 | 0.82 |
| Caloric intake (kcal/d) | 0.01 ± 0.00 | 0.06 |
| Log interleukin-6 (pg/ml) | −0.95 ± 3.44 | 0.69 |
| Hemoglobin (g/dl) | 5.30 ± 2.04 | 0.007 |
| Total testosterone (ng/ml) | 3.13 ± 1.93 | 0.09 |
| Alcohol (g/d) | −0.12 ± 0.09 | 0.26 |
| Smoking (pack = yrs) | −0.12 ± 0.10 | 0.23 |
| Creatinine clearance (ml/24 h) | 0.04 ± 0.1 | 0.65 |
| Diabetes mellitus | 1.53 ± 6.06 | 0.98 |
| Cancer | 11.13 ± 7.06 | 0.12 |
| Congestive heart failure | 0.49 ± 2.28 | 0.91 |
| Hypertension | 7.57 ± 3.64 | 0.04 |
| Stroke | −6.01 ± 9.70 | 0.45 |
| Physical activity | ||
| Light to moderate† | 46.32 ± 15.20 | 0.002 |
| High† | 40.60 ± 14.51 | 0.005 |
| No. of medications‡ | −1.40 ± 1.07 | 0.18 |
To improve their interpretation, the regression coefficients are expressed as the percentage change in IGF-1 compared with the average serum levels, associated with 1 unit change in the independent variable.
Compared with reference, which is sedentary activity.
Including ACE inhibitors.
In bivariate and fully adjusted models, the use of calcium channel blockers, β blockers, nitrates, β-adrenergic antagonists, central nervous system–acting antihypertensives, angiotensin II type 1 receptor blockers, and diuretics was not associated with IGF-1 levels (data not shown).
ACE inhibitor potency and IGF-1 levels
Among ACE inhibitor users, there was a trend of higher total serum IGF-1 levels, according to quartiles of ACE inhibition relative potency, although after adjusting for age and gender, such a trend was not statistically significant (Figure 1).
Figure 1.
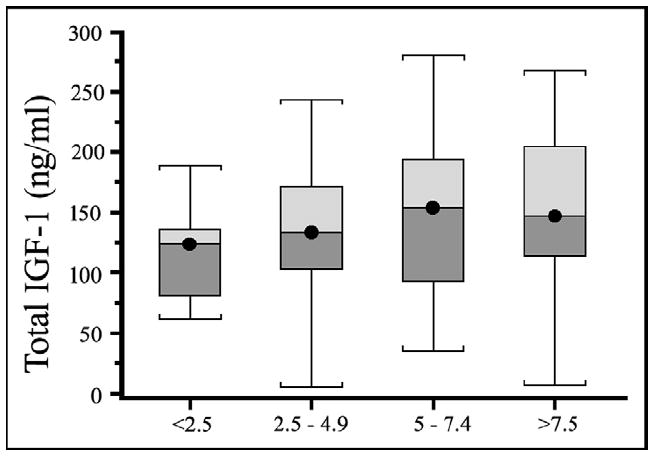
Box plots depicting total IGF-1 distributions in participants receiving treatment with ACE inhibitors by relative potency. The center line within the box indicates the median value of the distribution, and the top and bottom box limits are, respectively, the 25th and 75th percentiles. The whiskers extend to the most extreme points located with 1.5 times the interquartile distance below and above the box. The test for a trend was not statistically significant.
Duration of treatment with ACE inhibitors and IGF-1 levels
In participants receiving ACE inhibitor treatment, the IGF-1 levels progressively decreased with the length of treatment. IGF-1 serum levels were significantly higher (p <0.05) in participants who had been receiving treatment for <3 years (compared with nonusers), whereas for participants receiving ACE inhibitors for >3 years, the difference was not statistically significant (Figure 2). ACE inhibitor users for <1 year, from 1 to 3 years, from 3 to 5 years, and for >5 years had increases in IGF-1 levels of 21%, 17%, 8.7%, and 7%, respectively, compared with nonusers.
Figure 2.

Total IGF-1 levels according to duration of treatment with ACE inhibitors (years). Total IGF-1 values are reported as means ± SEs. Tests of comparison were adjusted for age, gender, hypertension, cardiac heart failure, coronary heart disease, diabetes, and the number of medications, with nonusers as the reference group.
Discussion
Using data from a large representative sample of older participants living in Tuscany, Italy, we found that the use of ACE inhibitors was associated with higher circulating levels of total IGF-1. This association remained strong and statistically significant even after adjusting for multiple potential confounders. A number of studies have shown that IGF-1 levels decrease with aging and that the rate of decrease is faster in patients with heart failure. Our findings are consistent with those of previous studies showing that the reductions in IGF-1 levels often observed in patients with congestive heart failure may be counteracted by ACE inhibitor treatment,11,12 probably as a result of reduced angiotensin II levels.
It is well known from animal studies that angiotensin II infusion produces a marked reduction in body weight accompanied by a decrease in skeletal muscle and serum IGF-1 levels.1 Conversely, it has been demonstrated that the overexpression of muscle-specific IGF-1 almost completely prevents the angiotensin II–induced skeletal muscle wasting.4 Our findings provide evidence to the hypothesis that the use of ACE inhibitors may slow down the age-related decrease in muscle strength and lower extremity function by maintaining higher IGF-1 levels.13,14
In ACE inhibitors users, total IGF-1 serum levels were progressively and significantly higher in short-term users compared with long-term users. After adjustment for multiple confounders, only ACE inhibitor users who had been receiving treatment for <3 years had IGF-1 levels statistically higher than nontreated controls. This finding could be explained by the “angiotensin II reactivation” that may occur in long-term users of ACE inhibitors. After a long period of ACE inhibitor treatment, angiotensin II plasma and tissue levels tend to slowly increase15,16 because it is produced by alternative pathways that do not involve ACE.17 We cannot exclude also that mechanisms other than angiotensin II may be involved in ACE inhibitor action. Kohlstedt et al18 showed that ACE may mediate intracellular signals in response to bradykinin, in endothelial cells, while simultaneously destroying its ability to act as a vasodilator. There is also evidence that enaprilat and other ACE inhibitors in nanomolar concentrations may directly activate human bradykinin B1 receptors.19
The effect of ACE inhibitors on IGF-1 is independent of hypertension and cardiovascular function. None of the other cardiovascular drugs considered in the analysis had any sizable effect on serum total IGF-1. The main limitation of our study is its cross-sectional design. However, given the nature of the specific research question addressed, this is only a partial limitation.
Future studies should verify whether change over time in angiotensin II is mirrored by parallel changes in IGF-1 in the appropriate direction. Second, information on IGF-1 binding proteins was not available, which may have provided more details on the IGF-1 fraction that is biologically active. However, this limitation is offset by important strengths. This is a large representative sample of older participants who were carefully evaluated, including information on multiple potential factors that may affect IGF-1 production that is not easily available in other studies, such as caloric intake, inflammation, and testosterone.
Acknowledgments
The authors thank Dr. Fabrizio Ablonoti and Dr. Giuseppe De Cicco for their excellent technical support.
The InCHIANTI study was supported as a “targeted project” (ICS 110.1/RS97.71) by the Italian Ministry of Health, Rome, Italy, and in part by the US National Institute on Aging, Bethesda, Maryland (contracts 263 MD 916413 and 263 MD 821336).
References
- 1.Brink M, Wellen J, Delafontaine P. Angiotensin II causes weight loss and decreases circulating insulin-like growth factor I in rats through a pressor-independent mechanism. J Clin Invest. 1996;97:2509–2516. doi: 10.1172/JCI118698. [DOI] [PMC free article] [PubMed] [Google Scholar]
- 2.Ceda GP, Lauretani F, Russo C, Bartali B, Bandinelli S, Maggio M, Corsi AM, Valle D, Valenti G, Ferrucci L. The relationship between IGF-1 levels and physical performance in older men and women: the InCHIANTI study. Annu Meeting Endocrine Soc. 2003;P2-475:423. [Google Scholar]
- 3.Barbieri M, Ferrucci L, Ragno E, Corsi A, Bandinelli S, Bonafe M, Olivieri F, Giovagnetti S, Franceschi C, Guralnik JM, Paolisso G. Chronic inflammation and the effect of IGF-I on muscle strength and power in older persons. Am J Physiol Endocrinol Metab. 2003;284:E481–E487. doi: 10.1152/ajpendo.00319.2002. [DOI] [PubMed] [Google Scholar]
- 4.Song YH, Li Y, Du J, Mitch WE, Rosenthal N, Delafontaine P. Muscle-specific expression of IGF-1 blocks angiotensin II-induced skeletal muscle wasting. J Clin Invest. 2005;115:451–458. doi: 10.1172/JCI22324. [DOI] [PMC free article] [PubMed] [Google Scholar]
- 5.Ferrucci L, Bandinelli S, Benvenuti E, Di Iorio A, Macchi C, Harris TB, Guralnik JM. Subsystems contributing to the decline in ability to walk: bridging the gap between epidemiology and geriatric practice in the InCHIANTI study. J Am Geriatr Soc. 2000;48:1618–1625. doi: 10.1111/j.1532-5415.2000.tb03873.x. [DOI] [PubMed] [Google Scholar]
- 6.Valenti G, Denti L, Maggio M, Ceda GP, Volpato S, Bandinelli S, Ceresini G, Cappola A, Guralnik JM, Ferrucci L. Effect of DHEAS on skeletal muscle over the life span: the InCHIANTI study. J Gerontol A Biol Sci Med Sci. 2004;59:466–472. doi: 10.1093/gerona/59.5.m466. [DOI] [PubMed] [Google Scholar]
- 7.Ferrucci L, Corsi A, Lauretani F, Bandinelli S, Bartali B, Taub DD, Guralnik JM, Longo DL. The origins of age-related proinflammatory state. Blood. 2005;105:2294–2299. doi: 10.1182/blood-2004-07-2599. [DOI] [PMC free article] [PubMed] [Google Scholar]
- 8.Pisani P, Faggiano F, Krogh V, Palli D, Vineis P, Berrino F. Relative validity and reproducibility of a food frequency dietary questionnaire for use in the Italian EPIC centres. Int J Epidemiol. 1997;26(suppl):S152–S160. doi: 10.1093/ije/26.suppl_1.s152. [DOI] [PubMed] [Google Scholar]
- 9.Simonsick EM, Maffeo CE, Rogers SK, Skinner EA, Davis D, Guralnik JM, Fried L. Methodology and feasibility of a home-based examination in disabled older women: the Women’s Health and Aging Study. J Gerontol A Biol Sci Med Sci. 1997;52:M264–M274. doi: 10.1093/gerona/52a.5.m264. [DOI] [PubMed] [Google Scholar]
- 10.Cushman DW, Wang FL, Fung WC, Harvey CM, De Forrest JM. Differentiation of angiotensin-converting enzyme (ACE) inhibitors by their selective inhibition of ACE in physiologically important target organs. Am J Hypertens. 1989;2:294–306. doi: 10.1093/ajh/2.4.294. [DOI] [PubMed] [Google Scholar]
- 11.Anwar A, Gaspoz JM, Pampallona S, Zahid AA, Sigaud P, Pichard C, Brink M, Delafontaine P. Effect of congestive heart failure on the insulin-like growth factor-1 system. Am J Cardiol. 2002;90:1402–1405. doi: 10.1016/s0002-9149(02)02885-0. [DOI] [PubMed] [Google Scholar]
- 12.Corbalan R, Acevedo M, Godoy I, Jalil J, Campusano C, Klassen J. Enalapril restores depressed circulating insulin-like growth factor 1 in patients with chronic heart failure. J Card Fail. 1998;4:115–119. doi: 10.1016/s1071-9164(98)90251-2. [DOI] [PubMed] [Google Scholar]
- 13.Onder G, Penninx BW, Balkrishnan R, Fried LP, Chaves PH, Williamson J, Carter C, Di Bari M, Guralnik JM, Pahor M. Relation between use of angiotensin-converting enzyme inhibitors and muscle strength and physical function in older women: an observational study. Lancet. 2002;359:926–930. doi: 10.1016/s0140-6736(02)08024-8. [DOI] [PubMed] [Google Scholar]
- 14.Di Bari M, van de Poll-Franse LV, Onder G, Kritchevsky SB, Newman A, Harris TB, Williamson JD, Marchionni N, Pahor M. Health, Aging and Body Composition Study. Antihypertensive medications and differences in muscle mass in older persons: the Health, Aging and Body Composition Study. J Am Geriatr Soc. 2004;52:961–966. doi: 10.1111/j.1532-5415.2004.52265.x. [DOI] [PubMed] [Google Scholar]
- 15.Farquharson CA, Struthers AD. Gradual reactivation over time of vascular tissue angiotensin I to angiotensin II conversion during chronic lisinopril therapy in chronic heart failure. J Am Coll Cardiol. 2002;39:767–775. doi: 10.1016/s0735-1097(02)01689-3. [DOI] [PubMed] [Google Scholar]
- 16.van Kats JP, Duncker DJ, Haitsma DB, Schhuijt MP, Niebuur R, Stubenitsky R, Boomsma F, Schalekamp MA, Verdouw PD, Danser AH. Angiotensin-converting enzyme inhibition and angiotensin II type 1 receptor blockade prevent cardiac remodeling in pigs after myocardial infarction: role of tissue angiotensin II. Circulation. 2000;102:1556–1563. doi: 10.1161/01.cir.102.13.1556. [DOI] [PubMed] [Google Scholar]
- 17.MacFadyen RJ, Lee AF, Morton JJ, Pringle SD, Struthers AD. How often are angiotensin II and aldosterone concentrations raised during chronic ACE inhibitor treatment in cardiac failure? Heart. 1999;82:57–61. doi: 10.1136/hrt.82.1.57. [DOI] [PMC free article] [PubMed] [Google Scholar]
- 18.Kohlstedt K, Brandes RP, Muller-Esterl W, Busse R, Fleming I. Angiotensin-converting enzyme is involved in outside-in signaling in endothelial cells. Circ Res. 2004;94:60–67. doi: 10.1161/01.RES.0000107195.13573.E4. [DOI] [PubMed] [Google Scholar]
- 19.Ignjatovic T, Tan F, Brovkovych V, Skidgel RA, Erdos EG. Novel mode of action of angiotensin I converting enzyme inhibitors: direct activation of bradykinin B1 receptor. J Biol Chem. 2002;277:16847–16852. doi: 10.1074/jbc.M200355200. [DOI] [PubMed] [Google Scholar]