

Abstract
Objectives
We investigated the secular trend in white blood cell (WBC) count and the relationship between WBC count and mortality between 1958 and 2002.
Background
The WBC count is a clinical marker of inflammation and a strong predictor of mortality. Limited data exist on the WBC count secular trend and the relationship between WBC and mortality.
Methods
One thousand eighty-three women and 1,720 men were evaluated longitudinally in the Baltimore Longitudinal Study of Aging. Blood samples and medical information were collected at the study entry and every 2 years during follow-up visits. The WBC count and all-cause, cardiovascular, and cancer mortality were assessed.
Results
A downward trend in WBC count was observed from 1958 to 2002. The secular downward trend was independent of age, gender, race, smoking, body mass index, and physical activity. The WBC count was nonlinearly associated with all-cause mortality and almost linearly associated with cardiovascular mortality. Participants with baseline WBC <3,500 cells/mm3 and WBC >6,000 cells/mm3 had higher mortality than those with 3,500 to 6,000 WBC/mm3. Within each WBC group, age-adjusted mortality rates declined in successive cohorts from the 1960s to the 1990s. Participants who died had higher WBC than those who survived, and the difference was statistically significant within 5 years before death.
Conclusions
Our study provides evidence for a secular downward trend in WBC count over the period from 1958 to 2002. Higher WBC counts are associated with higher mortality in successive cohorts. We found no evidence that the decline of age-specific mortality rates that occurred from 1960 to 2000 was attributable to a secular downward trend in WBC.
White blood cell (WBC) count is a marker of systemic inflammation, and elevated WBC count is associated with all-cause (1) as well as cancer (2), cerebrovascular (3), and cardiovascular (4) mortality. The WBC count is an independent risk factor for cardiovascular and cerebrovascular events (3,5) and a negative prognostic factor in congenital heart disease patients (6). Accordingly, WBC count is considered a biomarker of inflammatory processes that actively contribute to vascular injury and atherosclerosis (7,8). Whether elevated WBC count directly contributes to cardiovascular disease and mortality (9) or is merely a marker of negative cardiovascular risk profile remains controversial (10,11).
Over the last century, the percentage of persons who smoke declined, whereas the percentage of obese and sedentary individuals increased substantially (12,13). Whether the longitudinal trends in these risk factors account for changes in WBC count and potentially for the association between WBC count and mortality has not been investigated. Limited data exist on the longitudinal trend of WBC and the relationship between WBC and mortality over the second half of the 20th century. With the data from the BLSA (Baltimore Longitudinal Study of Aging) trial gathered from 1958 to 2002, we studied the longitudinal trend in WBC count and the relationship between WBC and mortality.
Methods
Study sample
The BLSA trial is a cohort of volunteers continually recruited since 1958, primarily from the Baltimore-Washington, DC, area. Participants healthy at study entry were consecutively enrolled in the study. From 1958 to 1978 the cohort included exclusively men; women were enrolled after 1978. A general description of the BLSA trial has been previously reported (14).
In this analysis, we considered 2,803 participants (1,083 women and 1,720 men) enrolled from 1958 to 2002. Participants had a median of 4 evaluations (range 1 to 28). Men had a median of 6 visits (range 1 to 28) over 22 ± 13.6 years, and women had a median of 3 visits (range 1 to 14) over 13 ± 7.9 years: 272 men and 294 women had a single evaluation.
Participants were evaluated every 2 years at the Gerontology Research Center in Baltimore, Maryland. Follow-up visits lasted 2 to 3 days and included medical evaluations and physiological and cognitive tests performed by a physician, nurse practitioner, or physician assistant. Fasting blood samples were collected in the morning and analyzed by the clinical laboratory of the Johns Hopkins Bayview Medical Center.
WBC count
Total WBC count (cells/mm3) was performed with standard automated clinical methodologies. Evaluating WBC trajectories over time in specific individual and in the entire sample, we found no evidence for sudden change in WBC count at the times when methods for the assessment of WBC count were changed.
Participants were grouped according to the following cut points: 3,500, 6,000, and 10,000 cells/mm3. Two of these values delimit the WBC count normal range (3,500 to 10,000 cells/mm3), whereas 6,000 is the WBC count threshold above which mortality was higher than the average population mortality. Differential blood counts were obtained starting in 1968 and are available for only part of the database. Percentages of neutrophils and lymphocytes were determined by microscopic examination of Giemsa-stained peripheral blood smear. The absolute neutrophil and lymphocyte counts were calculated applying percentage to total WBC count.
Mortality
Participants' vital status was determined by telephone follow-up, correspondence, and searches of the National Death Index. Cause of death was determined by a consensus of 3 physicians who reviewed death certificates, medical records, correspondences, and other available material and adjudicated as “cardiovascular,” “cancer,” or “other.”
Covariates
Body mass index (BMI) was calculated as weight in kilograms divided by the square of height in meters. Participants were categorized as smokers, former smokers, or never smokers at each visit, on the basis of self-report. Leisure time physical activity was assessed by self-report of the amount of time spent performing 97 activities on the basis of a typical day, averaged over the prior 2 years (15). Each activity was assigned a value for metabolic units (METs) (METs/min or metabolic equivalents of resting oxygen consumption/min) with the coding system described by Ainsworth (16) and Jetté (17) and categorized according to MET intensity, as low intensity (≤4 METs), moderate intensity (4.1 to 5.9 METs), and high intensity (6 METs). Leisure time physical activity was finally expressed in average total METs/day. Diabetes mellitus was defined on the basis of the 1997 American Diabetes Association criteria (18). Plasma triglycerides and total cholesterol concentrations were determined with an enzymatic method (ABA-200 ATC Biochromatic Analyzer, Abbott Laboratories, Irving, Texas). Blood pressure was measured at the brachial artery with the participants sitting and with a sphygmomanometer which was calibrated at regular intervals with a mercury standard (19).
Statistical analysis of the data
Differences in baseline characteristics between survivors and decedents were tested with Student t or chi-square tests. In analyses limited to selected decades, WBC counts, covariate, and outcome values were derived from BLSA trial visits that occurred during that decade. Crude all-cause, cardiovascular, and cancer mortality rates were expressed as the number of events/1,000 person-years according to WBC count groups. The hypothesis that WBC count changed over time across repeated measurements as an age-independent secular trend was tested with mixed effects models on the basis of non-linear mixed effects procedure in S-PLUS 6.2 (Insightful Inc., Seattle, Washington) (20).
Proportional hazards regression models were used to determine the contribution of WBC count to mortality, with the survival functions developed by Therneau and Brambsch (21). The Martingale residuals from the proportional hazards regression models were plotted versus WBC count. The Martingale residuals represent the “excess mortality” that reflects the discrepancy between observed hazard and expected hazard of mortality (21). Exploration of the Martingale residuals further supported the WBC classification into the 4 groups (≤3,500; 3,501 to 6,000; 6,001 to 10,000; >10,000) used in this analysis.
The effect of baseline WBC count on mortality was examined by Kaplan-Meier estimates and tested by proportional hazard analysis, with the classification in 4 WBC count groups described previously. In additional analyses, we used longitudinal time-dependent survival models where the subject's WBC count and covariates were allowed to vary over time. Time-dependent covariates in the longitudinal analyses used the Anderson-Gill formulation as a counting process (22). For each subject, time was divided into intervals between evaluations, and the covariates were based on the evaluation at the start of the interval. Thus, the independent variables can increase or decrease over time. This longitudinal time-dependent survival functions have been developed in S-PLUS 6.2 by Therneu and Brambsch (21).
Proportionality was examined with both Kaplan-Meier plots and scaled Schoenfeld residuals by time plots. Kaplan-Meier plots examined the survival function in each WBC group according to the baseline evaluations. Survival plots seemed to be proportional, with exception of group with WBC count ≤3,500. Given a covariate, Schoenfeld residuals are the covariate-value for each person who died at a specific time minus the expected value of the covariate for the risk set at that specific time. Plotting Schoenfeld residual against the log transformation of time, with the cox.zph procedure in S-PLUS 6.2, the proportionality of the hazard was confirmed in all WBC groups.
To test whether the effect of WBC count on mortality was due to a relative acute or rapidly progressing illness, survival models were also estimated in subjects who survived at least 3 or 5 years after their initial evaluation. These models had similar findings to the full models and are not reported.
All analyses were performed with S-PLUS version 6.2 (Insightful Inc.). A 2-tailed p value <0.05 and 95% confidence interval (CI) were used to indicate statistical significance.
Results
Description of the sample
Characteristics of the participants are reported in Table 1 according to the vital status at the end of the follow-up and in Table 2 according to the WBC groups. There were 944 deaths over 48,347 person-years of follow-up: the unadjusted mortality rate was 22.5/1,000 person-years in men and 12.7/1,000 person-years in women. Compared with survivors, those who died were more likely to be smokers, were less physically active, and had significantly worse cardiovascular risk profile. Independent of age and date, both at baseline and in subsequent follow-up visits, decedents had higher WBC count than survivors (Table 1). Women had significantly lower WBC count than men, but WBC count was not significantly correlated with age in either gender.
Table 1. Baseline Characteristics of the Study Participants According to the Vital Status at the End of the Follow-Up.
| Women | Men | |||||
|---|---|---|---|---|---|---|
| Decedents (n = 169) |
Survivors (n = 914) |
p Value | Decedents (n = 775) |
Survivors (n = 945) |
p Value | |
| Age at evaluation (yrs) | 72.4 ± 11.0 | 49.5 ± 16.2 | <0.0001 | 62.2 ± 13.9 | 44.2 ± 16.9 | <0.0001 |
| Length of follow-up (yrs) | 12.0 ± 6.0 | 13.0 ± 7.9 | <0.0001 | 17.7 ± 10.4 | 22.0 ± 13.6 | <0.0001 |
| WBC at evaluation (cells/mm3) | 6,589 ± 1,624 | 6,077 ± 1,657 | 0.0013 | 7,420 ± 1,955 | 6,379 ± 2,231 | 0.0001 |
| Neutrophils (cells/mm3) | 4,118 ± 1,308 | 3,785 ± 1,500 | 0.19 | 4,747 ± 1,749 | 3,644 ± 1,296 | <0.0001 |
| Lymphocytes (cells/mm3) | 1,857 ± 653 | 1,853 ± 742 | 0.09 | 1,809 ± 737 | 1,867 ± 734 | 0.0057 |
| BMI (kg/m2) | 24.8 ± 4.6 | 24.6 ± 4.5 | 0.70 | 25.2 ± 3.0 | 25.5 ± 3.5 | 0.40 |
| Weight (kg) | 62.6 ± 10.8 | 62.4 ± 12.2 | 0.87 | 77.3 ± 11.0 | 80.4 ± 12.3 | 0.85 |
| Height (cm) | 160.8 ± 5.6 | 163.8 ± 6.8 | 0.84 | 175.2 ± 6.5 | 177.4 ± 7.1 | 0.57 |
| Physical activity (METs/day) | ||||||
| Moderate intensity | 233 ± 230 | 280 ± 236 | 0.48 | 233 ± 229 | 343 ± 293 | 0.0560 |
| High intensity | 80 ± 193 | 125 ± 188 | 0.31 | 81 ± 141 | 185 ± 234 | 0.01 |
| Total | 2,121 ± 379 | 2,330 ± 419 | 0.078 | 1,995 ± 448 | 2,324 ± 494 | 0.0650 |
| Smoking status (%) | ||||||
| Never | 55.0 | 56.6 | 0.11 | 33.6 | 42.4 | 0.38 |
| Former | 29.6 | 30.4 | 38.5 | 34.4 | ||
| Current | 15.4 | 13.0 | 28.0 | 23.2 | ||
| Blood pressure (mm Hg) | ||||||
| Systolic | 139.3 ± 24.0 | 120.9 ± 18.8 | 0.0214 | 136.5 ± 20.8 | 124.5 ± 16.1 | 0.0039 |
| Diastolic | 79.6 ± 11.4 | 76.0 ± 10.2 | 0.14 | 82.3 ± 11.5 | 79.4 ± 10.2 | 0.0866 |
| Lipids (mg/dl) | ||||||
| Triglycerides | 105 ± 81 | 79 ± 47 | 0.22 | 120 ± 73 | 106 ± 73 | 0.15 |
| Cholesterol | 235 ± 43.1 | 204 ± 40 | 0.50 | 231 ± 42.6 | 206 ± 38 | 0.29 |
| Diabetes (%) | 3.5 | 0.3 | 0.019 | 3.8 | 1.4 | 0.0230 |
Data are presented as mean ± SD, if not otherwise indicated. p values are from t test or chi-square test.
BMI = body mass index; MET = metabolic unit; WBC = white blood cell.
Table 2. Baseline Characteristics of the Study Participants According to WBC Count Groupings.
| WBC Count (Groups) | |||||
|---|---|---|---|---|---|
| ≤3,500 | 3,501–6,000 | 6,001–10,000 | >10,000 | p Value | |
| Number of subjects, n (% female) | 49 (55.1) | 1,192 (47.1) | 1,433 (32.8) | 129 (18.6) | <0.0001 |
| Race (% Caucasian) | 33.3 | 79.6 | 90.7 | 94.4 | 0.10 |
| Age (yrs at baseline) | 56.9 ± 15.7 | 51.4 ± 18.0 | 53.5 ± 17.8 | 52.8 ± 17.3 | 0.0001 |
| Length follow-up (yrs) | 7.0 ± 6.6 | 15.7 ± 10.8 | 18.7 ± 11.6 | 19.7 ± 12.2 | 0.0002 |
| WBC (cells/mm3) | 3,100 ± 348 | 5,106 ± 631 | 7,447 ± 1,020 | 11,711 ± 3,682 | <0.0001 |
| Neutrophils (cells/mm3) | 1,510 ± 0,599 | 3,010 ± 0,696 | 4,585 ± 1,087 | 8,000 ± 1,725 | <0.0001 |
| Lymphocytes (cells/mm3) | 1,224 ± 499 | 1,579 ± 0,508 | 2,044 ± 1,064 | 4,479 ± 1,064 | <0.0001 |
| Smoking (%) | <0.0001 | ||||
| Never | 67.3 | 52.7 | 40.6 | 21.1 | |
| Former | 32.7 | 36.1 | 33.2 | 22.7 | |
| Current | 0.0 | 11.2 | 26.2 | 56.2 | |
| BMI (kg/m2) | 25.4 ± 4.1 | 25.0 ± 3.9 | 25.2 ± 3.7 | 24.8 ± 4.1 | 0.06 |
| Weight (kg) | 74.2 ± 14.1 | 72.8 ± 14.1 | 74.2 ± 13.4 | 74.8 ± 14.5 | 0.35 |
| Height (cm) | 170.4 ± 9.8 | 171.4 ± 9.4 | 171.4 ± 9.4 | 173.4 ± 9.0 | 0.03 |
| Physical activity (METs/day) | |||||
| Moderate intensity | 305 ± 228 | 290 ± 243 | 290 ± 275 | 239 ± 192 | 0.443 |
| High intensity | 67 ± 123 | 145 ± 211 | 124 ± 196 | 112 ± 175 | 0.218 |
| Total | 2,210 ± 515 | 2,302 ± 447 | 2,214 ± 483 | 2,107 ± 372 | 0.078 |
| Blood pressure (mm Hg) | |||||
| Systolic | 128.8 ± 19.4 | 125.6 ± 20.3 | 128.9 ± 19.9 | 133.0 ± 21.0 | 0.164 |
| Diastolic | 80.4 ± 14.0 | 78.7 ± 10.6 | 79.6 ± 11.1 | 81.5 ± 11.0 | 0.732 |
| Lipids (mg/dl) | |||||
| Triglycerides | 73.5 ± 38.2 | 88.2 ± 55 | 108.6 ± 75.7 | 119 ± 70.2 | <0.0001 |
| Cholesterol | 196 ± 39 | 208.7 ± 41.8 | 216.4 ± 42 | 211 ± 42 | 0.421 |
| Diabetes (%) | 0.0 | 1.2 | 2.3 | 3.8 | 0.98 |
Data are presented as mean ± SD, otherwise as indicated. p values from analysis of variance or chi-square test.
Abbreviations as in Table 1.
WBC count secular trend
A secular downward trend of WBC count was observed in both genders, (linear, quadratic, and cubic effects of date, p < 0.0001) in the period from 1958 to 2002 (Figs. 1A and 1B). Independent of age, the WBC rate of change in men was −114 cells/year in 1965 and became −48 cells/year in 1995 and in women was 6 cells/year in 1985 and became −48 cells/year in 1995. The downward trend in WBC count observed in men was independent of the age of the participants at the study entry in each decade from the 1960s to the 1990s. An exception was the irregular WBC count time trends found in participants older than 80 years over all the decades (data not shown) and the higher WBC count observed in the participants enrolled at age 40 to 59.9 years in the decade 1990 to 2000. Results were similar for women, limited to the 2 decades of enrollment (data not shown). In the period from 1958 to 2002, former and current smokers had always higher WBC count than never smokers and participants with higher BMI considered as time-dependent covariates had higher WBC count. However, WBC secular downward trend was independent of smoking and/or BMI in the entire period (data not shown). On the contrary, being physically active was associated with lower WBC count. An increase in physical activities of 100 METs/min/day was associated with a decrease of 18 WBC/mm3. However, the slight changes of physical activity in the BLSA participants over time did not significantly impact the WBC count secular downward trend.
Figure 1. Longitudinal Changes in WBC Count by Years of Initial Evaluation, Separately in Men and Women.
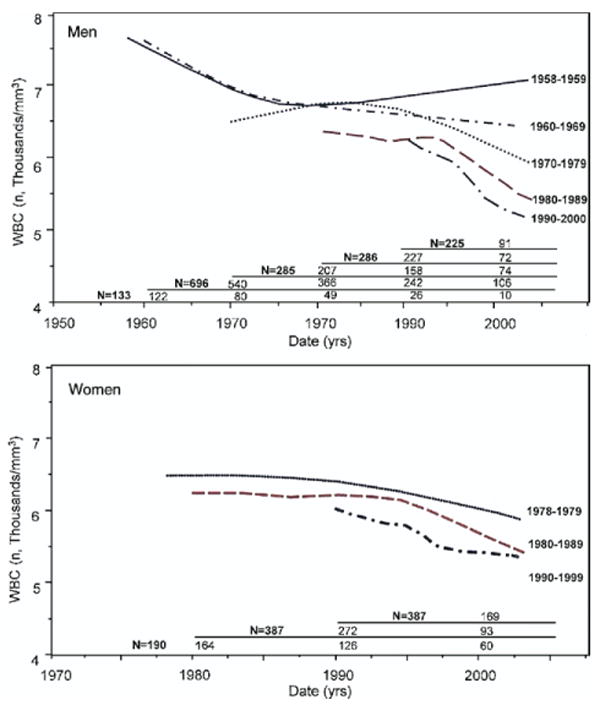
The upward trend of white blood cell (WBC) count in the oldest cohorts can be explained by participants enrolled in the first 2 enrollment periods, who developed an increase in WBC count in their very old age. Numbers in the table are for participants enrolled in different time periods and, of these, the number who were still alive at the beginning of each decade.
WBC count and mortality
The relationship between WBC count and mortality was nonlinear, with a nonsignificant upward mortality trend for WBC <3,500/mm3 and a significant linear increase in mortality for WBC >3,500/mm3 (Fig. 2A). Cardiovascular mortality increased linearly with higher WBC count (Fig. 2B), whereas there was a little effect of WBC count on cancer mortality (Fig. 2C). Because of the nonlinear relationship between WBC count and all-cause mortality, 4 WBC groups were identified on the basis of the values that identify the WBC normal range in our laboratory (3,500 cells/mm3 and 10,000 cells/mm3) and the visual identification of the value of WBC associated with increased mortality (6,000 cells/mm3) on functional form of the WBC mortality curve (Fig. 2, Table 2).
Figure 2. Relationship Between Excess Mortality and WBC Count in the Entire BLSA Trial Sample.
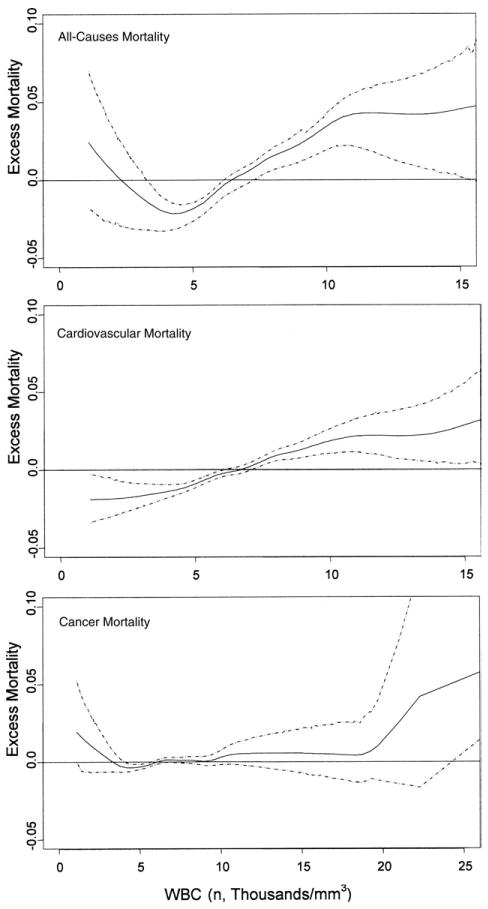
The absolute difference between the observed mortality hazard and the expected mortality hazard over time is expressed as excess mortality and plotted against white blood cell (WBC) count for the entire sample. The dashed lines represent the 95% confidence intervals.
The lowest crude mortality rate was found among participants with WBC 3,501 to 6,000 (13.7/1,000 person-years). Participants with WBC count below and above the range 3,501 to 6,000 experienced increased mortality. The highest mortality (30.2/1,000 person-years) was observed in participants with WBC >10,000 (Table 3, Fig. 3A). Compared with the WBC group with lowest crude mortality, participants with 6,001 to 10,000 WBC and those with WBC >10,000 had an unadjusted hazard ratio (HR) for mortality of 1.54 (95% CI 1.33 to 1.78) and 1.99 (95% CI 1.54 to 2.57), respectively (Table 3). After adjustment for confounders, the mortality HR remained significantly higher in participants with WBC 6,001 to 10,000/mm3 (HR 1.28, 95% CI 1.01 to 1.63), and in those with WBC >10,000 (HR 1.62, 95% CI 0.92 to 2.85) compared with the reference group. The small number of participants did not allow any significant conclusion in term of mortality risk associated with WBC ≤3,500, although the partial adjusted HRs tended to remain higher compared with the reference group (Table 3, Fig. 3B).
Table 3. Mortality Rate and Hazard Ratio in WBC Count Groups.
| WBC Count (Groups) | ||||
|---|---|---|---|---|
| ≤3,500 | 3,501–6,000 | 6,001–10,000 | >10,000 | |
| Person-years of follow-up (n) | 345 | 18,726 | 26,730 | 2,547 |
| Deaths (n) | 5 | 256 | 606 | 77 |
| Rate/1,000 person-yrs | 14.5 | 13.7 | 22.7 | 30.2 |
| Hazard ratio (95% CI)* | 1.40 (0.58–3.41) | 1 (Ref) | 1.54 (1.33–1.78) | 1.99 (1.54–2.57) |
| Adjusted hazard ratio (95% CI)† | 1.53 (0.63–3.72) | 1 (Ref) | 1.24 (1.06–1.43) | 1.76 (1.35–2.29) |
| Adjusted hazard ratio (95% CI)‡ | — | 1 (Ref) | 1.28 (1.01–1.63) | 1.62 (0.92–2.85) |
From Cox proportional hazard model;
from Cox proportional hazard model with adjustments for age, gender, race, BMI, and smoking;
from Cox proportional hazard model with adjustments for age, gender, race, BMI, smoking, physical activity, systolic blood pressure, diastolic blood pressure, cholesterol, triglycerides, and diabetes status.
CI = confidence interval; Ref = reference group; other abbreviations as in Table 1.
Figure 3. Kaplan-Meier Survival Curves and Proportional Hazard Survival Plots According to WBC Count Groups.
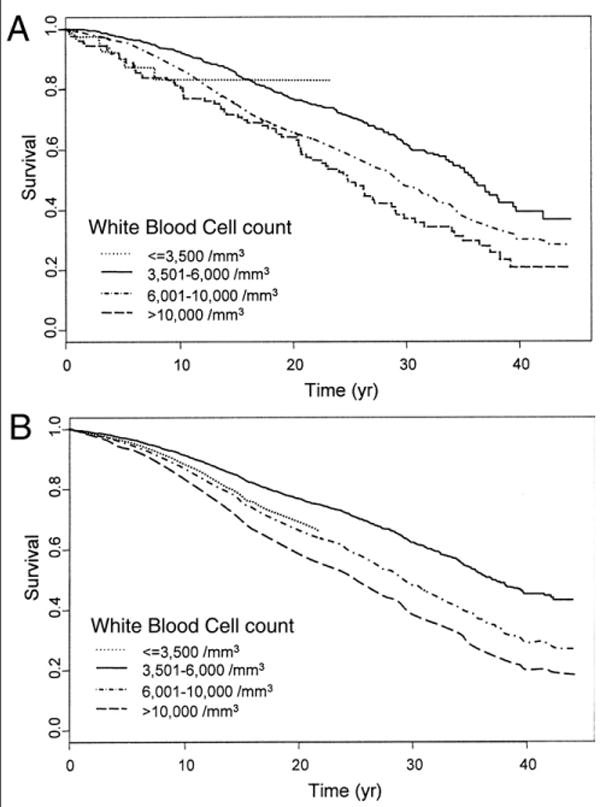
(A) Kaplan-Meier curves. (B) Proportional hazard survival plots were evaluated at mean values of the explanatory variables. In participants with white blood cell (WBC) count ≤3,500/mm3, the predicted survival was extrapolated up to 20 years of follow-up, because of the absence of events after 20 years.
A further analytical model that allows participants to shift between WBC count groups over time confirmed the same findings. Participants within WBC 6,000 to 10,000, who theoretically have “normal” WBC count, had 30% to 40% higher risk of mortality compared with those with WBC 3,501 to 6,000. Participants with WBC <3,500 had 3-fold higher mortality (HR 3.33, 95% CI 1.38 to 8.05), and those with WBC >10,000 had 2-fold higher mortality (HR 2.12, 95% CI 1.45 to 3.08) compared with subjects with WBC 3,501 to 6,000. These results remained statistically significant after multiple adjustments (Table 4, Models 1, 2, and 3). No significant interaction was found between gender and WBC count and between age and WBC count, suggesting that WBC is a similar risk factor for mortality in men and women and the association between WBC count and mortality is similar at different ages. In analyses restricted to participants with differential WBC count (n = 6,227 observations), the association between WBC and mortality persisted in participants with WBC ≤3,500, whereas it was no longer significant in those with WBC 6,000 to 10,000 and WBC >10,000 after adjustment for neutrophil count (Table 4, Model 4). Independent of confounders, neutrophil count remained strongly associated with mortality.
Table 4. Mortality Hazard Ratio Comparing WBC Count Groups From the Longitudinal Time-Dependent Model.
| Model 1 | Model 2 | Model 3 | Model 4 | |
|---|---|---|---|---|
| WBC (cells/mm3) | ||||
| ≤3,500 | 2.98 (1.66–5.32) | 2.93 (1.36–6.31) | 3.33 (1.38–8.05) | 1.91 (1.19–3.07) |
| 3,501–6,000 | 1.0 | 1.0 | 1.0 | 1.0 |
| 6,001–10,000 | 1.32 (1.15–1.51) | 1.42 (1.18–1.70) | 1.33 (1.10–1.60) | 0.96 (0.83–1.10) |
| >10,000 | 2.00 (1.58–2.53) | 2.20 (1.55–3.12) | 2.12 (1.45–3.08) | 0.941 (0.67–1.30) |
| Age (yrs) | 1.10 (1.09–1.10) | 1.10 (1.09–1.11) | 1.10 (1.09–1.11) | 1.10 (1.09–1.30) |
| Date (dd/mm/yy) | 0.95 (0.94–0.96) | 0.94 (0.93–0.96) | 0.95 (0.93–0.96) | 0.92 (0.62–0.96) |
| Gender (female) | 1.10 (0.90–1.35) | 1.17 (0.82–1.48) | 1.09 (0.79–1.50) | 1.02 (0.86–1.20) |
| Race | ||||
| Caucasian (reference) | 1.0 | 1.0 | 1.0 | 1.0 |
| Afro-American | 0.93 (0.59–1.47) | 0.93 (0.59–1.47) | 0.68 (0.30–1.54) | 0.92 (0.62–1.36) |
| Other | 0.42 (0.15–1.20) | 0.42 (0.15–1.20) | 0.23 (0.09–1.50) | 0.40 (0.15–1.30) |
| BMI (kg/m2) | 0.98 (0.96–1.01) | 0.97 (0.95–0.99) | ||
| Physical activity (METs/day) | 1 (0.90–1.10) | 1 (0.90–1.10) | ||
| Smoking | ||||
| Never | 1.0 | 1.0 | ||
| Former | 1.93 (0.78–1.12) | 1.94 (0.78–1.14) | ||
| Current | 1.53 (1.11–2.18) | 1.61 (1.13–2.29) | ||
| Blood pressure (mm Hg) | ||||
| Systolic | 1.01 (1.00–1.02) | |||
| Diastolic | 1.00 (1.00–1.01) | |||
| Cholesterol (mg/dl) | 1.00 (1.00–1.01) | |||
| Triglycerides (mg/dl) | 1.00 (1.00–1.01) | |||
| Diabetes | 1.37 (1.10–1.70) | |||
| Neutrophils (cells/mm3) | 1.19 (1.09–1.30) |
Abbreviations as in Table 1.
The Kaplan-Meier survival curve summarizing the relationship between baseline WBC group membership and mortality are reported in Figure 3A. Expected survival adjusted for age, race, gender, date, BMI, smoking, physical activity, and major cardiovascular risk factors estimated by proportional hazard models are depicted in Figure 3B. The hazard associated with a given WBC group membership compared with the reference group was approximately constant over the 40 years of follow-up. Above the threshold of 3,500 WBC/mm3, the estimated mortality risk was 11% higher per each baseline additional increase of 1,000 WBC/mm3.
Interestingly, WBC count increased progressively in participants who died during the follow-up starting several years before death, whereas WBC count remained stable over time in those who survived (Fig. 4A). In the subgroup with differential count available, the rise of WBC count was mostly accounted for by neutrophils and was already significant 5 years before death (Fig. 4B). Lymphocytes remained substantially stable over the same period (Fig. 4C).
Figure 4. Longitudinal Changes in WBC, Neutrophil, and Lymphocyte Counts.
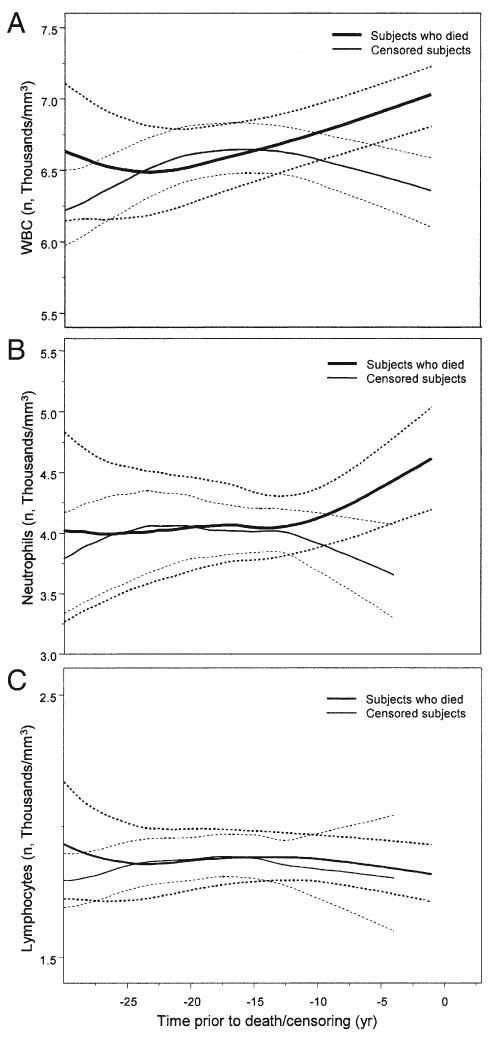
Longitudinal changes of age- and date-adjusted (A) white blood cell (WBC), (B) neutrophil, and (C) lymphocyte counts observed in the BLSA participants according to time before death for participants who died during the follow-up, and time before censorship for those who were censored. Note that neutrophils and lymphocytes are limited to participants who had differential WBC count (n = 6,227). 95% confidence interval estimated by a bootstrapping method.
WBC and mortality across the decades
From 1958 to 2002, the crude and the age-adjusted mortality rates decreased over time in the entire sample and in groups with WBC 3,500 to 6,000, 6,001 to 10,000, and >10.000/mm3 (Table 5). Owing to the small number of participants and deaths, the age-adjusted mortality rate could not be reliably estimated in the extreme group with WBC ≤3,500/mm3 (Table 5). However, within each cohort all-cause mortality were significantly higher in participants with WBC >6,000/mm3 than in those with WBC 3,500 to 6,000/mm3. After adjustment for age, gender, smoking, race, BMI, and systolic blood pressure, the adjusted mortality HRs for participants with WBC ≤3.500, 6,001 to 10,000, and >10,000/mm3 compared with WBC 3,500 to 6,000/mm3 tended to decline in subsequent decades from 1960 to 2000 (Table 5).
Table 5. Mortality Risk in Each WBC Count Group According to the Baseline Evaluation Across 4 Decades of Follow-Up.
| WBC Count (Groups) | ||||
|---|---|---|---|---|
| ≤3,500 | 3,501–6,000 | 6,001–10,000 | >10,000 | |
| 1960–1969 | ||||
| Subjects (n) | 2 | 200 | 530 | 83 |
| Age, mean ± SD (yrs) | 69.1 ± 10.5 | 50.7 ± 15.2 | 53.1 ± 14.5 | 52.2 ± 14.4 |
| Rate/1,000 persons* | 86.9 (2/23) | 20.0 (114/5,697) | 27.4 (368/13,438) | 33.2 (65/1,957) |
| Adjusted rate/1,000 persons† | — | 35.1 | 40.6 | 47.7 |
| Hazard ratio (95% CI) | 6.3 (1.56–25.8) | 1 | 1.4 (1.14–1.73) | 1.7 (1.29–2.38) |
| Adjusted hazard ratio‡ (95% CI) | 3.3 (0.82–13.6) | 1 | 1.3 (1.02–1.56) | 1.6 (1.26–2.36) |
| 1970–1979 | ||||
| Subjects (n) | 4 | 481 | 538 | 45 |
| Age, mean ± SD (yrs) | 64.6 ± 11.6 | 51.3 ± 16.7 | 53.7 ± 16.8 | 49.0 ± 17.1 |
| Rate/1,000 persons* | 42.3 (3/71) | 18.6 (209/11,228) | 25.0 (289/11,542) | 21.0 (83/1,001) |
| Adjusted rate/1,000 persons† | — | 26.1 | 29.1 | 31.1 |
| Hazard ratio (95% CI) | 2.4 (0.79–7.38) | 1 | 1.4 (1.14–1.63) | 1.1 (0.73–1.79) |
| Adjusted hazard ratio‡ (95% CI) | 2.2 (0.68–6.87) | 1 | 1.2 (1.02–1.46) | 1.3 (0.80–2.04) |
| 1980–1989 | ||||
| Subjects (n) | 11 | 570 | 815 | 41 |
| Age, mean ± SD (yrs) | 55.4 ± 22.0 | 53.8 ± 18.2 | 57.5 ± 18.0 | 54.7 ± 20.4 |
| Rate/1,000 persons* | 10.9 (2/184) | 15.2 (151/9,932) | 22.5 (305/13,546) | 25.5 (17/667) |
| Adjusted rate/1,000 persons† | — | 12.8 | 14.8 | 21.8 |
| Hazard ratio (95% CI) | 0.7 (0.18–2.89) | 1 | 1.4 (1.22–1.80) | 1.5 (0.98–2.43) |
| Adjusted hazard ratio‡ (95% CI) | 0.8 (0.20–3.32) | 1 | 1.1 (0.91–1.36) | 1.4 (0.85–2.35) |
| 1990–2002 | ||||
| Subjects (n) | 42 | 886 | 893 | 56 |
| Age, mean ± SD (yrs) | 56.7 ± 14.0 | 56.5 ± 17.3 | 59.6 ± 17.1 | 62.1 ± 18.1 |
| Rate/1,000 persons* | 9.1 (2/220) | 13.9 (191/7,253) | 20.9 (169/8,101) | 31.5 (15/476) |
| Adjusted rate/1,000 persons† | — | 5.8 | 8.6 | 9.0 |
| Hazard ratio (95% CI) | 0.7 (0.18–2.88) | 1 | 1.4 (1.10–1.81) | 2.2 (1.28–3.80) |
| Adjusted hazard ratio‡ (95% CI) | 0.7 (0.09–5.12) | 1 | 1.0 (0.81–1.34) | 1.2 (0.66–2.15) |
Crude mortality rate (number of events/1,000 persons).
Race- and gender-adjusted mortality rate estimated at age 60; in the WBC ≤3,500/mm3 group the adjusted mortality rate was not estimated because of the small sample size.
Cox proportional hazard model with adjustments for age, gender, smoking, race, body mass index, and systolic blood pressure.
CI = confidence interval; WBC = white blood cell.
Discussion
Over the period from 1958 to 2002, we observed a downward trend in WBC count and a parallel decline in age-specific mortality. The WBC count was nonlinearly associated with all-cause mortality and almost linearly associated with cardiovascular mortality. The independent association between WBC count and mortality was maintained in subsequent cohorts. Within WBC count strata 3,500 to 6,000, 6,001 to 10,000, and >10,000/mm3, mortality rates were progressively lower in successive cohorts from the 1960s to the 1990s, suggesting that the secular downtrend in WBC count was not a major cause of the decline in mortality.
Our findings are the first evidence of a downward trend in WBC count over the period from 1958 to 2002. The secular downward trend in WBC count might be attributed to concurrent environmental changes (i.e., less exposure to infective agents and/or improved sanitary conditions) and lifestyle modifications (i.e., smoking, physical activity, diet, and alcohol) (23,24). In the BLSA population, the percentage of current smokers declined from 40% in the early 1960s to >10% by the early 1990s, and this decline was 25% greater than in the whole U.S. population. This study confirmed the theoretical impact of smoking on WBC count and previous findings that tobacco abstinence is associated with lower WBC and neutrophil count (24,25). Additionally, we found that the WBC count secular downtrend was partially independent of changes in smoking behavior over the same period.
Obesity is associated with a proinflammatory state (26), characterized by increased C-reactive protein, interleukin-6, and WBC count (27). In the BLSA participants, an upward secular trend in BMI occurred, particularly beginning in the late 1980s (28). Although BMI and WBC count were correlated, the secular downward trend in WBC was independent of changes in BMI.
Physical activity might also affect both the WBC downward trend and the mortality via the beneficial effect of exercise on the innate and adaptive immunity. Regular exercise might positively impact the release of anti-inflammatory cytokines (29,30), T-helper1/T-helper2 imbalance and neutrophil, natural killer cell, and macrophages activity (31). In the BLSA population, we found a slight upward longitudinal trend in physical activity, particularly from 1970s to 1990s (15). Interestingly, most physically active participants were in the lowest risk WBC count group, and physical activity was inversely associated with WBC count, but we found no evidence that changes in physical activity affected secular WBC downtrend.
We showed a nonlinear relationship between WBC count and all-cause and cancer mortality and a linear relationship between WBC count and cardiovascular mortality (9). Our findings that participants with >6,000 WBC/mm3 had higher mortality risk compared with those with WBC 3,500 to 6,000/mm3 are consistent with current published data suggesting that high WBC count is a risk factor for mortality (4–9). The significant higher mortality risk, even within the normal range of WBC (6,000 to 10,000/mm3) compared with WBC 3,500 to 6,000/mm3, suggest that WBC count is a marker of subclinical disease (4,10). Although we need to use caution in interpreting the higher mortality observed in participants with WBC <3,500/mm3, because of limited sample size and small number of events, this finding might indicate that participants in this WBC group had general poor health status (32).
The secular mortality decline, observed in subsequent BLSA cohorts enrolled from the 1960s to the 1990s, is at least in part independent of WBC secular downward trend and suggests that other factors, such as the changes in the treatment of inflammatory related conditions, should be considered. In a subgroup of the BLSA participants, we found that those who died during the follow-up had a progressive elevation in WBC and neutrophil counts starting 5 years before death, whereas those who remained alive had an opposite trend in both WBC and neutrophil counts. In the same BLSA subgroup, neutrophils mainly accounted for the effect of WBC on mortality, suggesting that a specific cell type or other aspects of inflammation might cause vascular disease and be directly associated with increased mortality (8,9,33,34).
The present study has limitations. The BLSA sample includes highly educated individuals of high socioeconomic status who were considered healthy at study entry and therefore are not representative of the general population. Data from women were available only from 1978, and data from American minorities are available only from 1990. Methods of WBC determination changed over time. However, measurements were performed in the same clinical laboratory, comparability between different methods were directly verified, and sudden changes in the WBC count over time ascribable to changes in methodology were not detected. Although the major traditional cardiovascular risk factors were considered in our analysis, we had no information on inflammatory factors, high-density lipoprotein cholesterol, coagulation factors, and so forth, for which WBC might be a surrogate marker. Inclusion of these factors in the analysis might have explained to a greater extent the relationship between WBC count and mortality.
In conclusion, our study suggests a downward trend in WBC count only partially explained by behavioral changes that occurred in the BLSA participants over the period from 1958 to 2002. The age-specific mortality rate in each successive cohort of participants declined over the 44 years of follow-up, but we found little evidence that such a decline in mortality was due to the secular downward trend in WBC. However, by showing that participants with WBC >6,000/mm3 experienced higher mortality compared with those with 3,501 to 6,000 WBC/mm3, that the increased risk of mortality associated with high WBC was maintained over the entire follow-up period, and that subjects who died had progressively higher neutrophil count compared with those who survived, our study suggests that differential WBC counts should be systematically screened and factored in the cardiovascular risk profile and ultimately considered in clinical decisions concerning prescription of preventive interventions.
Acknowledgments
This research was supported by the Intramural Research Program of the National Institute on Aging, National Institutes of Health.
Abbreviations and Acronyms
- BMI
body mass index
- CI
confidence interval
- HR
hazard ratio
- MET
metabolic unit
- WBC
white blood cell
References
- 1.Weiss ST, Segal MR, Sparrow D, Wager C. Relation of FEV1 and peripheral blood leukocyte count to total mortality. The Normative Aging Study. Am J Epidemiol. 1995;142:493–8. doi: 10.1093/oxfordjournals.aje.a117665. [DOI] [PubMed] [Google Scholar]
- 2.Erlinger TP, Muntner P, Helzlsouer KJ. WBC count and the risk of cancer mortality in a national sample of U.S. adults: results from the Second National Health and Nutrition Examination Survey mortality study. Cancer Epidemiol Biomarkers Prev. 2004;13:1052–6. [PubMed] [Google Scholar]
- 3.Brown DW, Ford ES, Giles WH, Croft JB, Balluz LS, Mokdad AH. Associations between white blood cell count and risk for cerebrovascular disease mortality: NHANES II Mortality Study, 1976–1992. Ann Epidemiol. 2004;14:425–30. doi: 10.1016/j.annepidem.2003.11.002. [DOI] [PubMed] [Google Scholar]
- 4.Margolis KL, Manson JE, Greenland P, et al. Leukocyte count as a predictor of cardiovascular events and mortality in postmenopausal women: the Women's Health Initiative Observational Study. Arch Intern Med. 2005;165:500–8. doi: 10.1001/archinte.165.5.500. [DOI] [PubMed] [Google Scholar]
- 5.Wheeler JG, Mussolino ME, Gillum RF, Danesh J. Associations between differential leucocyte count and incident coronary heart disease: 1764 incident cases from seven prospective studies of 30,374 individuals. Eur Heart J. 2004;25:1287–92. doi: 10.1016/j.ehj.2004.05.002. [DOI] [PubMed] [Google Scholar]
- 6.Brennan ML, Penn MS, Van Lente F, et al. Prognostic value of myeloperoxidase in patients with chest pain. N Engl J Med. 2003;23:1595–604. doi: 10.1056/NEJMoa035003. [DOI] [PubMed] [Google Scholar]
- 7.Mehta JL, Saldeen TG, Rand K. Interactive role of infection, inflammation and traditional risk factors in atherosclerosis and coronary artery disease. J Am Coll Cardiol. 1998;31:1217–25. doi: 10.1016/s0735-1097(98)00093-x. [DOI] [PubMed] [Google Scholar]
- 8.Alexander RW. Inflammation and coronary artery disease. N Engl J Med. 1994;331:468–9. doi: 10.1056/NEJM199408183310709. [DOI] [PubMed] [Google Scholar]
- 9.Coller BS. Leukocytosis and ischemic vascular disease morbidity and mortality: is it time to intervene? Arterioscler Thromb Vasc Biol. 2005;25:658–70. doi: 10.1161/01.ATV.0000156877.94472.a5. [DOI] [PubMed] [Google Scholar]
- 10.Loimaala A, Rontu R, Vuori I, et al. Blood leukocyte count is a risk factor for intima-media thickening and subclinical carotid atherosclerosis in middle-aged men. Atherosclerosis. 2006;188:363–9. doi: 10.1016/j.atherosclerosis.2005.11.021. [DOI] [PubMed] [Google Scholar]
- 11.Smith MR, Kinmonth AL, Luben RN, et al. Smoking status and differential white cell count in men and women in the EPIC-Norfolk population. Atherosclerosis. 2003;169:331–7. doi: 10.1016/s0021-9150(03)00200-4. [DOI] [PubMed] [Google Scholar]
- 12.Smith SS, Fiore MC. The epidemiology of tobacco use, dependence, and cessation in the United States. Prim Care. 1999;26:433–61. doi: 10.1016/s0095-4543(05)70112-3. [DOI] [PubMed] [Google Scholar]
- 13.Flegal KM, Carroll MD, Kuczmarski RJ, Johnson CL. Overweight and obesity in the United States: prevalence and trends, 1960–1994. Int J Obes Relat Metab Disord. 1998;22:39–47. doi: 10.1038/sj.ijo.0800541. [DOI] [PubMed] [Google Scholar]
- 14.Shock NW, Gruelich RC, Andres RA, et al. The Baltimore Longitudinal Study of Aging. Washington, DC: U.S. Government Printing Office; 1984. [Google Scholar]
- 15.Talbot LA, Metter EJ, Fleg JL. Leisure-time physical activities and their relationship to cardiorespiratory fitness in healthy men and women 18–95 years old. Med Sci Sports Exerc. 2000;32:417–25. doi: 10.1097/00005768-200002000-00024. [DOI] [PubMed] [Google Scholar]
- 16.Ainsworth BE, Haskell WL, Leon AS, et al. Compendium of physical activities: classification of energy costs of human physical activities. Med Sci Sports Exerc. 1993;25:71–80. doi: 10.1249/00005768-199301000-00011. [DOI] [PubMed] [Google Scholar]
- 17.Jette M, Sidney K, Blumchen G. Metabolic equivalents (METS) in exercise testing, exercise prescription, and evaluation of functional capacity. Clin Cardiol. 1990;13:555–65. doi: 10.1002/clc.4960130809. [DOI] [PubMed] [Google Scholar]
- 18.Centers for Disease Control and Prevention. Ten great public health achievements—United States, 1900–1999. Morb Mortal Wkly Rep. 1999;48:241–2. [PubMed] [Google Scholar]
- 19.Pickering TG. Principles and techniques of blood pressure measurement. Cardiol Clin. 2002;20:207–23. doi: 10.1016/s0733-8651(01)00009-1. [DOI] [PubMed] [Google Scholar]
- 20.Pinheiro JC, Bates DM. Mixed-Effects Models in S and S-PLUS. New York, NY: Springer; 2000. [Google Scholar]
- 21.Therneau TM, Brambsch PM. Modeling Survival Data: Extending the Cox Model. New York, NY: Springer; 2000. [Google Scholar]
- 22.Anderson PK, Gill MD. Cox's regression model for counting processes: a large sample study. Ann Stat. 1982;10:1100–20. [Google Scholar]
- 23.Armstrong GL, Conn LA, Pinner RW. Trends in infectious disease mortality in the United States during the 20th century. JAMA. 1999;281:61–6. doi: 10.1001/jama.281.1.61. [DOI] [PubMed] [Google Scholar]
- 24.Abel GA, Hays JT, Decker PA, Croghan GA, Kuter DJ, Rigotti NA. Effects of biochemically confirmed smoking cessation on white blood cell count. Mayo Clin Proc. 2005;80:1022–8. doi: 10.4065/80.8.1022. [DOI] [PubMed] [Google Scholar]
- 25.Frohlich M, Sund M, Lowel H, Imhof A, Hoffmeister A, Koenig W. Independent association of various smoking characteristics with markers of systemic inflammation in men. Results from a representative sample of the general population (MONICA Augsburg Survey 1994/95) Eur Heart J. 2003;24:1365–72. doi: 10.1016/s0195-668x(03)00260-4. [DOI] [PubMed] [Google Scholar]
- 26.Dandona P, Aljada A, Bandyopadhyay A. Inflammation: the link between insulin resistance, obesity and diabetes. Trends Immunol. 2004;25:4–7. doi: 10.1016/j.it.2003.10.013. [DOI] [PubMed] [Google Scholar]
- 27.Bastard JP, Maachi M, Lagathu C, et al. Recent advances in the relationship between obesity, inflammation, and insulin resistance. Eur Cytokine Netw. 2006;17:4–12. [PubMed] [Google Scholar]
- 28.Tucker KL, Hallfrisch J, Qiao N, Muller D, Andres R, Fleg JL. The combination of high fruit and vegetable and low saturated fat intakes is more protective against mortality in aging men than is either alone: the Baltimore Longitudinal Study of Aging. J Nutr. 2005;135:556–61. doi: 10.1093/jn/135.3.556. [DOI] [PubMed] [Google Scholar]
- 29.Elosua R, Bartali B, Ordovas JM, Corsi AM, Lauretani F, Ferrucci L. Association between physical activity, physical performance, and inflammatory biomarkers in an elderly population: the InCHIANTI study. J Gerontol A Biol Sci Med Sci. 2005;60:760–7. doi: 10.1093/gerona/60.6.760. [DOI] [PubMed] [Google Scholar]
- 30.Petersen AM, Pedersen BK. The anti-inflammatory effect of exercise. J Appl Physiol. 2005;98:1154–62. doi: 10.1152/japplphysiol.00164.2004. [DOI] [PubMed] [Google Scholar]
- 31.Yan H, Kuroiwa A, Tanaka H, Shindo M, Kiyonaga A, Nagayama A. Effect of moderate exercise on immune senescence in men. Eur J Appl Physiol. 2001;86:105–11. doi: 10.1007/s004210100521. [DOI] [PubMed] [Google Scholar]
- 32.Gurm HS, Bhatt DL, Lincoff AM, et al. Impact of preprocedural white blood cell count on long term mortality after percutaneous coronary intervention: insights from the EPIC, EPILOG, and EPISTENT trials. Heart. 2003;89:1200–4. doi: 10.1136/heart.89.10.1200. [DOI] [PMC free article] [PubMed] [Google Scholar]
- 33.Kawaguchi H, Mori T, Kawano T, Kono S, Sasaki J, Arakawa K. Band neutrophil count and the presence and severity of coronary atherosclerosis. Am Heart J. 1996;132:9–12. doi: 10.1016/s0002-8703(96)90384-1. [DOI] [PubMed] [Google Scholar]
- 34.Chapman CML, Beiby JP, McQuillan BM, Thompson PL, Hung J. Monocyte count, but not C-reactive protein or interleukin-6, is an independent risk marker for subclinical carotid atherosclerosis. Stroke. 2004;35:1619–24. doi: 10.1161/01.STR.0000130857.19423.ad. [DOI] [PubMed] [Google Scholar]