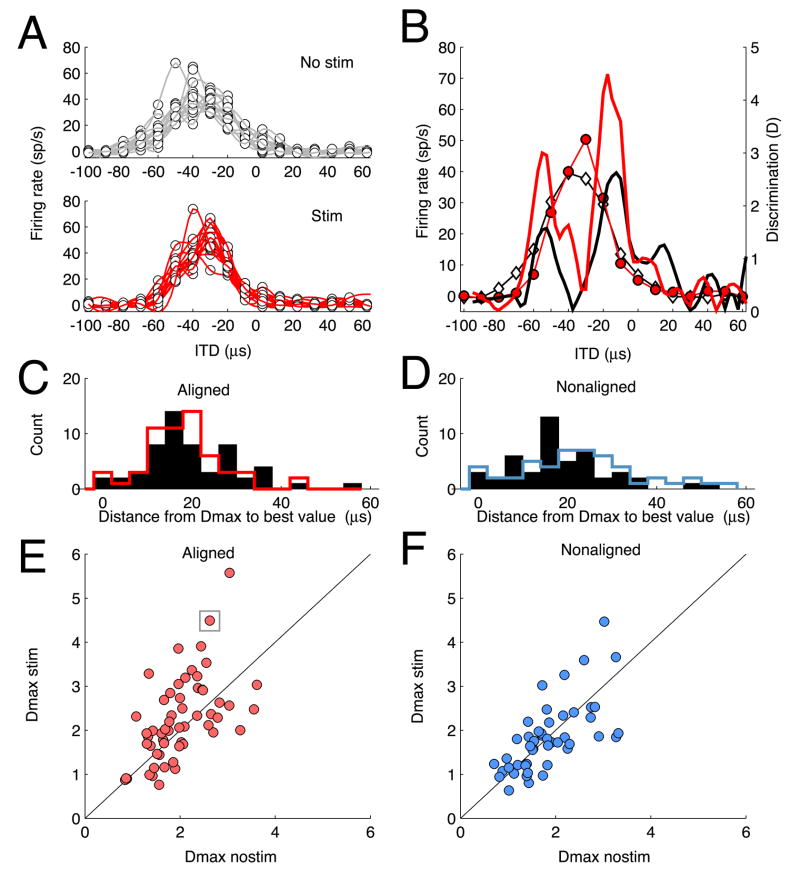
Figure 4.
Effect of AGFa microstimulation on stimulus discrimination at aligned and nonaligned sites. A) Top: Firing rate as a function of stimulus ITD for trials without AGFa microstimulation. Each dot represents the firing rate evoked (ordinate) in response to the corresponding stimulus ITD (abscissa); each thin line represents the spline-fit to the firing rates evoked on a single repetition of a complete set of ITD values. Bottom: Firing rate as a function of stimulus ITD for trials with AGFa microstimulation. Conventions are the same as for Top. B) Comparison of ITD tuning and calculated values of D with (red) and without (black) AGFa microstimulation; the data are from the same site as in A. The average spline-fits to the response data with (red lines and circles) and without (black lines and white diamonds) AGFa microstimulation are plotted in the background (Dmaxnostim = 2.6; Dmaxstim = 4.5. C). Distribution of absolute differences between best ITD and Dmax ITD for aligned sites. Black bars: histogram of differences from best ITD to Dmax ITD without AGFa microstimulation; Red line: histogram of differences from best ITD to Dmax ITD with AGFa microstimulation. These distributions were not different (p> 0.5, t-test). D) Distribution of absolute differences between best ITD and Dmax ITD for nonaligned sites. Conventions the same as in C. Black bars: histogram of differences from best ITD to Dmax ITD without AGFa microstimulation; Red line represents the histogram of differences from best ITD to Dmax ITD with AGFa microstimulation. These distributions were not different (p> 0.5, t-test). E) Scatter plot comparing Dmax values with and without AGFa microstimulation for aligned sites. Ordinate: Dmaxstim; abscissa: Dmaxnostim. Each symbol represents one OT site; the boxed symbol indicates data for the site shown in A and B. The diagonal line represents equal values of Dmax with and without AGFa microstimulation. F) Scatter plot comparing Dmax values with and without AGFa microstimulation for nonaligned sites; plotted as described for C.

