Abstract
The majority of known Toxoplasma gondii isolates from Europe and North America belong to three clonal lines that differ dramatically in their virulence, depending on the host. To identify the responsible genes, we mapped virulence in F1 progeny derived from crosses between type II and type III strains, which we introduced into mice. Five virulence (VIR) loci were thus identified, and for two of these, genetic complementation showed that a predicted protein kinase (ROP18 and ROP16, respectively) is the key molecule. Both are hypervariable rhoptry proteins that are secreted into the host cell upon invasion. These results suggest that secreted kinases unique to the Apicomplexa are crucial in the host-pathogen interaction.
Toxoplasma gondii is an obligate intracellular parasite capable of infecting a wide variety of warm-blooded animals. Infections are widespread in humans and can lead to severe disease in utero or in individuals with a suppressed immune system. The majority of European and North American isolates belong to three distinct clonal lines, referred to as types I, II, and III (1, 2). Types I and III appear to be the result of just one or two matings between an ancestral type II strain and, respectively, one or other of a pair of closely related strains that are distinct from type II (3–6). The three major Toxoplasma lines differ in a number of phenotypes (7), the best described of which is virulence in mice: type I strains are the most virulent with a lethal dose (LD100) of one parasite (8, 9), whereas types II and III have values for median lethal dose (LD50) that range from 102 to 105. There may also be differences in the virulence of the three strains in humans (10–12).
Previously (3), we demonstrated that a cross between a type II and a type III strain produced F1 progeny (S23 and CL11) that were more virulent (up to 3 logs) than 14 of their siblings (3). Because only two of the 16 progeny showed this difference, it was likely that multiple loci controlled virulence in these strains, and to identify these loci, we phenotyped 23 additional recombinant F1 progeny from II × III crosses (13, 14). Progeny with high virulence were identified by infecting mice with 100 tachyzoites; progeny with very low virulence were identified by infecting mice with 100,000 parasites.
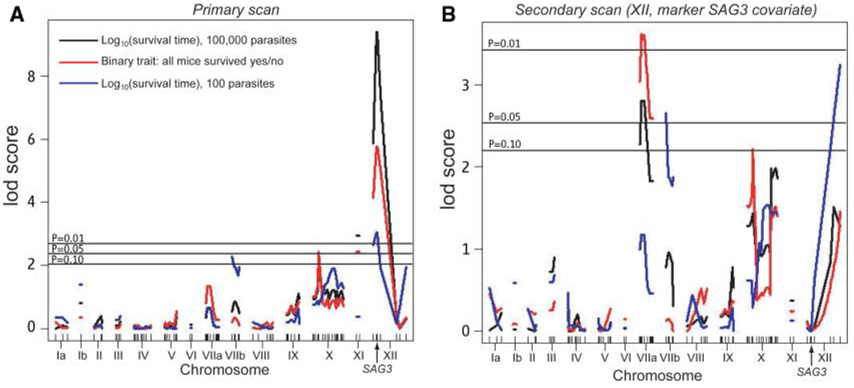
The parental type III clone was significantly less virulent than the parental type II clone, and among the recombinant progeny, a range of distinct phenotypes was observed (table S1). Injection of 100 parasites of some progeny (including strain S23 described above) resulted in uniform acute mortality in mice. There was also a large class of avirulent clones, unable to kill mice even when injected at the high dose (100,000) (table S1). The log-likelihood of association of virulence phenotypes with genetic markers was analyzed for three different phenotypes: (i) “high-dose survivability” (log10 of the survival time after injection of 100,000 parasites); (ii) “avirulence,” a binary trait defined as no mortality at any dose; and (iii) “low-dose survivability” (log10 of the survival time after injection of 100 parasites). In the initial genome scan (15), two quantitative trait loci (QTLs) were identified: one that was highly significant at the left end of chromosome XII (VIR1) and one of borderline significance on chromosome X (VIR2) (Fig. 1A). A high logarithm of odds (LOD) score in such analyses, as seen for the chromosome XII QTL, can obscure the contribution of other loci, especially when the number of progeny being analyzed is limited. When the variance associated with the QTL at the beginning of chromosome XII was fixed as a covariate, three additional QTLs emerged as significant (Fig. 1B): one each on chromosomes VIIa (VIR3), VIIb (VIR4), and toward the right end of chromosome XII (VIR5). (See table S2 for a complete summary of all QTLs and their effects.)
Fig. 1.
Genetic mapping of virulence phenotypes of F1 progeny from II × III crosses. BALB/c and CBA/J mice were infected with 100,000 or 100 tachyzoites from 40 different F1 recombinant progeny from II × III crosses, and mortality was recorded daily for 40 days. As there were no significant differences between the two different mouse strains, results were pooled. Three phenotypes are represented: (i) “high-dose survivability,” log10 survival time (in days) after injection of 100,000 parasites (black line); (ii) “avirulence,” a binary trait defined as no mortality at any dose (red line); (iii) “low-dose survivability,” log10 survival time (in days) after injection of 100 parasites (blue line). Plots indicate the log-likelihood association of phenotypes with markers aligned across the genome. Marker positions (in cM) are given by tick marks. Significance levels determined by 1000 permutations are indicated by horizontal lines [upper lines are significant; lower line is suggestive (P = 0.1)]. Because the significance levels for all three of the phenotypes differed by less than 0.1 LOD unit, only one significance line is drawn for all three. (A) Primary genome scan (see text). (B) Secondary genome scan after the effect of the major virulence peak on chromosome XII, evident in (A) and cosegregating with the SAG3 marker, is neutralized by making it a covariate.
Although the genomic regions spanned by the detected QTLs are large [~1 megabase (Mb)], we identified candidate genes on the basis of predicted coding function (16, 17), amount of polymorphism (5), and gene expression information [expressed sequence tags (EST) frequencies (18) and microarray data (this study)]. Of particular interest were polymorphic genes whose products were predicted to interact with the host (i.e., expected to be secreted into and/or beyond the parasitophorous vacuole) and with differences in expression between the type II and type III strains.
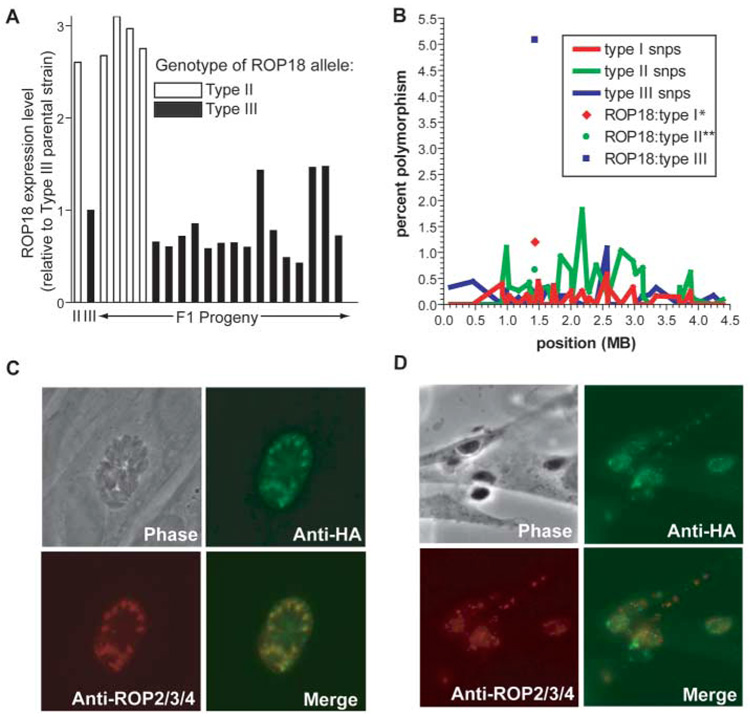
The VIR3 QTL spans a maximum of ~1.1 Mb within which there are 140 predicted proteins (16, 17). ROP18 stood out as the strongest candidate gene within this interval for a number of reasons. First, it has high homology to the ROP2 family of serine-threonine protein kinases in Toxoplasma, which are released from specialized apical secretory organelles, called rhoptries, that are unique to the Apicomplexa. Second, ROP18 was previously identified in our laboratory as part of the rhoptry proteome [ROP2L2 of (19)] and has recently been confirmed to be a functional kinase (20) that ends up in the parasitophorous vacuole after host cell invasion (20, 21). Third, expression levels of ROP18 are very different between strains: Initial microarray results indicated that strains having the type III allele expressed significantly less mRNA than those with a type II allele, and quantitative polymerase chain reaction (QPCR) showed this difference to be on the order of 10,000-fold (Fig. 2A and fig. S3A). Analysis of the F1 progeny showed that this difference cosegregates with the VIR3 QTL (fig. S1; peak LOD score 4.5, P < 0.01). Sequencing the entire ROP18 gene (including promoter regions) and comparing type I, II, and III strains revealed that type III strains have a 2.1-kb sequence inserted 85 bp upstream of the ATG start codon, which is not present in type I or type II ROP18, or anywhere else in the only fully sequenced Toxoplasma genome (from a type II strain) (16, 17). It seems likely that this insertion (relative to types I and II) in the 5′-untranslated region (UTR)–promoter of the type III ROP18 allele is involved in the major difference in expression of this locus in type III strains, although this has not been directly tested. Last, ROP18 is found in a genomic span that is generally dominated by type II–specific single-nucleotide polymorphisms (SNPs) on the basis of polymorphism maps derived from EST sequences (5) and, as predicted by this, the type II ROP18 allele [(16) Gene model 20.m03896] has 11 (0.66%) SNPs in the coding region relative to types I (GenBank accession number CAJ27113) and III (GenBank accession number EF092842) (Fig. 2B). Super-imposed on this expected level of polymorphism, however, is a completely unexpected and extremely large number (85; 5.0%) of type III–specific SNPs (64 of which result in amino acid changes) (Fig. 2B).
Fig. 2.
Expression level, polymorphism analysis, and localization of ROP18. (A) Expression level of ROP18 in the parental lines (type II, ME49, and type III, CEP) and 18 F1 progeny. Data are displayed as fold-difference relative to the type III parent. The genotype for each of the F1 progeny at the ROP18 locus is indicated by the bar color (white or black). (B) Variation in the percentage of type I, II, and III SNP polymorphisms across chromosome VIIa. The entire chromosome was divided into 10-kb windows, and the number of SNPs of each type in each window [based on EST assemblies; see (5)] was divided by the number of sites with data from all three strains to compute a polymorphism percentage. The number of each polymorphism type in the ROP18 coding region is also shown. *Accession number AM075204 (28). **Downloaded from (16) (Gene model 20m.03896). (C) Immunofluorescence assay of type III:ROP18II showing HA-specific staining (green) of HA-tagged ROP18 colocalizing with the rhoptry marker ROP2/3/4 (red) in human foreskin fibroblasts 40 hours post inoculation. (D) Immunofluorescence assay of type III:ROP18II showing HA-specific staining of tagged ROP18 in human foreskin fibroblasts 2 hours post inoculation. Punctate staining indicates the location of ROP18-HA that has been secreted into the infected host cell (22). Color scheme same as in (C).
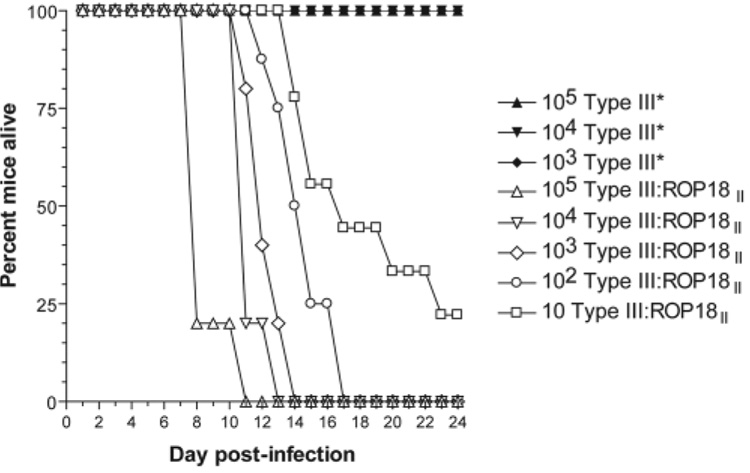
To determine whether ROP18 was in fact the VIR3 QTL, we introduced a type II (ME49) allele of ROP18 into an avirulent type III background (CEP). This was done by cloning the type II gene (with 588 bp of endogenous promoter and the complete coding region) in frame with a C-terminal hemagglutinin (HA) tag. HA-specific antibody immunofluorescence on the resulting parasites revealed the presence of ROP18-HA in the rhoptries as expected (Fig. 2C), and also in vacuole-like structures within the host cell early after infection (Fig. 2D), similar to those previously observed for other rhoptry proteins (22). In BALB/c mice, these type III:ROP18II parasites were at least 4 logs more virulent than the wild type strain (Fig. 3). A second, genetically distinct type III:ROP18II clone (from a different transfection than the clone described in Fig. 3) was isolated that had similarly enhanced virulence in mice.
Fig. 3.
Effect of expressing the type II allele for ROP18 in a type III strain background (CEP) on virulence in mice. Mice were infected intra-peritoneally with either CEPΔhxgprt complemented with HXGPRT alone (CEP*) or CEP parasites complemented with the type II allele for ROP18 along with 588 bp of upstream sequence (type III:ROP18II). Infections were verified in all the survivors based on the presence of Toxoplasma-specific antibodies, and only seropositive survivors are represented on the graph. Ten mice were used for all strain and dose combinations except for type III:ROP18II-100 (eight mice) and type III:ROP18II-10 (seven mice).
It is likely that the differences in the expression levels of ROP18 are enough to account for the large difference in virulence between type III:ROP18II and the wild-type line (CEP), and ROP18 levels were about eight times as high in the virulent type III:ROP18II as in a type II strain (fig. S3). However, the large number of polymorphisms in the type III coding region could also play a role, and future experiments using strains with allelic replacement of coding and/or promoter sequences will distinguish between these possibilities. Consistent with the results presented here, a separate study examining progeny from a cross between types I and III to determine the genetic basis for the extreme virulence of type I strains, Taylor et al. (21) found that expression of the type I ROP18 allele in an avirulent type III strain also dramatically increases virulence in mice. These data confirm that ROP18 is indeed a virulence gene and is likely the genetic basis for the virulence QTL on chromosome VIIa that was identified in both studies (9, 21).
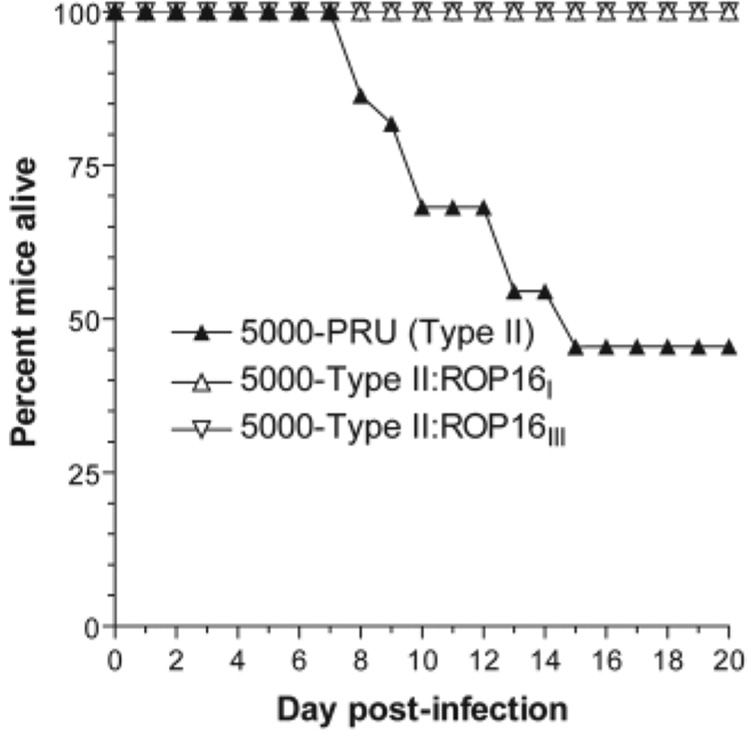
VIR4 falls within a 0.55-Mb interval on chromosome VIIb.Within this candidate region, one locus, ROP16, immediately stood out because of its extreme variability [the type II allele has 39 nonsynonymous SNPs compared with types I and III in ~2100 bp of coding sequence (23)], its status as a rhoptry protein kinase (and thus likely injected during invasion), and our recent results demonstrating that this rhoptry protein kinase is injected into the host cell cytosol and is involved in the strain-specific differences in induction of interleukin 12 (IL-12) secretion by mouse macrophages (23) [IL-12 is well known to be key in Toxoplasma pathogenesis (24, 25)]. To test whether ROP16 was indeed the VIR4 QTL, we introduced either a type III or a type I allele of ROP16 into a type II strain. Both alleles were pursued because our previous studies indicated that the type II allele is recessive (loss of function) to both the type I and type III alleles, and the type I and type III alleles have only three nonsynonymous SNPs between them (23). The engineered strains were injected into mice, and virulence was compared with that of parental type II. The results (Fig. 4) show a substantial decrease in virulence in the strains carrying either the type I or the type III transgene. This is consistent with our QTL analyses, which indicate that the type III allele is associated with lower virulence (table S1). Obtaining two genetically distinct clones (type II:ROP16I and type II:ROP16III) with identical virulence phenotypes argues against finding the insertion site of the DNA construct to be responsible for the drop in pathogenicity.
Fig. 4.
Effect of expressing the type I and III strain allele of ROP16 in the type II Prugniaud strain (PRUΔhxgprt) on virulence in mice. Mice were infected intraperitoneally with 5000 tachyzoites of type II (PRUΔhxgprt) or an engineered version expressing an HA-tagged copy of the ROP16 allele from the type III CEP strain (type II:ROP16III) or the type I RH strain (type II:ROP16I). For PRUΔhxgprt, 24 mice were used, 10 for type II:ROP16III, and 14 for type II:ROP16I. Infections were verified in all the survivors on the basis of the presence of Toxoplasma-specific antibodies. Results from three independent experiments were pooled.
The results presented above strongly support the idea that polymorphic rhoptry kinases provide the genetic basis for two of the virulence QTLs mapped here. The identities of the genes contributing to the other three VIR loci are not yet known: None had a candidate gene as compelling as ROP16 and ROP18 (see supplementary results for a discussion of the other three loci). In no case do any of the five VIR loci appear to mediate virulence through an enhancement in growth, because no significant growth phenotype was seen for any of the F1 progeny strains reported here, with the notable exception of CL15 which, as reported previously, has a substantial growth retardation (3). Furthermore, simple growth rate is not likely the basis of the virulence differences, because the parental type III strain has a slight growth advantage compared with the ME49 strain despite its being less virulent (26). ROP18 has recently been shown to be an active kinase capable of phosphorylating a parasite protein of unknown identity (20), and ROP16 has all of the key residues known to be crucial for kinase activity (23). In the case of ROP16, we have recently reported that its expression impacts several host transcription pathways, including those mediated by STAT3/6 (23). Available evidence, however, suggests that neither STAT3 nor STAT6 is a direct substrate of this kinase, although both are differentially phosphorylated depending on the allele of ROP16 present in the infecting strain (23). Identification of the physiological substrates for ROP16 and ROP18 will yield great insights into their function.
The extreme sequence divergence observed for ROP16 and ROP18 could be a result of immune selection, but it is striking that these proteins are substantially more different among the three strains than the major surface antigens, SAG1 and SAG2 (3), which are highly immunogenic (at least in terms of antibodies) and thus are likely to represent an extreme for targets of selective pressure. It could be that ROP16 and ROP18 are subject to immune pressure by Tcell responses rather than by antibodies (the major T cell antigens of Toxoplasma are not known, but the presence of ROP16 and ROP18 within the infected host cell would make them readily available for antigen presentation). For ROP18, pairwise comparisons of nonsynonymous to synonymous SNPs among the three alleles suggests that selection is operating on type I and type II ROP18. All 28 SNPs between them result in amino acid changes; the ratio of nonsynonymous nucleotide substitutions to synonymous nucleotide substitutions (Ka/Ks) is 4.6 (27) (fig. S2B). It is less clear how much selection has operated on the type III allele, where 20 of the 85 SNPs specific to this strain are synonymous, which gives Ka/Ks values closer to 1.0 [a ratio expected under a neutral selection model (fig. S2B); Ka/Ks = 1.7 and 1.3 versus type I and type II alleles, respectively]. It is possible that the very low expression of ROP18 in type III strains makes type III ROP18 a “null” allele that can more readily accumulate random mutation, although the level of variation in this allele is so atypical for this strain and genomic region (Fig. 2B) (5) that both positive selection and neutral drift may have operated on this allele over time. It will be key to sequence the ROP18 gene in other T. gondii isolates to determine the range of selective pressure at this locus in the population. Finally, instead of immune pressure, another possibility is that at least some of the sequence divergence of these genes could be a result of optimization for interaction with specific proteins (e.g., their substrates) in one or more hosts that are central to their transmission. It is difficult to predict what those hosts are or were but Mus spp. has probably not played that role for all three strain types, given the very different allele-specific interactions described here. Rather, other species of rodents or birds that are central to the parasite’s transmission, perhaps in distinct parts of the world, could be the true, evolutionarily relevant hosts in which selection for different versions of these key genes occurred.
Supplementary Material
www.sciencemag.org/cgi/content/full/314/5806/1780/DC1
Materials and Methods
SOM Text
Figs. S1 to S3
Tables S1 and S2
References
References and Notes
- 1.Howe DK, Sibley LD. J. Infect. Dis. 1995;172:1561. doi: 10.1093/infdis/172.6.1561. [DOI] [PubMed] [Google Scholar]
- 2.Darde ML, Bouteille B, Pestre-Alexandre M. J. Parasitol. 1992;78:786. [PubMed] [Google Scholar]
- 3.Grigg ME, Bonnefoy S, Hehl AB, Suzuki Y, Boothroyd JC. Science. 2001;294:161. doi: 10.1126/science.1061888. [DOI] [PubMed] [Google Scholar]
- 4.Lehmann T, Blackston CR, Parmley SF, Remington JS, Dubey JP. J. Parasitol. 2000;86:960. doi: 10.1645/0022-3395(2000)086[0960:STOTGC]2.0.CO;2. [DOI] [PubMed] [Google Scholar]
- 5.Boyle JP, et al. Proc. Natl. Acad. Sci. U.S.A. 2006;103:10514. doi: 10.1073/pnas.0510319103. [DOI] [PMC free article] [PubMed] [Google Scholar]
- 6.Su C, et al. Science. 2003;299:414. doi: 10.1126/science.1078035. [DOI] [PubMed] [Google Scholar]
- 7.Saeij JP, Boyle JP, Boothroyd JC. Trends Parasitol. 2005;21:476. doi: 10.1016/j.pt.2005.08.001. [DOI] [PubMed] [Google Scholar]
- 8.Sibley LD, Boothroyd JC. Nature. 1992;359:82. doi: 10.1038/359082a0. [DOI] [PubMed] [Google Scholar]
- 9.Su C, Howe DK, Dubey JP, Ajioka JW, Sibley LD. Proc. Natl. Acad. Sci. U.S.A. 2002;99:10753. doi: 10.1073/pnas.172117099. [DOI] [PMC free article] [PubMed] [Google Scholar]
- 10.Howe DK, Honore S, Derouin F, Sibley LD. J. Clin.Microbiol. 1997;35:1411. doi: 10.1128/jcm.35.6.1411-1414.1997. [DOI] [PMC free article] [PubMed] [Google Scholar]
- 11.Honore S, et al. Pathol. Biol. (Paris) 2000;48:541. [PubMed] [Google Scholar]
- 12.Boothroyd JC, Grigg ME. Curr. Opin. Microbiol. 2002;5:438. doi: 10.1016/s1369-5274(02)00349-1. [DOI] [PubMed] [Google Scholar]
- 13.Khan A, et al. Nucleic Acids Res. 2005;33:2980. doi: 10.1093/nar/gki604. [DOI] [PMC free article] [PubMed] [Google Scholar]
- 14.Sibley LD, Boothroyd JC. Mol. Biochem. Parasitol. 1992;51:291. doi: 10.1016/0166-6851(92)90079-y. [DOI] [PubMed] [Google Scholar]
- 15.Materials and methods are available as supporting material on Science Online.
- 16.Toxoplasma database. www.ToxoDB.org.
- 17.Kissinger JC, Gajria B, Li L, Paulsen IT, Roos DS. Nucleic Acids Res. 2003;31:234. doi: 10.1093/nar/gkg072. [DOI] [PMC free article] [PubMed] [Google Scholar]
- 18.Li L, et al. Genome Res. 2003;13:443. doi: 10.1101/gr.693203. [DOI] [PMC free article] [PubMed] [Google Scholar]
- 19.Bradley PJ, et al. J. Biol. Chem. 2005;280:34245. doi: 10.1074/jbc.M504158200. [DOI] [PubMed] [Google Scholar]
- 20.El Hajj H, et al. PLoS Pathogens. in press. [Google Scholar]
- 21.Taylor S, et al. Science. 2006;314:1776. doi: 10.1126/science.1133643. [DOI] [PubMed] [Google Scholar]
- 22.Hakansson S, Charron AJ, Sibley LD. EMBO J. 2001;20:3132. doi: 10.1093/emboj/20.12.3132. [DOI] [PMC free article] [PubMed] [Google Scholar]
- 23.Saeij JPJ, et al. Nature. in press. [Google Scholar]
- 24.Robben PM, et al. J. Immunol. 2004;172:3686. doi: 10.4049/jimmunol.172.6.3686. [DOI] [PubMed] [Google Scholar]
- 25.Wille U, Villegas EN, Craig L, Peach R, Hunter CA. Infect. Immun. 2002;70:6940. doi: 10.1128/IAI.70.12.6940-6947.2002. [DOI] [PMC free article] [PubMed] [Google Scholar]
- 26.Sibley LD, LeBlanc AJ, Pfefferkorn ER, Boothroyd JC. Genetics. 1992;132:1003. doi: 10.1093/genetics/132.4.1003. [DOI] [PMC free article] [PubMed] [Google Scholar]
- 27.Li WH. J. Mol. Evol. 1993;36:96. doi: 10.1007/BF02407308. [DOI] [PubMed] [Google Scholar]
- 28.El Hajj H, Lebrun M, Fourmaux MN, Vial H, Dubremetz JF. Cell Microbiol. 2006 doi: 10.1016/j.molbiopara.2005.10.011. published online 10.1111/j.1462-5822.2006.00767.x. [DOI] [PubMed] [Google Scholar]
- 29.This work was supported by grants to J.C.B. from the NIH (AI21423, AI30230, and AI41014) and the Ellison Medical Foundation (a Senior Scholar Award); to L.D.S. from the NIH (AI36629, AI059176); to J.W.A. from the U. K. Biotechnology and Biological Sciences Research Council and the Wellcome Trust; to J.P.J.S from the California Universitywide AIDS Research Program (F04-ST-216); to S.C. from the California Universitywide AIDS Research Program (FT-207-ST); and to J.P.B. from the NIH (F32AI60306). We thank J. D. Dunn for construction of the pGRA-HA-HPT vector; A. Fouts for help with QPCR; K. W. Broman for his many helpful suggestions on using the R/qtl package; P. Bradley and J.-F. Dubremetz for exchange of unpublished data; E. Pfefferkorn for performing the original crosses as part of a collaboration on drug resistance; the U. K. Medical Research Council MRC HGMP for printing the Toxoplasma microarrays; and M. White, J. Wootton, and J.-F. Dubremetz for helpful comments on the manuscript. Preliminary genomic and/or cDNA sequence data were accessed from ToxoDB.org and/or www.tigr.org/tdb/t_gondii/. Genomic data were provided by The Institute for Genomic Research (supported by the NIH grant AI05093) and by the Sanger Center (Wellcome Trust). EST sequences were generated by Washington University (NIH grant 1R01AI045806-01A1). The GenBank accession number for the ROP18 sequence from the type III strain CTG is EF092842.
Associated Data
This section collects any data citations, data availability statements, or supplementary materials included in this article.
Supplementary Materials
www.sciencemag.org/cgi/content/full/314/5806/1780/DC1
Materials and Methods
SOM Text
Figs. S1 to S3
Tables S1 and S2
References


