

Abstract
[11C]Loperamide has been proposed for imaging P-glycoprotein (P-gp) function with positron emission tomography (PET), but its metabolism to [N-methyl-11C]N-desmethyl-loperamide ([11C]dLop; [11C]3) precludes quantification. We considered that [11C]3 might itself be a superior radiotracer for imaging brain P-gp function and therefore aimed to prepare [11C]3 and characterize its efficacy. An amide precursor (2) was synthesized and methylated with [11C]iodomethane to give [11C]3. After administration of [11C]3 to wild type mice, brain radioactivity uptake was very low. In P-gp (mdr-1a (−/−)) knockout mice, brain uptake of radioactivity at 30 min increased about 3.5 fold by PET measures, and over seven-fold by ex vivo measures. In knockout mice, brain radioactivity was predominantly (90%) unchanged radiotracer. In monkey PET experiments, brain radioactivity uptake was also very low, but after P-gp blockade increased more than seven-fold. [11C]3 is an effective new radiotracer for imaging brain P-gp function and, in favor of future successful quantification, appears free of extensive brain-penetrant radiometabolites.
Keywords: P-gp, PET, radiotracer, carbon-11, N-desmethyl-loperamide
Introduction
P-Glycoprotein (P-gp) is a protein that functions as an ATP-dependent efflux pump for a wide range of xenobiotics at the blood-brain barrier1 and at membrane barriers in several other organs2, such as small intestine, liver and kidney. P-gp is also often highly expressed in tumors.2 Hence, P-gp can be a severe obstacle to the penetration of established or developmental drugs into the targeted organ or tumor.3 In neurology, P-gp may, for example, be an obstacle to the brain penetration of anti-HIV drugs.4 In oncology, P-gp plays a major role in ‘multi-drug resistance’5, which is directly responsible for the failure of a high proportion of attempted chemotherapy. Altered expression of P-gp may also contribute to the progression of neurodegenerative disorders, such as Alzheimer’s disease6,7,8, HIV encephalitis9 and Parkinson’s disease10. Hence, elucidation of the expression and function of P-gp in human subjects in vivo could be of great importance in both drug development and medicine. Moreover, in the field of developing molecular imaging agents for use with positron emission tomography (PET) or single photon emission computed tomography (SPECT), the effect of P-gp is also frequently encountered, for example, in limiting the brain entry of some neuroreceptor radioligands11,12. These same imaging modalities, with radiotracers based on P-gp substrates, have been proposed for examining P-gp function in vivo (for a review, see reference 13). The most widely examined radiotracers include [11C]colchicine14, [11C]verapamil15,16, [11C]daunorubicin15, [18F]paclitaxel17, [94mTc]sestamibi18 and [11C]loperamide19,20 for PET, and [99mTc]sestamibi for SPECT21. Many of these radiotracers suffer from one or more limitations (e.g., difficult radiosynthesis, low sensitivity or troublesome metabolism), which have so far compromised their use for sensitive and quantitative assessment of P-gp function in vivo, especially in human subjects.
Loperamide is sold over-the-counter as an antidiarrheal agent that acts through agonism of gut μ-opioid receptors.22 This drug is normally without harmful central effects solely because P-gp excludes it from brain.23 We were attracted to [11C]loperamide (Figure 1) as a prospective radiotracer for evaluating brain P-gp function, because of its safety in human subjects and apparent ease of radiosynthesis19,20. However, our initial investigations showed that [11C]loperamide is heavily metabolized. 24 Demethylation 25 , 26 of [11C]loperamide gave [N-methyl-11C]N-desmethyl-loperamide ([11C]dLop; [11C]3; Figure 1) as a radiometabolite that also behaved as an avid substrate for P-gp.24 The penetration of [11C]3 into brain, under conditions in which P-gp is absent or inhibited, thwarts the quantitative analysis of P-gp function with [11C]loperamide, since PET is unable to distinguish between different radioactive species in the field-of-view; no quantitation of P-gp function has yet been achieved with this radiotracer. We considered that [11C]3 itself could be a superior radiotracer, mainly because its metabolism might be expected to be less troublesome for eventual quantification of brain P-gp function. Thus, metabolism of [11C]3 is also expected to occur by demethylation26, but to lead only to single-carbon radiometabolites, such as [11C]methanol. These radiometabolites will be oxidized and ultimately expired as [11C]carbon dioxide; they should not accumulate in tissues accessed by the radiotracer to cause difficulty in biomathematical analysis of acquired PET data. Moreover, as a known metabolite of loperamide, 3 would be safe to administer to human subjects in tracer doses. This study describes an effective synthesis of [11C]3 for its safe intravenous administration (Scheme 1) and the evaluation of [11C]3 in mice with PET and ex vivo measurements, and in monkey with PET. [11C]3 shows highly favorable properties as a new radiotracer for the potential quantification of brain P-gp function.
Figure 1.
Structures of loperamide and N-desmethyl-loperamide (dLop; 3).
Scheme 1.
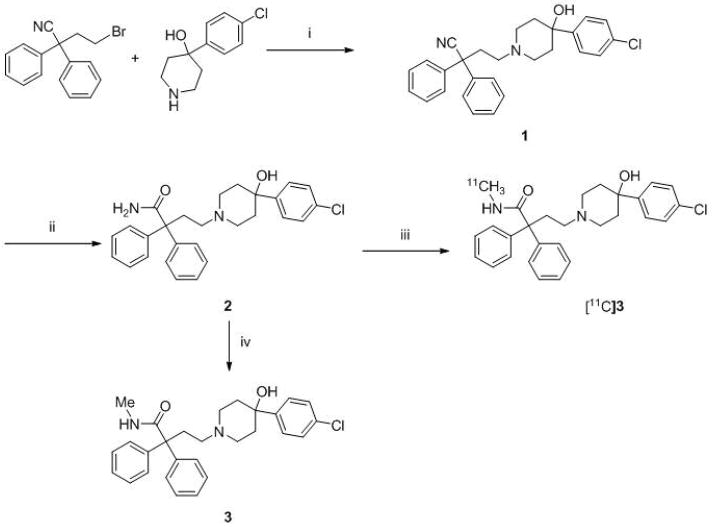
Synthesis of 2, 3, and radiotracer [11C]3.a
a Reagents, conditions and yields: (i) DIPEA, MeCN, 70 °C, 31 h, yield 69%; (ii) KOH, tBuOH, 100 °C, 3 d, yield 37%; (iii) [11C]MeI, KOH, DMSO, 80 °C, 5 min, RCY 18% from [11C]carbon dioxide; (iv) MeI, KOH, DMSO, 80 °C, 24 h, 3%.
Results
Chemistry
Compound 1 was obtained in 69% yield by alkylation of 4-(4-chlorophenyl)-4-hydroxylpiperidine with 4-bromo-2,2-diphenylbutyronitrile in the presence of DIPEA (Scheme 1). Slow hydrolysis of 1 with KOH in tBuOH gave the required precursor 2 in 37% yield. Methylation of 2 with iodomethane gave 3 in low yield, but in adequate amount to serve as a chromatographic reference material.
[11C]3 was prepared, ready for intravenous injection, from 2 in 18 ± 2% (n = 20) isolated RCY (decay-corrected radiochemical yield) from cyclotron-produced [11C]carbon dioxide. The radiosynthesis required 40 min. The obtained activity of [11C]3 averaged 1.9 ± 0.8 GBq. Specific radioactivity, decay-corrected to the end of synthesis, averaged 152 ± 48 GBq/μmol. Radiochemical purity exceeded 99% and the product was radiochemically stable for at least 1 h (by radio-HPLC analysis). [11C]3 was well separated with HPLC from precursor 2 and other impurities (Figure 2). Thus, chemical impurities were low and estimated as < 1 nmol per batch by assuming that the impurities have the same extinction coefficient at 225 nm in the radio-HPLC analysis.
Figure 2.
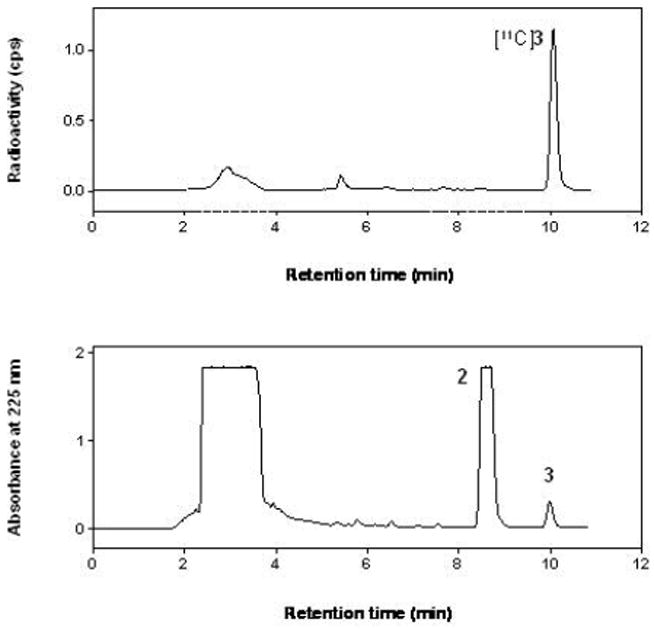
Chromatograms from the HPLC separation used in the radiosynthesis of [11C]3. See Experimental for chromatographic conditions.
Computation of cLogP, cLogD and pKa and Measurement of LogD and Apparent pKa
cLogP and cLogD (at pH = 7.4) values for 3 were 4.16 and 3.49, respectively. The measured LogD value of [11C]3 was much lower [2.60 ± 0.04 (n = 6)]. The measured apparent pKa of 3 was between 7.2 and 7.3 and the computed pKa was 7.96.
Pharmacological Screen of 3
At 10 μM concentration, 3 was found to cause < 50% inhibition of binding to 5-HT1A,1B,1D,1E,2A–2C, β1,2, D1,2,5, M1–4, κ-and δ-opiate receptors, and to the norepinephrine and dopamine transporters. Greater than 50% inhibition was observed at α1A,2A–C, D4, H1–3, μ-opiate and σ1,2 receptors, and the serotonin transporter. Corresponding Ki values (nM) were α1A (9.9), α2A (1.0), α2B (7.0), α2C (2.4), D4 (1.1), H1 (4.2), H2 (1.7), H3 (9.3), μ-opiate (0.6), σ1 (0.8), σ2 (1.9) and serotonin transporter (6.2).
PET Imaging of [11C]3 in Mouse Brain
After intravenous injection of [11C]3 into three wild type mice, the average brain uptake of radioactivity measured with PET reached a very low maximum between 2 and 4 min. In three P-gp knockout mice, average maximal brain uptake of radioactivity was higher and occurred between 8 and 20 min. The subsequent decrease in brain radioactivity from all mice was slow. At 35 min after radiotracer injection, forebrain radioactivity concentration was on average 3.6-fold higher in the knockout than in the wild type mice (Figure 3).
Figure 3.
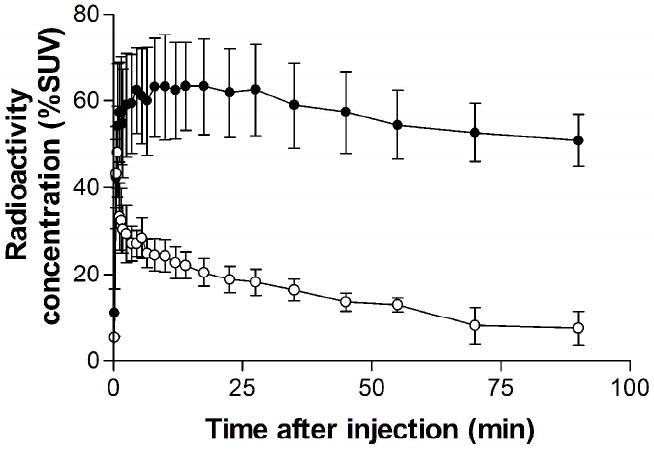
Average time-activity curves in forebrain of three wild type and three P-gp knockout mice determined with PET after the intravenous administration of [11C]3. Key: wild type mice (○); knockout mice (●). Error bars indicate SD.
Measurement of [11C]3 and Radiometabolites in Mouse Brain and Plasma
Recoveries of radioactivity from brain tissue and plasma into acetonitrile for analysis were between 87.0 and 97.1% (92.5 ± 2.9%, n = 18). Radioactive analytes were fully recovered from the HPLC column.
At 30 min after the administration of [11C]3, the total radioactivity concentrations found in plasma were low and very similar between knockout and wild type mice (Table 1). By contrast, total radioactivity concentrations in the forebrains of knockout mice were more than 7-fold higher than the very low concentrations found in wild type mice (Table 1).
Table 1.
Concentration of [11C]3 and its three radiometabolites, [11C]A-[11C]C, in P-gp knockout (KO) and wild -type (WT) mice.
| Forebrain |
Plasma |
|||||
|---|---|---|---|---|---|---|
| Radiochemical species | Concentration (%SUV)* | Ratio KO/WT | Concentration (%SUV)* | Ratio KO/WT | ||
| KO | WT | KO | WT | |||
| [11C]A | 1.3 ± 0.5 | 2.2 ± 0.7 | 0.6 | 12.5 ± 5.7 | 16.9 ± 1.8 | 0.7 |
| [11C]B | 0.3 ± 0.2 | 0.7 ± 0.3 | 0.4 | 7.8 ± 7.7 | 5.5 ± 4.1 | 1.4 |
| [11C]C | 1.6 ± 0.8 | 0.2 ± 0.1 | 8.0 | 0.1 ± 0.1 | 0.1 ± 0.1 | 1 |
| [11C]3 | 35.7 ± 9.9 | 2.3 ± 0.2 | 16 | 1.7 ± 0.3 | 2.8 ± 0.2 | 0.6 |
| Total | 38.9 ± 9.5 | 5.4 ± 1.2 | 7 | 22.1 ± 5.3 | 25.3 ± 2.6 | 0.9 |
Data are mean ± SD.
Three P-gp knockout and 3 wild -type mice were killed 30 min after intravenous injection [11C]3.
Three radiometabolites ([11C]A-[11C]C), all less lipophilic than [11C]3, were detected in mice plasma and brain tissue samples at 30 min after radiotracer injection (Figure 4). The concentrations of unchanged [11C]3 in plasma were on average very low and similar between knockout mice (1.7% SUV) and wild type mice (2.8% SUV) (Table 1). This was also true for the concentrations of each of the three radiometabolites in plasma and for the two most polar radiometabolites, [11C]A and [11C]B, in brain. The least polar radiometabolite, [11C]C, appeared at an 8-fold higher concentration in knockout mouse brain than in wild type mouse brain, but only at a very low absolute level compared to that of [11C]3 (Table 1).
Figure 4.
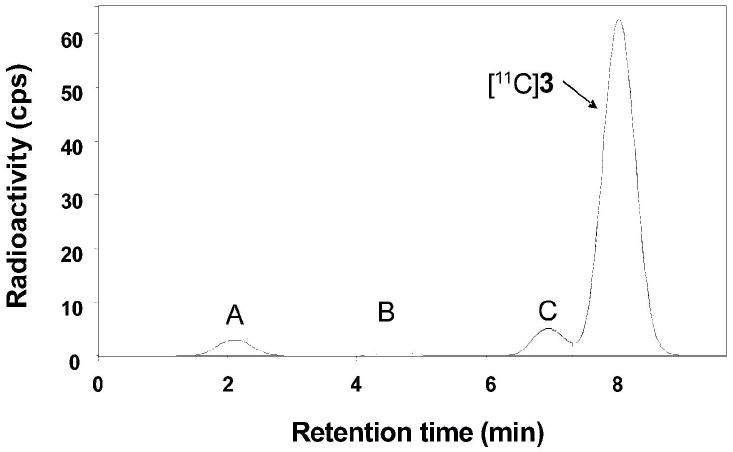
Radiochromatogram of radioactive species in P-gp knockout mouse forebrain at 30 min after the intravenous administration of [11C]3. See Experimental for chromatographic conditions.
On average, [11C]3 was 43.6% of radioactivity in forebrains of wild type mice, while in the knockout mice this value increased to 91.3%. The uptake of [11C]3 was 16-fold higher in forebrains of knockout mice than in those of wild type mice (Table 1).
The ratios of [11C]3 concentration in forebrain and to that in plasma were close to unity for wild type mice but increased to over twenty for knockout mice (i.e., 35.7% SUV/1.7% SUV, Table 1).
Finally, the concentrations of [11C]3 and of its radiometabolites, [11C]A–C, in cerebellum were very similar to those of forebrain in both wild type and knockout mice (data not shown).
PET Imaging of Monkey Brain with [11C]3
After intravenous injection of [11C]3 into monkey under baseline conditions, the maximal uptake of radioactivity into brain regions was low but well retained (Figure 5A). Temporal cortex showed highest uptake and cerebellum lowest (data for other cortical regions were intermediate and are not shown). In the experiment in which DCPQ had been pre-administered at a dose of 8 mg/kg to pre-block P-gp, radioactivity was taken up more avidly in all measured brain regions, reaching maxima within 30 min (Figure 5B). Brain uptake of radioactivity varied regionally, with putamen showing highest uptake and frontal cortex lowest. In this experiment, the ratio of maximal brain radioactivity to that in the baseline experiment was about five.
Figure 5.
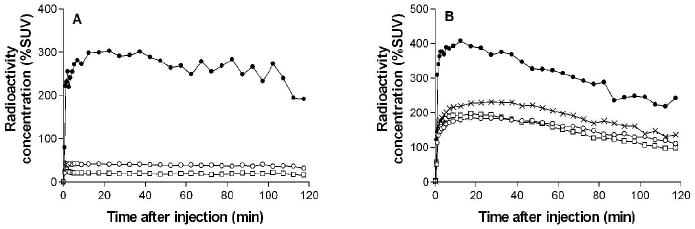
Regional uptake of radioactivity in monkey brain after the administration of [11C]3 under baseline conditions (Panel A), and at 30 min after the intravenous administration of DCPQ (8 mg/kg, i.v.) (Panel B). Key: temporal cortex (○), cerebellum (□), putamen (×) and pituitary (●). In Panel A, data for putamen lie between those of temporal cortex and cerebellum (not shown for Figure clarity). Frontal and parietal cortical regions gave curves similar to those of temporal cortex under each condition.
In both baseline and P-gp blocked experiments, the uptake of radioactivity in the pituitary outside the blood-brain barrier was very high and similar (Figure 5).
PET images of monkey brain, obtained by summing data acquired between 20 and 90 min after intravenous injection of [11C]3 under baseline condition, confirmed uniformly very low uptake of radioactivity into brain (Figure 6A), and very high uptake into pituitary. By contrast, radioactivity was taken up into all brain in the corresponding pre-block experiment, and also seen again in pituitary (Figure 6B).
Figure 6.
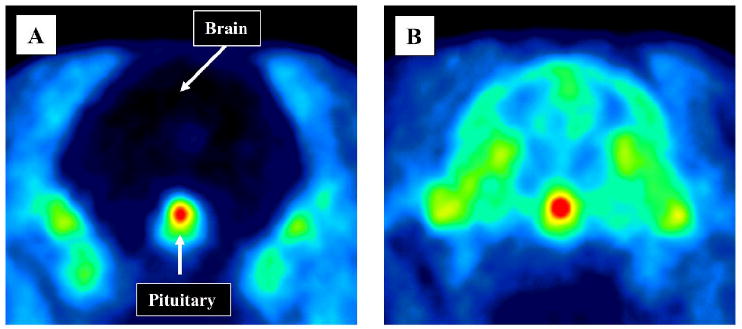
Summed transaxial PET images of the head obtained between 20 to 120 min after the intravenous administration of [11C]3 to monkey under baseline conditions (Panel A) and after P-gp inhibition with DCPQ (8 mg/kg, i.v.) (Panel B).
In experiments in a single monkey, in which the dose of DCPQ administered before [11C]3 was varied between 0 and 16 mg/kg, i.v., radioactivity uptake, averaged between 25 and 50 min, increased almost linearly with dose of DCPQ across all inspected brain regions (Figure 7). Brain uptake of radioactivity varied regionally but quite consistently across all doses of DCPQ. At the highest dose of DCPQ, regional radioactivity concentrations increased between seven-fold (in frontal cortex) and thirteen-fold (in cerebellum) over baseline values.
Figure 7.
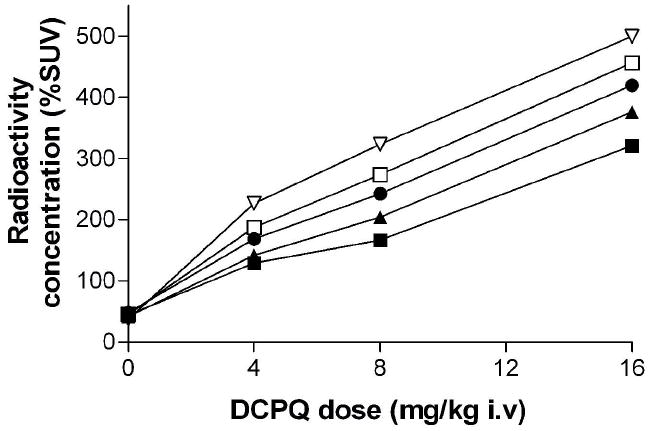
Regional brain uptake of radioactivity after intravenous administration of [11C]3 to monkey – dependence on pre-administered dose of DCPQ. Key: frontal cortex (■); anterior cingulate (▲), hippocampus (●), occipital cortex (□) and cerebellum (▽). Temporal cortex, parietal cortex and putamen gave intermediate curves, but are not shown for Figure clarity.
In the PET experiment in which P-gp was inhibited with DCPQ and the opiate receptor antagonist, naloxone, was administered at 30 min after injection of [11C]3, there was again high early uptake of radioactivity into all examined brain regions. The naloxone had no effect on the rate of washout of radioactivity from these brain regions (see Supporting Information). The administration of DCPQ at either 8 mg/kg or 16 mg/kg i.v. before injection of [11C]3 had no effect on the uptake of radioactivity into pituitary. Moreover, the administration of naloxone at 30 min after radiotracer injection had no effect on washout of radioactivity from pituitary (see Supporting Information). Likewise, administration of either loperamide or 3 at 30 min after [11C]3 in DCPQ-treated monkeys had no discernible effect on the washout of radioactivity from brain (data not shown).
Emergence of Radiometabolites of [11C]3 in Monkey Plasma
After intravenous injection of [11C]3 into monkey under baseline or P-gp blocked conditions, radioactivity concentration in whole blood decreased rapidly and at similar rates (data not shown). The recovery of radioactivity from plasma into supernatant acetonitrile for radio-HPLC analysis was efficient; only very low percentages of radioactivity co-precipitated with protein. As in mice, [11C]3 and three less polar radiometabolites were detected in plasma. The concentration of unchanged [11C]3 in plasma decreased to half of its initial value within 2 min, and was unaffected by pre-administration of DCPQ. The radiometabolites, [11C]a–c, had similar retention times to those observed in mouse plasma and brain ([11C]A–C, tRs = 2.1, 4.5 and 6.9, min, respectively; Figure 4). Although not proven, the monkey radiometabolites are likely to be the same radiochemical species as those in mice. Radiometabolite [11C]b only ever became a low percentage of radioactivity in monkey plasma, but radiometabolites [11C]a and [11C]c gradually increased as a percentage of total radioactivity (Figure 8). In the baseline and P-gp blocked experiments, the times taken for plasma radiometabolite activity to equal that of [11C]3 were very similar (~ 45 min). DCPQ had little effect on the rate at which each radiometabolite emerged in plasma.
Figure 8.

Time course of composition of radioactivity in plasma after intravenous administration of [11C]3 into monkey. Key: [11C]3 (●); [11C]A (△); [ 11C]B (▽); [11C]C (◊); unextracted for analysis (□).
Discussion
The preparation of [11C]3, required a convenient synthesis of the primary amide 1, a compound which, as far as we are aware, has only been mentioned twice in the literature, but without synthesis details.20, 27 The synthesis of 1 was accomplished by a new route in two steps from commercially available materials. Slow hydrolysis of 1 to 2 with potassium hydroxide in tbutanol proved to be a key step; attempts to achieve this step with a multitude of other reagents were unsuccessful. A small quantity of reference 3 was obtained by alkylation of 2 with iodomethane.
[11C]3 was readily prepared for intravenous injection by alkylation of 2 with [11C]iodomethane, itself prepared from cyclotron-produced [11C]carbon dioxide. The whole radiosynthesis was performed in a lead-shielded hot-cell with automated apparatus. Purification by reverse phase HPLC gave [11C]3 in high radiochemical and chemical purity, and high specific radioactivity. The level of specific radioactivity is unlikely to be critical for this radiotracer since it is not targeted at imaging a saturable binding site. The formulated radiotracer was radiochemically stable.
The measured LogD value of [11C]3 was found to be 2.60 and appreciably different to the computed value (3.49). The measured value lies in the range normally considered favorable for good penetration of the blood-brain barrier in the absence of any effect of efflux transporters.28,29
Loperamide has high affinity for μ-opiate receptors. 30 A pharmacological screen found that 3 had high affinity for μ-opiate receptors (Ki = 0.56 nM), and also quite high affinity (Ki = < 10 nM) for α1A,,2A–2C, D4, H1,3, and σ1,2 receptors, and for the serotonin transporter, but was devoid of high affinity for any of a wide battery of other receptors, transporters and binding sites. This pharmacological profile is similar to that of loperamide itself.
PET scans of wild type mice administered with [11C]3 alone revealed only very low uptake of radioactivity into forebrain which quickly maximized and then washed out slowly (Figure 3). These data are consistent with effective exclusion of the radiotracer from brain by P-gp at the blood-brain barrier. The uptake of radioactivity at 30 min was about 3.5-fold higher in forebrains of P-gp knockout mice than those of wild type mice (Figure 3). Cerebellum gave similar results (data not shown). Hence, [11C]3 is a substrate for P-gp, in accord with the prediction from our earlier study.24
PET scans are unable to identify the chemical species being measured in brain. Moreover, they are subject to partial volume effects due to the limited spatial resolution of the PET camera. In these experiments the spatial resolution was ~ 1.6 mm full-width at half maximum; therefore, small regions of mouse brain that contained relatively high levels of radioactivity would not be measured accurately. They would be underestimated while any neighboring regions of low activity would be overestimated. In order to measure radioactivity concentration in brain and plasma more accurately, analytical measurements were made ex vivo at a single time point with a γ-counter. The time chosen for these measurements was 30 min after [11C]3 injection, since the PET scans had already shown little loss of activity from brain over the preceding time span (Figure 3). Radio-HPLC of brain tissue (Figure 4) or plasma was also used to separate and measure unchanged radiotracer and its radiometabolites.
Radio-HPLC of wild type or P-gp knockout plasma showed that a high proportion of radioactivity consisted of radiometabolites, all of which were less lipophilic than parent radiotracer. Measurements in wild type and knockout mice gave very similar values for total radioactivity concentration in plasma and for the distribution of this radioactivity between radiotracer and radiometabolites (Table 1).
Measurements on brain tissue confirmed the higher radioactivity content in the knockout mice. The ratio of radioactivity in knockout mice forebrain to that in wild type mice was seven compared to the value of about 3.5 seen between 27.5 and 35 min in the PET experiments. The PET ratio is therefore in appreciable error.
Blood constitutes 4–5% of brain volume. The PET scans are uncorrected for blood radioactivity while the ex vivo measures do not include significant blood radioactivity. In this case, blood radioactivity was not a major source of error in the PET measurements because the blood levels of radioactivity were only about five-fold higher than in brain (in wild type mice) or appreciably lower (in knockout mice) (Table 1).
The several-fold higher uptake of radioactivity in the forebrains of knockout mice compared to those of wild type is predominantly explained by the greatly increased uptake of unchanged [11C]3. In knockout mice forebrain, uptake of [11C]3 increased about sixteen-fold over that in wild type mice forebrain. As a result, about 90% of the radioactivity in knockout mouse brain was unchanged [11C]3 (Table 1). This result, obtained in a generally highly metabolic species, augers well for the potential to quantify brain P-gp function with [11C]3 and PET and in rodents and higher species, including humans. By contrast, we have previously shown that only ~ 50% of the radioactivity in P-gp knockout mouse brain after the administration of [11C]loperamide is unchanged radiotracer, so precluding prospects for its use to quantify P-gp function.24 Hence, on the basis of these mice data, [11C]3 is a vastly better radiotracer than [11C]loperamide.
Encouraged by these results, we pursued PET experiments in monkey in which DCPQ at doses equal to or greater than 8 mg/kg i.v. could be used to block brain P-gp.24 Structurally, DCPQ is very closely related to zosuquidar ((2R)-anti-5-{3-[4-(10,11-difluoromethanodibenzosuber-5-yl)piperazin-1-yl]-2-hydroxypropoxy}quinoline trihydrochloride; LY335979) (Figure 9), which shows selectivity for P-gp versus other efflux transporters, such as MRP1, MRP2, MRP3 or BCRP.31,32
Figure 9.

Structures of DCPQ and zosuquidar.
In a baseline PET experiment with [11C]3 in monkey, the uptake of radioactivity in all examined brain regions was very low (Figure 5A). By contrast uptake of radioactivity into the pituitary was high. In an experiment in the same monkey, in which DCPQ (8 mg/kg) was administered intravenously before [11C]3, radioactivity uptake into all brain regions increased dramatically, while the uptake into pituitary was similar to that in the baseline experiment (Figure 5B). PET images of the brain and pituitary under baseline and P-gp blocked conditions dramatically portrayed these patterns (Figure 6). These data are consistent with [11C]3 behaving as a substrate for P-gp at the blood-brain barrier, but not at the pituitary, which partially lies outside the blood-brain barrier.
Regional brain uptakes of radioactivity after intravenous administration of [11C]3, subsequent to various doses of DCPQ (0–16 mg/kg, i.v.) were measured in one monkey and increased almost linearly with dose of DCPQ (Figure 7). This strongly indicates that [11C]3 has sensitivity to the degree of blockade of brain P-gp.
The time-activity curves under baseline and P-gp blocked conditions were characterized by fast initial uptake of radioactivity and then strong retention of radioactivity (Figures 5). In addition, some regions like cerebellum consistently showed higher uptake than others (e.g., frontal cortex) at all doses of DCPQ (Figures 5B and 7). This variability may have been caused by regional differences in blood flow or in P-gp activity itself. These possibilities require future detailed elucidation.
In view of the high affinity shown by 3 for a variety of receptors and the serotonin transporter, it was considered that the strong retention of radioactivity in all brain regions might represent tight binding to one or more of these sites. 3 showed highest affinity for μ-opiate receptors. Naloxone is a high-affinity μ-, κ- and δ-opiate receptor antagonist and has been used successfully to displace PET radioligands, such as [11C]diprenorphine33,34 , [11C](R)-methyl 4-[(3,4-dichlorophenyl)acetyl]-3-[(1-pyrrolidinyl)methyl]-1-piperazinecarboxylate ([11C]GR103545) 35 and [11C]methylnaltrindole 36 , from opiate receptors in monkey and human brain in vivo. Therefore, we attempted to displace radioactivity in brain with an injection of naloxone at 30 min after the administration of [11C]3 to a P-gp-inhibited monkey. Naloxone had no discernible effect on the washout of radioactivity from any of the examined brain regions. We conclude that specific binding to opiate receptors was not responsible for the strong retention of radioactivity in brain. Likewise, naloxone had no effect on washout of radioactivity from pituitary, even though pituitary is know to contain high levels of opiate receptors. The uptake of radioactivity into pituitary was independent of P-gp inhibition or amount of inhibitor (DCPQ) administered, showing uptake is not influenced by P-gp.
We also considered that [11C]3 might have been binding to one of the other sites for which it has high affinity. The lack of displacement of radioactivity from monkey brain by loperamide or 3 showed that [11C]3 does not have saturable receptor binding in monkey brain. Most probably the sustained uptake of radioactivity in brain and pituitary represents non-specific binding to high-concentration non-saturable sites, or is perhaps due to some other mechanism. A possibility is entrapment by protonation since our computation of pKa and experimental determination of apparent pKa indicate that an appreciable proportion of 3 will be protonated at physiological pH.
After the intravenous administration of [11C]3, radioactivity concentration in monkey blood initially decreased rapidly, reaching a very low and stable radioactivity level at 20 min. This rate of decrease was unaffected by pre-administration of DCPQ. Likewise, parent radiotracer concentration in blood decreased fast initially, and then continued to decline slowly.
Three radiometabolites were found in monkey blood after administration of [11C]3. These were all less lipophilic than [11C]3 and had similar retention times to those seen in mouse plasma. Therefore, mouse and monkey likely produce the same radiometabolites. Based on metabolites of 3 identified in two previous studies25,26, we hypothesize that these radiometabolites include ring hydroxylated species. [11C]B is only slightly less lipophilic than [11C]3 and is possibly such a species. The pattern for the emergence of the radiometabolites in monkey plasma is shown in Figure 8 and was unaffected by DCPQ pre-treatment. The time taken for half the radioactivity in plasma to be represented by radiometabolites was about 45 min (significantly slower than for [11C]loperamide24).
Conclusion
[11C]3 was confirmed to be an avid substrate for brain P-gp in mouse and monkey. Although [11C]3 was quite rapidly metabolized to three less polar radiometabolites, radioactivity uptake into brain was greatly increased under conditions in which P-gp was absent or blocked. In P-gp knockout mouse the vast majority of radioactivity entering brain was unchanged [11C]3 and this was in high ratio to its concentration in plasma. These findings show that [11C]3 is a new radiotracer with favorable properties for quantifying brain P-gp function with PET.
Experimental
Materials and general methods
All reagents and organic solvents were ACS grade or higher and used without further purification. 4-(4-Chlorophenyl)-4-hydroxypiperidine, 4-bromo-2,2-diphenylbutyronitrile and N,N-di-isopropylethylamine (DIPEA) were purchased from Aldrich (Milwaukee, WI). DCPQ ((2R)-anti-5-{3-[4-(10,11-dichloromethanodibenzo-suber-5-yl)piperazin-1-yl]-2-hydroxypropoxy}quinoline trihydrochloride37 was a gift from Eli Lilly (Indianapolis, IN).
Reactions were performed under argon atmosphere with standard Schlenk techniques. Yields are recorded for chromatographically and spectroscopically (1H and 13C NMR) pure materials.
1H (400 MHz) and 13C NMR (100 MHz) spectra of all compounds were recorded on an Avance 400 spectrometer (Bruker; Billerica, MA). Chemical shifts are reported in δ units (ppm) downfield relative to the chemical shift for tetramethylsilane. Abbreviations br, s, d, t and m denote broad, singlet, doublet, triplet and multiplet, respectively.
Mass spectra were obtained on a Polaris-Q GC-MS instrument (Thermo Fisher Scientific Corp., Waltham, MA). LC-MS was performed on a LCQ Deca instrument (Thermo Fisher Scientific Corp.) equipped with a reverse-phase HPLC column (Synergi Fusion-RP, 4 μm, 150 × 2 mm; Phenomenex, Torrance, CA). The instrument was set up to perform electrospray ionization (spray voltage 5 kV, nitrogen sheath flow 65 units, auxiliary gas flow 10 units, capillary voltage 35 V and capillary temperature 260 °C). For the characterization of synthesized compounds, the column was eluted at 150 μL/min, either isocratically or with a gradient between H2O: MeOH: AcOH (90: 10: 0.5 by vol.) and MeOH: AcOH (100: 0.5 v/v). High resolution mass spectra (HRMS) were acquired at the Mass Spectrometry Laboratory, University of Illinois at Urbana Champaign (Urbana, IL) under electron ionization conditions with a double-focusing high resolution instrument (Autospec; Micromass Inc.). Samples were introduced through a direct insertion probe.
Thin layer chromatography (TLC) was performed on silica gel layers (type 60 F254; EMD Chemicals, Gibbstown, NJ), and compounds were visualized under UV light and by staining with Dragendorff’s reagent.
Melting points were measured with a Mel-Temp manual melting point apparatus (Electrothermal; Fisher Scientific, USA), and were uncorrected.
[11C]3 and its radiometabolites in samples of biological material were analyzed on a Nova-Pak® C18 column (4 μm, 100 × 8 mm; Waters Corp., Milford, MA) housed within a radial compression module (RCM 100). The column was eluted with MeOH: H2O: Et3N (70: 30: 0.1 by vol.) at 2.0 mL/min, with eluate monitored with a flow through Na(Tl) scintillation detector (Bioscan, Washington, DC). Methanol (2 mL) was injected onto the column to show no residual radioactivity after each analysis run. Chromatographic data were corrected for physical decay to the time of HPLC injection, stored and analyzed by “Bio-Chrom Lite” software (Bioscan). The same HPLC method was applied for the determination of radiochemical purity, lipophilicity and radiochemical stability of [11C]3 in various media.
High activities of carbon-11 (> 40 kBq, < 40 MBq) were measured with a calibrated ionization chamber (Atomlab 300; Biodex Medical Systems, Shirley, NY). Low activities of carbon-11 (< 40 kBq) were measured in an automatic γ-counter (Model 1480 Wizard; Perkin-Elmer; Boston, MA) with an electronic window set between 360–1800 keV (counting efficiency, 51.84%). Measurements of carbon-11 were corrected for any significant background and for physical decay with a half-life of 20.385 min.38
P-gp knockout mice (mdr-1a(−/−)) 39 (model; 001487-MM, double homozygotes) and wild type mice (mdr-1a(+/+)) (Model; FVB) were purchased from Taconic Farm (Germantown, NY). Healthy rhesus monkeys (Macaca mulatta) were used in this study. All animal experiments were performed in accordance with the Guide for Care and Use of Laboratory Animals40 and were approved by the National Institute of Mental Health Animal Care and Use Committee.
Group data are expressed as mean ± S.D.
4-(4-(4-Chlorophenyl)-4-hydroxypiperidin-1-yl)-2,2-diphenylbutanenitrile (1)
4-(4-Chlorophenyl)-4-hydroxypiperidine (2.12 g, 10.0 mmol) was suspended in acetonitrile (15 mL) and DIPEA (3.5 mL, 30 mmol) was added. 4-Bromo-2,2-diphenylbutyronitrile (3.00 g, 10.0 mmol) in acetonitrile (15 mL) was then added. The reaction mixture was stirred under argon at 70 °C for 31 h. After concentration under vacuum, the crude material was re-dissolved in dichloromethane and introduced onto a silica gel column. The product was eluted with ammonium hydroxide solution (2 M) in MeOH: CH2Cl2 (6: 94 v/v) to yield 1 as a pale orange solid (3.10 g, 7.21 mmol, 69% yield). M. p. 108–109 °C (n = 3). TLC (silica gel; CH2Cl2: 2 M NH4OH in MeOH (95: 5 v/v); Rf = 0.60. 1H NMR (CDCl3): δ7.36 (m, 14H), 2.76 (d, J = 11.20 Hz, 2H), 2.65 (m, 4H), 2.48 (t, J = 6.9 Hz, 2H), 2.08 (t, J = 12.5 Hz, 2H), 1.68 (d, J = 11.58 Hz, 2H), 1.60 (br s, 1H). 13C NMR (CDCl3): δ 140.16, 132.95, 129.09, 128.57, 128.10, 126.95, 126.23, 122.27, 71.11, 54.93, 50.17, 49.71, 38.52, 36.80. LC-MS (M++ 1) = 431.2. HRMS (M++ 1): found 431.1895; calc’d for C27H27ClN2O, 431.1890. LC: 99.89%.
4-(4-(4-Chlorophenyl)-4-hydroxypiperidin-1-yl)-2,2-diphenylbutanamide (2)
Compound 1 (2.50 g, 6.00 mmol) was dissolved in tbutanol (20 mL) and potassium hydroxide (1.18 g, 21.0 mmol) was added. The reaction mixture was stirred at 100 °C for 3 d. After concentration under vacuum, the crude material was re-dissolved in dichloromethane and filtered through a pad of celite. Chromatography of the sample on a silica gel column eluted with ammonium hydroxide (2 M) solution in MeOH: CH2Cl2 (5: 95 v/v) gave 2 as a pale yellow solid (1.09 g, 2.4 mmol, 37% yield). M. p. = 208–210 °C (n = 3). TLC (silica gel; CH2Cl2: 2 M NH4OH in MeOH (95: 5 v/v); Rf = 0.45. 1H NMR (CDCl3): δ7.35 (d, J = 4.80 Hz, 2 H), 7.26 (m, 12H), 6.49 (s, 1H), 5.51 (s, 1H), 2.77 (d, J = 11.37 Hz, 2H), 2.61 (t, J = 7.67 Hz, 2H), 2.33 (m, 4H), 2.03 (t, J = 12.64 Hz, 2H), 1.70 (br s, 1H), 1.64 (d, J = 11.91 Hz, 2H). 13C NMR (CDCl3): δ 176.56, 143.26 132.82, 128.69, 128.41, 127.06, 126.10, 70.90, 59.91, 54.92, 49.48, 38.28, 35.87. LC-MS (M+ + 1) 449.2. HRMS (M+ + 1) found 449.2012; calc’d for C27H30ClN2O2 449.1996. LC: 99.90%.
4-(4-(4-Chlorophenyl)-4-hydroxypiperidin-1-yl)-2,2-diphenyl-N-methyl-butanamide (3)
Compound 2 (0.5 g, 1.12 mmol) was dissolved in DMSO (3 mL) at 24 °C and then potassium hydroxide (81.2 mg, 1.45 mmol) and iodomethane (158 mg, 1.1 mmol) were added. The reaction was stirred at 80 °C for 24 h. The crude material was injected onto a Luna C18 column (10 μm, 10 × 250 mm; Phenomenex, Torrance, CA) eluted at 8 mL/min with aq. CF3CO2H (0.1%): MeCN (72: 28 v/v). The collected fractions were then concentrated under vacuum and re-purified on a silica gel rotor (Chromatotron, Model 7924T, Harrison Research, CA) eluted with ammonium hydroxide solution (2 M) in MeOH: CH2Cl2 (5: 95 v/v) to yield 3 as a pale yellow solid (16.5 mg, 0.036 mmol, 3.2% yield). M. p. = 224–226 °C (n = 3). TLC (silica gel; CH2Cl2: 2M NH4OH in MeOH (95: 5 v/v); Rf = 0.45. 1H NMR (CDCl3): δ7.43 (d, J = 9.2 Hz, 2 H), 7.30 (m, 12H), 6.62 (s, 1H), 2.80 (d, J = 4.8 Hz, 3H), 2.66 (t, J = 7.2 Hz, 2H), 2.39 (m, 4H), 2.08 (t, J = 11.1 Hz, 2H), 1.72 (d, J = 11.6 Hz, 2H), 1.60 (d, J = 21.2 Hz, 2H). 13C NMR (CDCl3): δ 174.79, 143.76, 132.79, 128.77, 128.42, 128.34, 126.91, 126.09, 70.96, 60.10, 58.47, 55.08, 49.50, 26.68. LC-MS, (M+ + 1) 463.2. HRMS, found (M+ + 1) 463.2144, calc’d for C28H32ClN2O2, 463.2152. LC: 99.90%.
Pharmacological Screen of 3
3 was submitted to the National Institute of Mental Health Psychoactive Drug Screening Program (NIMH-PDSP) for assessment of binding affinity against a wide range of receptors and transporters (5-HT1A,1B,1D,1E,2A–C,3,5A,6,7, α1A,2A–2C, β1,2, μ-, κ-, δ-opiate, D1,2,4,5, H1–3, M1–5, and σ1,2 receptors, and noradrenaline, serotonin and dopamine transporters). Detailed assay protocols are available at the NIMH-PDSP web site (http://pdsp.cwru.edu).
Production of [11C]Iodomethane
No-carrier-added [11C]carbon dioxide (~ 38 GBq) was produced in a target of nitrogen gas (~ 164 psi) containing oxygen (1%) via the 14N(p,α)11C reaction induced for 20 min with a 16 MeV proton beam (45 μA) from a PETrace cyclotron (GE; Milwaukee, WI). [11C]Iodomethane was produced within a lead-shielded hot-cell from the [11C]carbon dioxide via reduction to [11C]methane and iodination41 within a MeI MicroLab apparatus (GE).
Preparation of [11C]3
Radiochemistry was performed in a PLC-controlled semi-robotic Synthia apparatus42 (Synthia, Uppsala, Sweden), housed within the same lead-shielded hot-cell used to prepare [11C]iodomethane. [11C]Iodomethane in carrier helium (15 mL/min) was bubbled into a sealed 1 mL-vial containing 2 (1.0 mg, 2.23 μmol) and KOH (5.0 mg, 89.3 μmol) in DMSO (0.4 mL). When the radioactivity in the vial had maximized, the reaction mixture was heated at 80 °C for 5 min and then diluted with water (500 μL). The crude material was injected onto a Gemini C18 column (5 μm, 10 × 250 mm; Phenomenex) eluted at 6 mL/min with ammonium hydroxide solution (2 M) in MeOH: CH2Cl2 (62: 38 v/v). Eluate was monitored for radioactivity (pin diode detector HC-003; Bioscan) and absorbance at 225 nm (Gold 166 detector; Beckman). [11C]3 (tR = 10.2 min) eluted after 2 (tR = 8.71 min) and was collected in a 10-mL round-bottom vial containing an aqueous solution (0.1 mL) of ascorbic acid (1 mg; USP grade). This was then rotary evaporated to dryness, diluted with sterile Saline for Injection (10 mL; USP grade), and filtered through a sterile filter (Millex MP, Millipore, Bedford, MA). The pH of the dose was 4.5.
[11C]3 was analyzed for radiochemical purity on a Luna C18 column (5 μm, 4.6 × 250 mm; Phenomenex) eluted with aq. CF3CO2H (0.1%): MeCN (40: 60 v/v) at 2.5 mL/min (tR = 5.55 min), with eluate monitored for absorbance at 225 nm (Gold 166 detector, Beckman) and radioactivity (pin diode detector HC-003; Bioscan). The identity of [11C]3 was confirmed by i) LC-MS-MS of associated carrier, and ii) observation of co-elution with added authentic 3 in a second radio-HPLC analysis.
Computation of cLogP, cLogD and pKa and Measurement of LogD and apparent pKa
cLogP, cLogD (at pH = 7.4) and pKa values for 3 were computed with the program Pallas 3.0 for Windows (CompuDrug; S. San Francisco; CA).
The LogD value of [11C]3 was determined by measuring its distribution between n-octanol and sodium phosphate buffer (0.15 M, pH 7.4), as previously described for other radiotracers,43,44 and the apparent pKa determined by the method described previously, except that extraction was performed using cyclohexane instead of 1-octanol.43
PET Imaging of [11C]3 in Mouse Brain
Brains of three wild type and three P-gp knockout mice were scanned with the Advanced Technology Laboratory Animal Scanner (ATLAS). This small-animal PET camera has effective transaxial and axial fields of view of 6.0 and 2.0 cm, respectively.45 Mice were anaesthetized with 1.5% isoflurane in oxygen, and body temperatures maintained between 36.5 and 37.0 °C with a heating pad or lamp. Radiotracer was injected via a polyethylene cannula (PE-10; Becton Dickinson, Franklin Lakes, NJ) secured in the mouse tail vein with tissue adhesive (Vetbond; 3M, St. Paul, MN).
On two occasions, three mice (at least one P-gp knockout mouse (19–23.8 g) and one wild type mouse (28.6–29.5 g)) were placed in the camera gantry and each injected with a bolus of [11C]3 (21.1–27.9 MBq; SA 40.7–131 GBq/μmol). The injected radioactivities gave count rates within the linear range of scanner performance i.e., < 300,000 singles per s. Scans were obtained from the time of injection for 100 min in the frame sequence 6 × 20 s, 5 × 1 min, 4 × 2 min, 3 × 5 min, 3 × 10 min and 2 × 20 min. Data were corrected for random events and detector efficiency. Images were reconstructed with a 3D ordered-subset expectation maximization algorithm into 17 coronal slices with 3 iterations and 16 subsets, resulting in a resolution of about 1.6 mm full-width at half maximum.46,47 The reconstructed voxel size was 0.56 × 0.56 × 1.12 mm. No attenuation or scatter correction was applied.
Images were analyzed with PMOD (pixel-wise modeling software, PMOD Group; Zurich, Switzerland). A region of interest was drawn for forebrain on coronal slices guided by a mouse brain stereotaxic atlas.48 Brain uptake of radioactivity was corrected for decay and normalized for injected dose and body weight by expression as percent standardized uptake value (%SUV), defined as:
Measurement of [11C]3 and Radiometabolites in Mouse Plasma and Brain
Thirty minutes after injection of [11C]3 into each of three wild type and three knockout mice, anti-coagulated blood (1 mL) was sampled by cardiac puncture. Plasma (~ 100–450 μL) was separated by centrifugation, deproteinized with acetonitrile (700 μL) and measured for radioactivity in an automatic γ-counter.49 The animals were decapitated, and forebrains and cerebella removed for immediate radioanalysis. 49 Brain-tissue radioactivities were measured in the γ-counter. Brain tissue suspension, along with carrier 3, was homogenized in 1.5 times its volume of acetonitrile with a hand-held tissue Tearor (model 985-370; BioSpec Products Inc.). Water (500 μL) was added and the mixture homogenized again. Homogenates were then centrifuged at 10,000 g for 1 min. The resulting precipitates and supernatant liquids were measured for radioactivity to allow the recovery of activity into the acetonitrile supernatants to be calculated. Aliquots of the clear pre-filtered supernatant liquids were analyzed by radio-HPLC (see general methods).
PET Imaging of Monkey Brain with [11C]3
One male rhesus monkey (A; 8.4 kg) was fasted overnight, immobilized with ketamine (10 mg/kg, i.m.), intubated, placed on a ventilator, and anesthetized with 1.6% isoflurane in O2. Body temperature was maintained between 36.5 and 37.0 °C. After injecting [11C]3 (211 MBq in 10 mL) through an intravenous perfusion line, filled with saline, dynamic PET scans of the brain were acquired on an HRRT camera (Siemens, Knoxville, TN) for 120 min in 33 frames of duration increasing from 30 s to 5 min. Images were reconstructed using a list mode 3D-OSEM algorithm,50 resulting in a resolution of 2.5 mm full-width at half maximum. Scatter and attenuation correction were applied. Images were analyzed with PMOD. Regions of interest were drawn on coronal slices for eight brain regions (frontal cortex, anterior cingulate, temporal cortex, parietal cortex, hippocampus, occipital cortex, putamen and cerebellum). Activity was decay-corrected to the time of injection and expressed as %SUV.
Three hours after the baseline scan, P-gp was blocked with DPCQ (8 mg/kg. i.v.) in the same monkey and the PET scanning repeated. For this purpose DPCQ (67.3 mg, 0.120 mmol) was dissolved with the aid of sonication in sterile aqueous mannitol (5% w/v; 10 mL), diluted with sterile saline (10 mL) and finally passed through a sterile filter (Anatop 25; 0.2 μm, 25 mm; Whatman). This DCPQ solution (3.36 mg/mL; 19.76 mL) was infused into the monkey over 10 min. After 20 min the monkey was injected with [11C]3 (218 MBq).
Experiments were similarly performed in a single monkey (monkey B; 15.5 kg) to asses the effect of DCPQ at doses of 0, 4, 8 and 16 mg/kg (i.v). on regional brain radioactivity uptake after the administration of [11C]3. Time-radioactivity data were collected for the same eight brain regions as previously described. Injected activities in this series of experiments were 377, 340, 281 and 355 MBq, at specific activities of 160, 94.5, 131 and 183 GBq/μmol, respectively.
The baseline and P-gp blocked experiments were repeated in a third monkey (C; 12.45 kg) with naloxone (5 mg/kg, i.v.) administered at 30 min after the second injection of [11C]3, and in another monkey (D; 15.72 kg) in which the dose of DCPQ was increase to 16 mg/kg (i.v.) and naloxone was given as before. Injected activities in this sequence of experiments were 313, 283, 377 and 355 kBq, respectively.
A PET experiment was performed in monkey E (11.1 kg) in which P-gp was blocked with DCPQ (8 mg/kg, i.v.) as before and in which loperamide (1 mg/kg, i.v) was also given at 30 min after [11C]3 (315 MBq). Finally, This experiment was repeated in monkey F (9.5 kg), except that 3 (1 mg/kg, i.v.) was given instead of loperamide before administration of [11C]3 (370 MBq). This scan was terminated at 45 min.
Emergence of Radiometabolites of [11C]3 in Monkey Plasma
After the administration of [11C]3 to monkey (A) under baseline and P-gp blocked condition (achieved with DCPQ at 8 mg/kg, i.v.), eight arterial blood samples (0.5 mL each) were drawn into heparin-treated syringes at 15 s intervals until 2 min, followed by 1 mL aliquots at 3, 5, 10, 20, 30, 45, 60, 75, 90 and (in DCPQ-treated monkey only) 120 min. Samples were measured for radioactivity. Plasma [11C]3 was separated, measured for radioactivity, deproteinized and the [11C]3 and radiometabolite contents quantified with radio-HPLC (general method A).
Supplementary Material
HPLC chromatograms verifying the purities of compounds 1–3 and PET time–activity data for brain regions in P-gp inhibited monkey given naloxone after radiotracer [11C]3. This material is available free of charge via the Internet at http://pubs.acs.org.
Acknowledgments
This research was supported by Intramural Research program of the National Institute of Mental Health (project #Z01-MH-002795-04). We are grateful to the NIH Clinical Research Center PET Group for radionuclide production and for assistance on PET Imaging, to PMOD Technologies for providing the image analysis software and the NIMH Psychoactive Drug Screening Program (PDSP) for performing assays; the PDSP is directed by Bryan L. Roth, MD, PhD (University of North Carolina at Chapel Hill) with project officer Jamie Driscol (NIMH) (contract #NO1MH32004). We are also grateful to GlaxoSmithKline for a gift of reference 3 and to Eli Lilly for DCPQ.
Abbreviations
- DCPQ
((2R)-anti-5-{3-[4-(10,11-dichloromethanodibenzosuber-5-yl)piperazin-1-yl]-2-hydroxypropoxy}quinoline trihydrochloride
- DIPEA
N,N-di-isopropylethylamine
- dLop
N-desmethyl-loperamide
- PET
positron emission tomography
- P-gp
P-glycoprotein
- RCY
decay-corrected radiochemical yield
- SA
specific radioactivity
- SPECT
single photon emission computed tomography
References
- 1.Tsuji A, Tamai I. Blood-brain barrier function of P-glycoprotein. Adv Drug Delivery Rev. 1997;25:287–298. [Google Scholar]
- 2.Cordon-Cardo C, O’Brien JP, Boccia J, Casals D, Bertino JR, Melamed MR. Expression of the multidrug resistance gene product (P-glycoprotein) in human normal and tumor tissues. J Histochem Cytochem. 1990;9:1277–1287. doi: 10.1177/38.9.1974900. [DOI] [PubMed] [Google Scholar]
- 3.Schinkel A, Wagenaar E, Mol C, van Deemter L. P-glycoprotein in the blood-brain barrier of mice influences the brain penetration and pharmacological activity of many drugs. J Clin Invest. 1996;97:2517–2524. doi: 10.1172/JCI118699. [DOI] [PMC free article] [PubMed] [Google Scholar]
- 4.Kim RB, Fromm MF, Wandel C, Leake B, Wood AJJ, Roden DM, Wilkinson GR. The drug transporter P-glycoprotein limits oral absorption and brain entry of HIV-1 protease inhibitors. J Clin Invest. 1998;101:289–294. doi: 10.1172/JCI1269. [DOI] [PMC free article] [PubMed] [Google Scholar]
- 5.Gottesman M, Fojo T, Bates S. Multidrug resistance in cancer: role of ATP-dependent transporters. Nat Rev Cancer. 2002;2:48–58. doi: 10.1038/nrc706. [DOI] [PubMed] [Google Scholar]
- 6.Lam FC, Liu R, Lu P, Shapiro AB, Renoir M, Sharom FJ, Reiner PB. β-Amyloid efflux mediated by P-glycoprotein. J Neurochem. 2001;76:1121–1128. doi: 10.1046/j.1471-4159.2001.00113.x. [DOI] [PubMed] [Google Scholar]
- 7.Cirrito JR, Deane R, Fagan AM, Spinner ML, Parsadanian M, Finn MB, Jiang H, Prior JL, Sagare A, Bales KR, Paul SM, Zlokovic BV, Piwnica-Worms D, Holtzman DM. P-Glycoprotein deficiency at the blood-brain barrier increases amyloid-β deposition in an Alzheimer disease mouse model. J Clin Invest. 2005;115:3285–3290. doi: 10.1172/JCI25247. [DOI] [PMC free article] [PubMed] [Google Scholar]
- 8.Vogelgesang S, Cascorbi I, Schroeder E, Pahnke J, Kroemer HK, Siegmund W, Kunert-Keil C, Walker LC, Warzok RW. Deposition of Alzheimer’s β-amyloid is inversely correlated with P-glycoprotein expression in the brains of elderly non-demented humans. Pharmacogenetics. 2002;12:535–541. doi: 10.1097/00008571-200210000-00005. [DOI] [PubMed] [Google Scholar]
- 9.Langford D, Grigorian A, Hurford R, Adame A, Ellis RJ, Hansen L, Masliah E. Altered P-glyocoprotein expression in AIDS patients with HIV encephalitis. J Neuropath Exp Neurology. 2004;63:1038–1046. doi: 10.1093/jnen/63.10.1038. [DOI] [PubMed] [Google Scholar]
- 10.Kortekaas R, Leenders KL, van Oostrom JCH, Vaalburg W, Bart J, Willemsen ATM, Hendrikse NH. Blood-brain barrier dysfunction in Parkinsonian midbrain in vivo. Ann Neurol. 2005;57:176–179. doi: 10.1002/ana.20369. [DOI] [PubMed] [Google Scholar]
- 11.Liow JS, Lu S, McCarron JA, Hong J, Musachio JL, Pike VW, Innis RB, Zoghbi SS. Effect of a P-glycoprotein inhibitor, cyclosporin A, on the disposition in rodent brain and blood of the 5-HT1A receptor radioligand, [11C](R)-(−)-RWAY. Synapse. 2007;96:96–105. doi: 10.1002/syn.20348. [DOI] [PubMed] [Google Scholar]
- 12.Elsinga PH, Hendrikse NH, Bart J, van Waarde A, Vaalburg W. Positron emission tomography studies of central nervous system drugs and P-glycoprotein function in the rodent brain. Mol Imaging Biol. 2005;7:37–44. doi: 10.1007/s11307-005-0951-x. [DOI] [PubMed] [Google Scholar]
- 13.Elsinga PH, Hendrikse NH, Bart J, Vaalburg W, van Waarde A. PET studies on P-glycoprotein function in the blood-brain barrier: how it affects uptake and binding of drugs within the CNS. Curr Pharm Design. 2004;10:1493–1503. doi: 10.2174/1381612043384736. [DOI] [PubMed] [Google Scholar]
- 14.Levchenko A, Mehta B, Lee J, Humm JL, Augensen F, Squire O, Kothari PJ, Finn RD, Leonard EF, Larson SM. Evaluation of 11C-colchicine for PET imaging of multiple drug resistance. J Nucl Med. 2000;41:493–501. [PubMed] [Google Scholar]
- 15.Elsinga PH, Franssen EJF, Hendrikse NH, Fluks L, Weemaes AMA, van der Graaf WTA, deVries GE, Visser GM, Vaalburg W. Carbon-11-labeled daunorubicin and verapamil for probing P-glycoprotein in tumors with PET. J Nucl Med. 1996;37:1571–1575. [PubMed] [Google Scholar]
- 16.Takano A, Kusuhara H, Suhara T, Ieiri I, Morimoto T, Lee YJ, Maeda J, Ikoma Y, Ito H, Suzuki K, Sugiyama Y. Evaluation of in vivo P-glycoprotein function at the blood–brain barrier among MDR1 gene polymorphisms by using 11C-verapamil. J Nucl Med. 2006;47:1427–1433. [PubMed] [Google Scholar]
- 17.Kurdziel K, Kiesewetter D, Carson R, Eckelman W, Herscovitch P. Biodistribution, radiation dose estimates, and in vivo Pgp modulation studies of 18F-paclitaxel in nonhuman primates. J Nucl Med. 2003;44:1330–1339. [PubMed] [Google Scholar]
- 18.Bigott H, Prior J, Piwnica-Worms D, Welch M. Imaging multidrug resistance P-glycoprotein transport function using microPET with technetium-94m-sestamibi. Mol Imaging. 2005;4:30–39. doi: 10.1162/15353500200504166. [DOI] [PubMed] [Google Scholar]
- 19.Passchier J, Bender D, Matthews JC, Lawrie KW, Gee AD. [11C]Loperamide: a novel and sensitive PET probe for quantification of changes in P-glycoprotein functionality. Mol Imaging Biol. 2003;5:121. abstract. [Google Scholar]
- 20.Wilson AA, Passchier J, Garcia A, Vasdev N, Stableford W, Lawrie K, Fellows I, Gee AD. Production of the P-glycoprotein marker [11C]loperamide, in clinically useful quantities. J Labelled Compd Radiopharm. 2005;48:S142. abstract. [Google Scholar]
- 21.DelVecchio S, Ciarmiello A, Potena M, Carriero MV, Mainolfi C, Botti G, Thomas R, Cerra M, Daiuto G, Tsuruo T, Salvatore M. In vivo detection of multidrug-resistant (MDR1) phenotype by technetium-99m sestamibi scan in untreated breast cancer patients. Eur J Nucl Med. 1997;24:150–159. doi: 10.1007/BF02439547. [DOI] [PubMed] [Google Scholar]
- 22.Awouters F, Megens A, Verlinden M, Schuurkes J, Niemegeers C, Janssen PAJ. Loperamide – survey of studies on mechanism of its antidiarrheal activity. Digestive Diseases and Sciences. 1993;38:977–995. doi: 10.1007/BF01295711. [DOI] [PubMed] [Google Scholar]
- 23.Sadeque AJM, Wendel C, He HB, Shah S, Wood AJJ. Increased drug delivery to the brain by P-glycoprotein inhibition. Clin Pharmacol Therapeutics. 2000;68:231–237. doi: 10.1067/mcp.2000.109156. [DOI] [PubMed] [Google Scholar]
- 24.Zoghbi SS, Liow J-S, Yasuno F, Hong J, Tuan E, Lazarova N, Gladding RL, Pike VW, Innis RB. 11C-Loperamide and its N-desmethyl radiometabolite are avid substrates for brain P-glycoprotein efflux. J Nucl Med. 2008;49:649–656. doi: 10.2967/jnumed.107.047308. [DOI] [PubMed] [Google Scholar]
- 25.Kalgutkar AS, Nguyen HT. Identification of N-methyl-4-phenylpyridinium-like metabolite of the antidiarrheal agent loperamide in human liver microsomes: underlying reason(s) for the lack of neurotoxicity despite the bioactivation event. Drug Metab Dispos. 2004;32:943–952. [PubMed] [Google Scholar]
- 26.Yoshida K, Nambu K, Arakawa S, Miyazaki H, Hashimoto M. Metabolism of loperamide in rats. Biomed Mass Spectrom. 1979;6:253–259. doi: 10.1002/bms.1200060606. [DOI] [PubMed] [Google Scholar]
- 27.Stokbroekx RA, Vandenberk J, Van Heertum AHMT, Van Laar GMLW, Van der Aa MJMC, Van Bever WFM, Janssen PAJ. Synthetic antidiarrheal agents. 2,2-Diphenyl-4-(4’-aryl-4’-hydroxypiperidino)butyramides. J Med Chem. 1973;16:782–786. doi: 10.1021/jm00265a009. [DOI] [PubMed] [Google Scholar]
- 28.Pike VW. Positron-emitting radioligands for studies in vivo – probes for human psychopharmacology. J Psychopharmacol. 1993;7:139–158. doi: 10.1177/026988119300700202. [DOI] [PubMed] [Google Scholar]
- 29.Waterhouse RN. Determination of lipophilicity and its use as a predictor of blood-brain barrier penetration of molecular imaging agents. Mol Imaging Biol. 2003;5:376–389. doi: 10.1016/j.mibio.2003.09.014. [DOI] [PubMed] [Google Scholar]
- 30.Stahl KD, Van Bever W, Janssen P, Simon EJ. Receptor affinity and pharmacological potency of a series of narcotic analgesic, anti-diarreal and neuroleptic drugs. Eur J Pharmacol. 1977;46:199–205. doi: 10.1016/0014-2999(77)90334-x. [DOI] [PubMed] [Google Scholar]
- 31.Shepard RL, Cao J, Starling JJ, Dantzig AH. Modulation of P-glycoprotein but not MRP1- or BCRP-mediated drug resistance by LY335979. Int J Cancer. 2003;103:121–125. doi: 10.1002/ijc.10792. [DOI] [PubMed] [Google Scholar]
- 32.Dantzig AH, Shepard RL, Law KL, Tabas L, Pratt S, Gillespie JS, Binkley SN, Kuhfeld MT, Starling JJ, Wrighton SA. Selectivity of the multi-drug resistance modulator, LY335979, for P-glycoprotein and effect on cytochrome P450 activities. JPET. 1999;290:854–890. [PubMed] [Google Scholar]
- 33.Jones AKP, Luthra SK, Maziere B, Pike VW, Loc’h C, Crouzel C, Syrota A, Jones T. Regional cerebral opioid receptor studies with [11C]diprenorphine in normal volunteers. J Neurosci Methods. 1988;23:121–129. doi: 10.1016/0165-0270(88)90184-7. [DOI] [PubMed] [Google Scholar]
- 34.Shiue CY, Bai LQ, Teng RR, Arnett CD, Dewey SL, Wolf AP, McPherson DW, Fowler JS, Logan J, Holland MJ, Simon EJ. A comparison of the brain uptake of N-(cyclopropyl[11C]methyl norbuprenorphine ([11C]buprenorphine) and N-(cyclopropyl[11C]methyl nordiprenorphimne ([11C]diprenorphine) in baboon using PET. Nucl Med Biol. 1991;18:281–288. doi: 10.1016/0883-2897(91)90123-3. [DOI] [PubMed] [Google Scholar]
- 35.Talbot PS, Narendran R, Butelman ER, Huan YY, Ngo K, Slifstein M, Martinez D, Laruelle M, Hwang DR. [11C] GR103545, a radiotracer for imaging kappa-opioid receptors in vivo with PET: synthesis and evaluation in baboons. J Nucl Med. 2005;46:484–494. [PubMed] [Google Scholar]
- 36.Madar I, Bencherif B, Lever J, Heitmiller RF, Yang SC, Brock M, Brahmer J, Ravert H, Dannals R, Frost JJ. Imaging δ- and μ-opioid receptors by PET in lung carcinoma patients. J Nucl Med. 2007;48:207–213. [PubMed] [Google Scholar]
- 37.Pfister JR, Makra F, Muehldorf AV, Wu H, Nelson JT, Cheung P, Bruno NA, Casey SM, Zutshi N, Slate DL. Methanodibenzsuberylpiperazines as potent multidrug resistance reversal agents. Bioorg Med Chem Lett. 1995;5:2473–2476. [Google Scholar]
- 38.Weber DA, Eckerman KF, Dillman LT, Ruyman JC. MIRD: Radionuclide Data and Decay Schemes. New York: Society of Nuclear Medicine; 1989. p. 447. [Google Scholar]
- 39.Schinkel AH, Smit JJM, Vantellingen O, Belinen JH, Wagenaar E, Vandeeemter L, Mol CAAM, Vandervalk MA, Robanusmaandag EC, Teriele HPJ, Berns AJM, Borst P. Disruption of the mouse mdr1a P-glycoprotein gene leads to a deficiency in the blood-brain barrier and to increased sensitivity to drugs. Cell. 1994;77:491–502. doi: 10.1016/0092-8674(94)90212-7. [DOI] [PubMed] [Google Scholar]
- 40.Clark JD, Baldwin RL, Bayne KA, Brown MJ, Gebhart GF, Gonder JC, Gwathmey JK, Keeling ME, Kohn DF, Robb JW, Smith OA, Steggerda J-AD, VandeBer JL. Guide for the Care and Use of Laboratory Animals. Washington D.C: National Academy Press; 1996. [Google Scholar]
- 41.Larsen P, Ulin J, Dahlstrøm K, Jensen M. Synthesis of [11C]iodomethane by iodination of [11C]methane. Appl Radiat Isot. 1997;48:153–157. [Google Scholar]
- 42.See http://www.uppsla.imanet.se/research-synthia.asp for a description of similar apparatus.
- 43.Zoghbi SS, Baldwin RM, Seibyl JP, Charney DS, Innis RB. A radiotracer technique for determining apparent pKa of receptor-binding ligands. J Labelled Compd Radiopharm. 1997;40SI:136–138. [Google Scholar]
- 44.Briard E, Zoghbi SS, Imaizumi M, Gourley JP, Shetty HU, Hong J, Cropley V, Fujita M, Innis RB, Pike VW. Synthesis and evaluation in monkey of two sensitive 11C-labeled aryloxyanilide ligands for imaging brain peripheral benzodiazepine receptors in vivo. J Med Chem. 2008;51:17–30. doi: 10.1021/jm0707370. [DOI] [PubMed] [Google Scholar]
- 45.Seidel J, Vaquero JJ, Green MV. Resolution uniformity and sensitivity of the NIH ATLAS small animal PET scanner: comparison to simulated LSO scanners without depth-of-interaction capability. IEEE Trans Nucl Sci. 2003;50:1347–1350. [Google Scholar]
- 46.Johnson CA, Seidel J, Vaquero JJ, Pascau J, Desco M, Green MV. Exact positioning for OSEM reconstructions on the ATLAS depth-of interaction small animal scanner. Mol Imaging Biol. 2002;4:S22. abstract. [Google Scholar]
- 47.Liow J, Seidel J, Johnson CA, Toyama H, Green MV, Innis RB. A single slice rebinning/2D exact positioning OSEM reconstruction for the NIH ATLAS small animal PET scanner. J Nucl Med. 44:2003. 162P. abstract. [Google Scholar]
- 48.Paxinos G, Watson C. The Rat Brain in Stereotaxic Coordinates. 6. Amsterdam, Boston: Elsevier; 2001. [Google Scholar]
- 49.Zoghbi SS, Shetty UH, Ichise M, Fujita M, Imaizumi M, Liow J-S, Shah J, Musachio JL, Pike VW, Innis RB. PET imaging of the dopamine transporter with [18F]FECNT: a polar radiometabolite confounds brain radioligand measurements. J Nucl Med. 2006;47:520–527. [PubMed] [Google Scholar]
- 50.Carson RE, Barker WC, Liow J-S, Johnson CA. Conference Record of the IEEE Nuclear Science Symposium and Medical Imaging Conference; Portland, Oregon. 2003. [Google Scholar]
Associated Data
This section collects any data citations, data availability statements, or supplementary materials included in this article.
Supplementary Materials
HPLC chromatograms verifying the purities of compounds 1–3 and PET time–activity data for brain regions in P-gp inhibited monkey given naloxone after radiotracer [11C]3. This material is available free of charge via the Internet at http://pubs.acs.org.