

Abstract
All-atom molecular dynamics (MD) simulations in both explicit and implicit solvent, followed by MM-GBSA energy analysis, have been used to estimate binding free energies of four pyrimidine dicarboxamide inhibitors with human collagenase-3 (MMP-13) for comparison with experimental activities. Energetic analysis reveals that affinity is driven primarily by favorable van der Waals interactions and burial of total surface area. The computed effects of desolvation, as a function of ligand structure, quantitatively show that hydrophilic derivatives pay greater penalties upon binding than their related more hydrophobic analogs.
The initial excitement generated by early matrix metalloproteinase (MMP) inhibitors (MMPIs) for treatment of cancer was dampened by disappointing clinical trial results which showed little or no efficacy.1,2 In retrospect, early compounds such as marimastat were too broad spectrum and efforts are now focused on design of inhibitors selective for a given MMP. Engel et al.3 has recently reported a series of highly selective pyrimidine dicarboxamide inhibitors, shown in Table 1, which target human collegenase-3 (MMP-13). These compounds showed no activity against ten other MMPs tested. Uniquely, these are the first reported MMPIs whose mechanism of action is not chelation of the active site catalytic zinc ion.3
Table 1.
Experimental activities of pyrimidine dicarboxamides with MMP-13.
IC50 values in nM from reference 3.
ΔGbind exptl estimated as RT ln (IC50) in kcal/mol.
Despite minimal changes to the pyrimidine scaffold, the ligands reported by Engel et al.3 span a wide 4 kcal/mol range in binding free energy which makes an ideal test case for evaluating computer-aided design methods. In this report, we have used all-atom molecular dynamics (MD) computer simulations, in conjunction with free energy calculations, in an effort to characterize which specific physical properties modulate binding for this MMPI series. To evaluate how different water models affect the results, separate MD trajectories for each protein-ligand complex were generated in both explicit TIP3P4 (TIP3P-MD) and implicit Generalized Born5 (GB-MD) solvent. Implicit-based MD provides an attractive alternative to explicit solvent simulations when enhanced sampling is desired.
For each protein-ligand complex free energies of binding were estimated using the MM-GBSA6 method. Our laboratory has recently employed this method to quantify inhibition for peptides with HIVgp417 and characterize origins of resistance for small molecules with neuraminidase.8 An earlier study by Rizzo et al.9 used the method to quantify binding and selectivity for the related MMP-1 and MMP-3 systems with good results. Although considered to be an approximate approach, the relatively straightforward setup, ease of use, and the ability to study large structural and conformational changes make use of MM-GBSA an attractive alternative to more computationally intensive methods such as free energy perturbation (FEP).
Using coordinates saved periodically during an MD simulation of each relevant complex the binding affinities are estimated via eq 1.
| (1) |
In eq 1, ΔEcoul and ΔEvdw are nonbonded protein-ligand intermolecular Coulombic and van der Waals energies, ΔΔGhyd is the change in system hydration (desolvation penalties), and TΔS is the change in solute vibrational, rotational, and translational entropy. The energies are computed using a classical molecular mechanics force field. ΔΔGhyd is obtained from ΔGhyd = Gpolar + Gnonpolar of each species (complex, receptor, and ligand). The GB5 method is used to estimate Gpolar and molecular solvent accessible surface (SASA) is used to estimate Gnonpolar = γ*SASA + β using standard constants.10 TΔS energies are computed from normal-mode analysis of energy minimized structures.6
Setup, simulations, and analysis employed the AMBER8 suite of programs11 which was used for assignment of force field parameters (leap, antechamber), MD simulations/post processing (sander, ptraj), and normal mode calculations (nmode). AMBER radii (mbondi2) with dielectric constants (1 and 78.5) and GB model (igb=5) were used for both the original GB-MD simulations and the single-point calculations used to obtain the energy terms in eq 1. For explicit solvent simulations the water was stripped off prior to MM-GBSA analysis.
The catalytic domain of human collagenase-3 (MMP-13) complexed with ligand P03 (pdb entry 1XUC)3 was used as a starting point for the simulations as shown schematically in Figure 1. Other analogs in Table 1 were manually constructed using the coordinates of 1XUC as a guide with the program MOE.12 His residues were singly protonated at either the epsilon (Nε) or delta nitrogen position (Nδ) to maximize coordination with zinc. Two zinc and two calcium ions were retained but all crystallographic waters were removed. FF99SB13 and GAFF14 parameters were used for the protein residues and ligands respectively. Ligand partial atomic charges were obtained from ChelpG15 calculations at the HF/6-31G*//HF/6-31G* level of theory using Gaussian98.16 Zinc parameters were taken from the Stote et al.17 nonbonded model.
Figure 1.
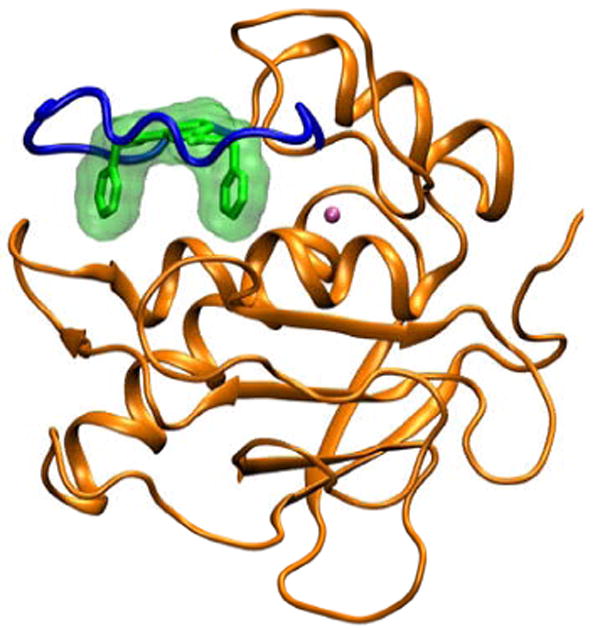
MMP-13 (orange) complexed with ligand P03 (green) from pdb entry 1XUC. The catalytic zinc ion is shown in cyan and the flexible binding site loop is shown in blue.
A multi-step equilibration procedure was used for both simulation protocols with the intent of obtaining representative and stable ensembles using short simulation times. For explicit solvent (TIP3P-MD), energy minimization for 1000 cycles followed by 15 ps of MD was first performed using a restraint weight of 5.0 kcal/mol Å2 on heavy atoms (steps 1-2). Next, three energy minimizations of 1000 cycles each were done in which heavy atoms restraints were reduced from 2.0, 0.1, to 0.0 kcal/mol Å2 (steps 3-5). Two short 5 ps MD runs followed using weights of 1.0 and 0.5 kcal/mol Å2 (steps 6-7). Finally, a 10 ps MD equilibration followed with 0.5 kcal/mol Å2 restraints only on backbone atoms and ions (step 8). Lastly, equilibration for 505 ps followed by production MD for 500 ps was performed (steps 9-10) in which restraints were used only on ions and backbone atoms further than ca 10 Å from each ligand (0.5 kcal/mol Å2 weight). All MD runs were at 298.15 K and used a 1 fs time step during equilibration (steps 1-8) and a 2 fs time step during final equilibration and production (steps 9-10). The particle mesh Ewald (PME)18 method was used with 8.0 Å direct-space nonbonded cutoff. Implicit solvent simulations (GB-MD) employed the exact same multi-step protocol however PME was not used, the nonbonded cutoff was increased to 15.0 Å, and a 1 fs time step was employed.
All simulations were well-behaved as measured by root-mean-square stability and plots of energy vs time. Energetic results from the last 500 ps are shown in Table 2. Here, free energies of binding, calculated both with (ΔGMM-GBSA+E) and without (ΔGMM-GBSA) solute entropy are listed along with a breakdown of the individual energy terms in eq 1. Both explicit and implicit-solvent results are presented along with correlation coefficients (r2 values) computed for all columns with the experimental activities. However, given that the dataset contains a small number of ligands, these r2 values are useful only in the context of viewing general trends. Nevertheless, an inspection of the correlations, along with the raw energy components, clearly reveal that both simulation protocols yield the same trends with the sole exception being TΔS as discussed further below. Figure 2 highlights the overall good agreement.
Table 2.
Contributions towards calculated free energies of binding for pyrimidine dicarboxamide inhibitors with MMP-13.a
| MMPI | ΔEvdw (N=501) A |
ΔEcoul (N=501) B |
ΔΔGpolar (N=501) C |
ΔΔGnonpolar (N=501) D |
TΔS (N=21) E |
ΔGMM-GBSA A+B+C+D G |
ΔGMM-GBSA+E A+B+C+D+E H |
ΔGbind exptlb I |
|---|---|---|---|---|---|---|---|---|
| Explicit Water (TIP3P-MD) | ||||||||
| P01 | -52.65 ± 0.11 | -22.97 ± 0.20 | 44.77 ± 0.15 | -5.63 ± 0.00 | -18.86 ± 1.93 | -36.48 ± 0.13 | -17.61 ± 1.93 | -7.07 |
| P02 | -52.07 ± 0.12 | -17.35 ± 0.13 | 35.72 ± 0.10 | -5.76 ± 0.00 | -20.28 ± 1.45 | -39.44 ± 0.12 | -19.17 ± 1.46 | -8.73 |
| P03 | -59.42 ± 0.11 | -21.26 ± 0.14 | 40.22 ± 0.10 | -6.09 ± 0.00 | -26.16 ± 2.00 | -46.55 ± 0.12 | -20.38 ± 2.00 | -9.75 |
| P04 | -60.30 ± 0.11 | -25.29 ± 0.14 | 44.59 ± 0.10 | -6.35 ± 0.00 | -26.57 ± 1.90 | -47.35 ± 0.12 | -20.79 ± 1.90 | -11.05 |
| r2 = 0.74 | r2 = 0.12 | r2 = 0.00 | r2 = 0.94 | r2 = 0.85 | r2 = 0.89 | r2 = 0.96 | ||
| Implicit Water (GB-MD) | ||||||||
| P01 | -52.47 ± 0.14 | -25.74 ± 0.22 | 47.04 ± 0.17 | -5.80 ± 0.01 | -15.85 ± 2.20 | -36.97 ± 0.14 | -21.12 ± 2.21 | -7.07 |
| P02 | -54.81 ± 0.12 | -21.13 ± 0.16 | 39.70 ± 0.13 | -5.91 ± 0.01 | -11.36 ± 1.76 | -42.14 ± 0.13 | -30.78 ± 1.77 | -8.73 |
| P03 | -57.76 ± 0.15 | -18.72 ± 0.16 | 38.94 ± 0.11 | -6.46 ± 0.01 | -21.06 ± 2.01 | -43.99 ± 0.15 | -22.93 ± 2.02 | -9.75 |
| P04 | -59.62 ± 0.14 | -24.76 ± 0.17 | 44.90 ± 0.14 | -6.52 ± 0.01 | -18.43 ± 1.58 | -46.00 ± 0.14 | -27.57 ± 1.59 | -11.05 |
| r2 = 0.98 | r2 = 0.06 | r2 = 0.09 | r2 = 0.85 | r2 = 0.23 | r2 = 0.97 | r2 = 0.18 | ||
All energies ± standard error of the mean in kcal/mol.
ΔGbind exptl from Table 1.
Figure 2.
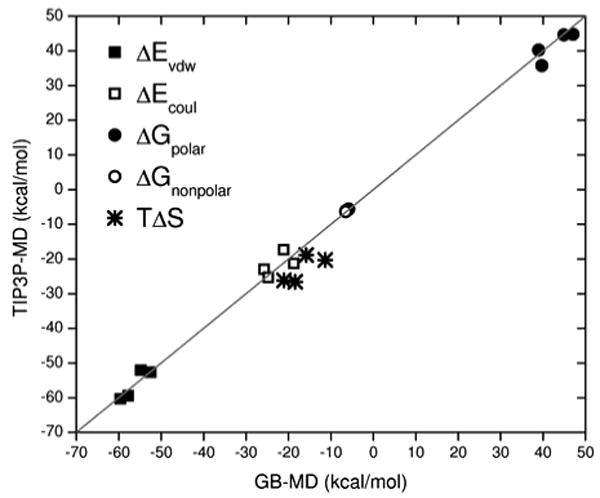
Comparison between energy components obtained from explicit solvent (TIP3P-MD) and implicit solvent (GB-MD) trajectories.
Notably, both MD simulation protocols yield comparable binding free energies (Table 2 column G, ΔGMM-GBSA) which correctly reproduce the experimental ordering provided TΔS is omitted. In both cases, increased favorable intermolecular packing, as embodied in ΔEvdw and ΔΔGnonpolar (Table 2 columns A and D) appears to best explain the experimental variation. In general, more van der Waals contact occurs and more surface area is systematically buried as additional atoms are added to the ligand scaffold.
Both simulation protocols also yield the same trends in intermolecular Coulombic interactions (Table 2 column B). The ΔEcoul terms are consistently more favorable for the more polar P01/P04 pair versus the more hydrophobic P02/P03 pair. Further, the simulations quantify the important desolvation effects which are a function of ligand structure. The more hydrophilic P01 (pyridine) and P04 (o-fluro toluene) derivates show greater desolvation penalties (Table 2, ΔΔGpolar column C) of ca. 45 – 47 kcal/mol compared with the more hydrophobic P02 (benzene) and P03 (toluene) compounds at 36 – 40 kcal/mol. Consistent with these quantitative GB results are the visual patterns of hydration observed in snapshots from the explicit solvent MD simulations (Figure 3). In all cases, water is clustered about the central polar dicarboxamide pyrimidine scaffold. However, for the more polar derivatives, additional waters cluster about the terminal pyridine (P01) and o-fluro toluene (P04) groups in comparison with the more hydrophobic benzene (P02) and toluene (P03) groups.
Figure 3.
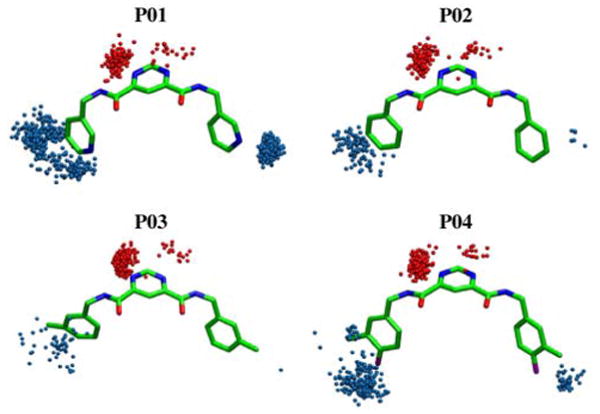
Solvation patterns for MMPIs from explicit solvent TIP3P-MD trajectories (N=500). Spheres indicate water oxygens within 2.5 Å of ligand heavy atoms for the center pyrimidine ring (red) or outer rings (blue).
Compared with the other energy terms (Table 2, Figure 2) estimates for TΔS appear to be more sensitive to the sampling protocol used to derive the ensembles. Explicit MD trajectories yield TΔS energies which lead to a systematic increase in entropy across the ligand series which also correlate with ΔGbind exptl. The implicit-derived results show a different pattern. Surprisingly, an examination of individual results from snapshots which comprise the average entropy values listed in Table 2 reveal that some GB-derived terms yield positive values. Positive TΔS terms are not intuitive as the overall change in free energy is expected to decrease (ΔG = ΔH − TΔS) when solute entropy changes are included. In contrast, explicit solvent calculations showed no such anomalies. Here, the greater variation inherent in GB vs TIP3P ensembles is likely the dominant factor for the observed TΔS differences. As illustrated in Figure 4, coordinates from implicit MD show greater variation than the corresponding set from explicit MD after the extensive energy minimizations required for the nmode calculations used to compute TΔS. In general, use of larger ensembles is probably more important for entropy estimates when using implicit simulation results given the greater variation observed here for minimized GB-MD snapshots. Studies to more fully address how sampling influences TΔS results, across different simulations protocols, are underway in our laboratory.
Figure 4.
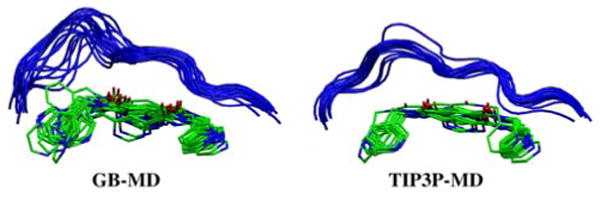
Energy minimized snapshots (N=21), from both simulation protocols, for the P01-MMP13 complex. Binding site loop in blue.
Incorporating the intuitively correct TΔS results derived from explicit solvent simulations yields a strong correlation with ΔGbind exptl of r2=0.96 (Table 2 column H). Most striking is the fact that the computed relative free energies of binding (ΔΔGbind) yield quantitative agreement with the experimental results as shown in Table 3. With high accuracy, the explicit ΔΔGMM-GBSA+E results quantify the effects of functional group substitution for changing pyridines on P01 to benzene (−1.66 exptl vs −1.56 calcd, P02), adding ortho methyl groups (−2.68 exptl vs −2.77 calcd, P03), and adding para fluorines (−3.88 exptl vs −3.18 calcd, P04). Importantly, this accuracy approaches that of FEP methods which are historically regarded as the gold standard in binding energy calculations with errors on the order of only ca. 0.25 to 0.5 kcal/mol. Further investigation of MM-GBSA methods is clearly warranted.
Table 3.
Relative free energies of binding (ΔΔG) from TIP3P-MD simulations for pyrimidine dicarboxamide inhibitors with MMP-13.a
| MMPI | ΔΔGbind exptla | ΔΔGMM-GBSA+E |
|---|---|---|
| P01 | 0.00 | 0.00 |
| P02 | -1.66 | -1.56 |
| P03 | -2.68 | -2.77 |
| P04 | -3.98 | -3.18 |
Experimental and predicted values from Table 1 normalized to P01.
In summary, results from all-atom simulations of four pyrimidine dicarboxamide inhibitors with MMP-13 have been used to characterize what drives binding and to test the effects of using explicit vs implicit solvent MD. Both modeling methods reveal that variations in van der Waals interactions (ΔEvdw) and burial of surface area (ΔΔGnonpolar) best describe the experimental results. The calculations also yield physically sound ΔΔGpolar and ΔEcoul energies with the more polar compounds showing enhanced Coulombic interactions in the binding site and an associated larger desolvation penalty. An examination of explicit solvent results reveals local changes in hydration, as a function of ligand structure, in good visual agreement with the GBSA results.
The strong correspondence in the results suggest that overall both MD protocols sample comparable regions of the energy landscapes which is encouraging for use of GB-derived ensembles for estimation of ΔGbind. The exception is solute entropy for which implicit and explicit-derived results yield TΔS terms which are not correlated. The addition of implicit-derived entropy to the calculated free energies of binding yield diminished agreement with experiment. However, for explicit solvent results good accord is obtained in all cases. In particular, relative free energies of binding (ΔΔGbind) are in striking quantitative agreement. Future studies should examine the use of larger datasets, longer simulations, and in particular larger ensembles for estimation of TΔS to more fully assess convergence.
Acknowledgments
Gratitude is expressed to the New York State Office of Science Technology and Academic Research, the Office of the Vice President of Research at Stony Brook, and the Computational Science Center at Brookhaven National Laboratory for support.
Footnotes
Publisher's Disclaimer: This is a PDF file of an unedited manuscript that has been accepted for publication. As a service to our customers we are providing this early version of the manuscript. The manuscript will undergo copyediting, typesetting, and review of the resulting proof before it is published in its final citable form. Please note that during the production process errors may be discovered which could affect the content, and all legal disclaimers that apply to the journal pertain.
References and Notes
- 1.Coussens LM, Fingleton B, Matrisian LM. Science. 2002;295:2387. doi: 10.1126/science.1067100. [DOI] [PubMed] [Google Scholar]
- 2.Pavlaki M, Zucker S. Cancer Met Rev. 2003;22:177. doi: 10.1023/a:1023047431869. [DOI] [PubMed] [Google Scholar]
- 3.Engel CK, Pirard B, Schimanski S, Kirsch R, Habermann J, Klingler O, Schlotte V, Weithmann KU, Wendt KU. Chem Biol. 2005;12:181. doi: 10.1016/j.chembiol.2004.11.014. [DOI] [PubMed] [Google Scholar]
- 4.Jorgensen WL, Chandrasekhar J, Madura JD, Impey RW, Klein ML. J Chem Phys. 1983;79:926. [Google Scholar]
- 5.Still WC, Tempczyk A, Hawley RC, Hendrickson T. J Am Chem Soc. 1990;112:6127. [Google Scholar]
- 6.Kollman PA, et al. Acc Chem Res. 2000;33:889. doi: 10.1021/ar000033j. [DOI] [PubMed] [Google Scholar]
- 7.Strockbine B, Rizzo RC. Proteins: Struct Func Bioinformatics. 2007;67:630. doi: 10.1002/prot.21301. [DOI] [PubMed] [Google Scholar]
- 8.Chachra R, Rizzo RC. J Chem Theory Comput. 2008;4:1526. doi: 10.1021/ct800068v. [DOI] [PubMed] [Google Scholar]
- 9.Rizzo RC, Toba S, Kuntz ID. J Med Chem. 2004;47:3065. doi: 10.1021/jm030570k. [DOI] [PubMed] [Google Scholar]
- 10.Sitkoff D, Sharp KA, Honig B. J Phys Chem. 1994;98:1978. [Google Scholar]
- 11.AMBER Version 8. University of California at San Francisco; San Francisco, CA: 2004. [Google Scholar]
- 12.MOE, Chemical Computing Group: Montreal, Canada, 2007.
- 13.Hornak V, Abel R, Okur A, Strockbine B, Roitberg A, Simmerling C. Proteins. 2006;65:712. doi: 10.1002/prot.21123. [DOI] [PMC free article] [PubMed] [Google Scholar]
- 14.Wang J, Wolf RM, Caldwell JW, Kollman PA, Case DA. J Comput Chem. 2004;25:1157. doi: 10.1002/jcc.20035. [DOI] [PubMed] [Google Scholar]
- 15.Breneman CM, Wiberg KB. J Comput Chem. 1990;11:361. [Google Scholar]
- 16.Frisch MJ, et al. Gaussian 98, revision A.9. Gaussian Inc.; Pittsburgh PA: 1998. [Google Scholar]
- 17.Stote RH, Karplus M. Proteins. 1995;23:12. doi: 10.1002/prot.340230104. [DOI] [PubMed] [Google Scholar]
- 18.Darden T, York D, Pedersen L. J Chem Phys. 1993;98:10089. [Google Scholar]