Abstract
The spindle assembly checkpoint (SAC) monitors the attachment of microtubules to the kinetochore and inhibits anaphase when microtubule binding is incomplete. The SAC might also respond to tension; however, how cells can sense tension and whether its detection is important to satisfy the SAC remain controversial. We generated a HeLa cell line in which two components of the kinetochore, centromere protein A and Mis12, are labeled with green and red fluorophores, respectively. Live cell imaging of these cells reveals repetitive cycles of kinetochore extension and recoiling after biorientation. Under conditions in which kinetochore stretching is suppressed, cells fail to silence the SAC and enter anaphase after a delay, regardless of centromere stretching. Monitoring cyclin B levels as a readout for anaphase-promoting complex/cyclosome activity, we find that suppression of kinetochore stretching delays and decelerates cyclin B degradation. These observations suggest that the SAC monitors stretching of kinetochores rather than centromeres and that kinetochore stretching promotes silencing of the SAC signal.
Introduction
Faithful segregation of chromosomes is ensured by a fail-safe mechanism called the spindle assembly checkpoint (SAC). The SAC inhibits the activity of the multisubunit ubiquitin protein ligase called the anaphase-promoting complex/cyclosome (APC/C). After biorientation is established, the activity of the SAC is silenced to allow APC/C activation (for review see Musacchio and Salmon, 2007). Activation of the APC/C then leads to degradation of a protein called securin and the major mitotic cyclin, cyclin B1, which triggers chromosome segregation in anaphase (for review see Peters, 2006).
The SAC is believed to monitor two parameters in kinetochore–microtubule interactions: attachment and tension (for review see Musacchio and Salmon, 2007). Although experimental support for the role of microtubule attachment in satisfying the SAC is solid, the role of tension in this process remains controversial (Pinsky and Biggins, 2005). We created a HeLa cell line that expresses fluorescently tagged versions of the kinetochore proteins centromere protein A (CENP-A; EGFP–CENP-A) and Mis12 (mCherry-Mis12). CENP-A is a histone H3 variant, which is part of nucleosomes in centromeric chromatin, whereas Mis12 is part of the Mis12–Mtw1 complex, which is located slightly exterior to CENP-A at the kinetochore region (Kline et al., 2006). By analyzing this cell line, we found that kinetochores undergo physical changes, which indicate that kinetochores are flexible and dynamic structures. Our results suggest that the repetitive kinetochore deformations mediate inactivation of the SAC and thereby enable the transition from metaphase to anaphase.
Results and discussion
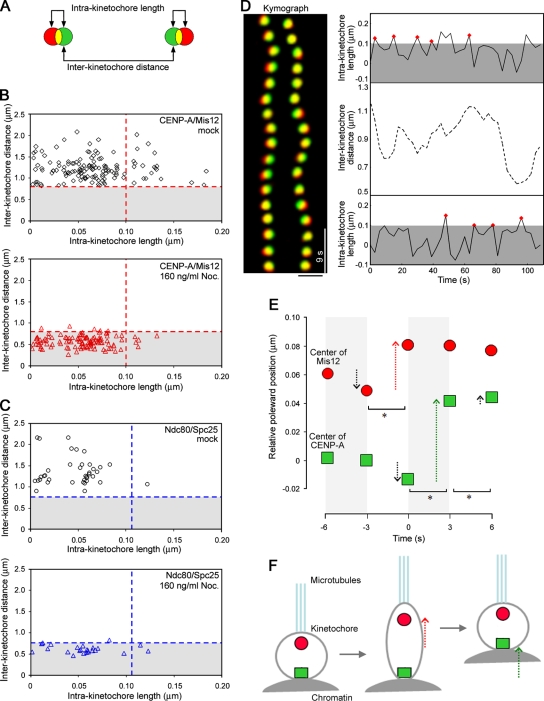
Increased interkinetochore distance has been used to indirectly indicate the presence of tension applied on kinetochores, but we set out to monitor the tension more directly. To this aim, we generated a HeLa cell line that stably expresses two components of the kinetochore, CENP-A and Mis12, tagged with EGFP and mCherry, respectively (Fig. 1 A). The green and red signal from CENP-A and Mis12 largely overlapped in many kinetochores, but in some cases they were separated from each other (Video 1, available at http://www.jcb.org/cgi/content/full/jcb.200811028/DC1). To study this quantitatively, kinetochores from fixed metaphase cells were measured for the interkinetochore distances, indicated by the distance between paired CENP-A dots, as well as intrakinetochore lengths, which should be indicated by the distance between CENP-A and Mis12 dots (Fig. 1 B). To interpret the resulting profile, we determined a threshold that includes a 95% confidential interval of intrakinetochore length in the absence of spindle pulling force (Fig. S1). A statistic calculation gave a value of 0.10 µm, which allowed us to estimate that ∼15% of extended kinetochores depend on microtubule pulling force, whereas in the remaining ∼85% of kinetochores, deformation was below the threshold level in unperturbed metaphase (Fig. 1 B, mock). To validate our results, we also assayed the cells that coexpress EGFP-Ndc80–Hec1 and Spc25-mCherry. Because these two kinetochore proteins are in the same Ndc80–Hec1 complex (Ciferri et al., 2005), we expected that the distance between these two proteins might not fluctuate in bioriented kinetochores. Consistent with this notion, we hardly saw separation of EGFP-Ndc80–Hec1 and Spc25-mCherry signals beyond the threshold level (Fig. 1 C). Kinetochore stretching may therefore separate outer kinetochore regions from centromeric chromatin but does not disrupt Mis12–Mtw1 complexes that are localized within the outer kinetochore.
Figure 1.
Kinetochores undergo intermittent deformations. (A) Measurement of intra- and interkinetochore lengths and distances. The green and red circles represent EGFP–CENP-A and mCherry-Mis12, respectively. (B) Setting a threshold for the intra- and interkinetochore lengths/distances. Fixed cells treated with 160 ng/ml (531.6 nM) nocodazole (Noc.) were analyzed for the intra- and interkinetochore lengths and distances, and their threshold values (red dotted lines) were calculated as 0.10 µm and 0.79 µm, respectively (n = 112 kinetochores from 13 cells; bottom). These values were applied to the profile in a mock condition (n = 118 kinetochores from 12 cells; top). (C) A profile for intra- and interkinetochore lengths and distances obtained for EGFP-Ndc80 and Spc25-mCherry. The threshold values determined in the 160-ng/ml nocodazole condition (n = 24 kinetochores from 5 cells) were 0.11 µm and 0.76 µm for the intra- and interkinetochore length/distance, respectively (blue dotted lines). In a mock condition, <3% of cases had intrakinetochore length beyond the threshold level (n = 38 kinetochores from 5 cells). (D) A kymograph of a kinetochore pair. Note that mCherry-Mis12 signal (red) deviates from EGFP–CENP-A signal (green) transiently. The right panel shows representative intra- and interkinetochore lengths and distances over time. Red diamonds indicate peaks for the intrakinetochore lengths that were subjected to the analysis in E. (E) Basis for CENP-A and Mis12 behavior. Relative poleward positions of CENP-A and Mis12 are determined by averaging 76 cases. Time 0 defines the peak of the intrakinetochore length, and the position of CENP-A at −6 s is set to 0. Arrows indicate the movements of CENP-A and Mis12 during 3-s intervals, and the asterisks mark the significant movement change (t test; *, P < 0.05). Movements of CENP-A and Mis12 on one kinetochore did not significantly affect their movements on the other kinetochore (Fig. S2, available at http://www.jcb.org/cgi/content/full/jcb.200811028/DC1); the stretching occurs on kinetochore sisters independently from each other. (F) A cartoon illustrating kinetochore extension and recoiling. Dotted red and green arrows indicate significant poleward movements of CENP-A and Mis12, respectively. Bar, 1 µm.
Using the CENP-A/Mis12 fluorescently labeled cell line, we performed live cell imaging and analyzed the behavior of EGFP and mCherry particles during metaphase. As exemplified in the kymograph of a kinetochore pair, most of the kinetochores reveal overlapping yellow signal, but occasionally the red signal deviates from the green signal toward the pole (Fig. 1 D, left). An automated detection of particle trajectories revealed that there is a transient increase of intrakinetochore length over the threshold level every 6–21 s, whereas the interkinetochore distance seems to change in a less frequent manner (Fig. 1 D, right). To ask whether there is any basis for these particle movements, we selected time points when the maximum intrakinetochore length scored larger than the threshold level within a single time point and averaged the movements of CENP-A and Mis12 particles for 6 s before and after the peak points. We found that when the intrakinetochore length reaches a peak, there tends to be a poleward movement of Mis12. Interestingly, it was typically 3 s later when CENP-A moved toward the pole after Mis12 (Fig. 1, E and F).
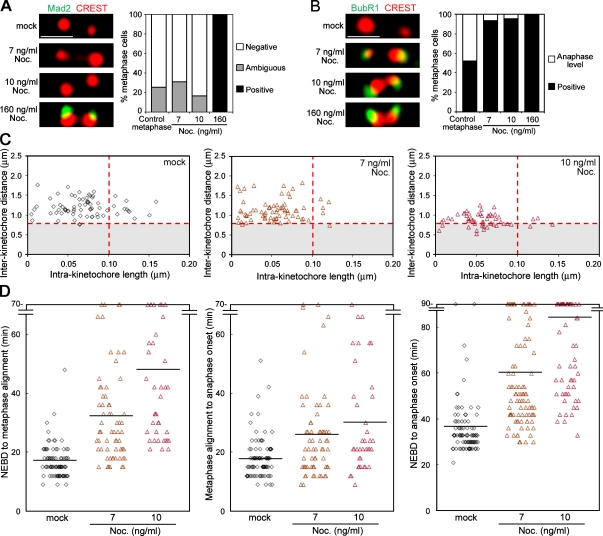
The characteristic movements of CENP-A and Mis12 suggest that kinetochores undergo extension and recoiling repetitively, which we call “kinetochore stretching.” To distinguish the functional relevance of stretching kinetochores from stretching inner centromeres, we sought to find a condition under which the kinetochore stretching is inhibited but the interkinetochore distance is retained by challenging cells with low doses of microtubule poisons. When cells were treated with 10 ng/ml (33.2 nM) nocodazole, the function of mitotic spindles to create the pulling force was perturbed, as judged by a marked decrease of the interkinetochore distance (P < 0.01, t test) as well as the intrakinetochore length (P < 0.05), without disintegrating overall spindle structure (Fig. 2 C and Fig. S1). Interestingly, when the nocodazole concentration was lowered further to 7 ng/ml (23.3 nM), there was no obvious effect on the interkinetochore distances, but there were fewer stretched kinetochores (Fig. 2 C). Under these conditions, we asked whether the cells delay anaphase onset in response to suppression of the kinetochore stretching. To address this, we filmed the EGFP-H2B–expressing HeLa cells in the presence of low concentrations of nocodazole and found that 7-ng/ml nocodazole treatments gave rise to a delay in the metaphase to anaphase transition (Fig. 2 D).
Figure 2.
Kinetochore stretching is required to inactivate the SAC. (A) Release of Mad2 from kinetochores in low nocodazole (Noc.) conditions. The kinetochore Mad2 staining in cells treated with the indicated concentrations of nocodazole (left) were classified according to their intensities. A histogram compares the percentages of metaphase cells that have no Mad2 on any kinetochores (white) with cells that have positive (black) or ambiguous (gray) Mad2 staining on at least one kinetochore (n = 16 cells). (B) Enrichment of BubR1 at kinetochores in the low nocodazole conditions. Kinetochore BubR1 intensities were classified into high (positive; black) or low (anaphase level; white). The percentages of metaphase cells for BubR1 staining were summarized in a histogram as in A (n = 16 cells). (C) Suppression of the kinetochore stretching in low nocodazole conditions. Kinetochore profiles were analyzed in the conditions indicated. Red dotted lines represent threshold values defined in Fig. 1 B. The stretched kinetochores were found in 15.5%, 6.9%, and 7.1% of cases, and the interkinetochore distances were 1.19 ± 0.03 µm (mean ± SEM), 1.13 ± 0.03 µm, and 0.88 ± 0.02 µm for mock (n = 71, 9 cells) and 7-ng/ml (n = 72, 7 cells) and 10-ng/ml (n = 56, 6 cells) nocodazole conditions, respectively. (D) Mitotic progression in low nocodazole conditions. The time intervals between the indicated mitotic events were measured in mock (n = 86 cells) or 7-ng/ml (n = 65 cells) or 10-ng/ml (n = 38 cells) nocodazole treatment experiments. Horizontal lines indicate the mean. Bars, 1 µm.
Prolonged metaphase seen in the low nocodazole treatment could be caused by a reduced incidence of kinetochore stretching, but it could also be caused by incomplete microtubule attachment to kinetochores because lack of tension is known to weaken the attachment (King and Nicklas, 2000). To distinguish between these possibilities, we stained cells for Mad2 whose kinetochore localization is sensitive to the detachment of microtubules (Waters et al., 1998). Significantly, >70% of cells did not have any Mad2 detectable at any of their kinetochores, whereas it was unambiguously positive in most of the kinetochores tested when microtubules were disrupted (Fig. 2 A). Thus, low nocodazole treatment did not cause microtubule detachments that can be detected by Mad2 but instead inhibited kinetochore stretching. These observations lead us to hypothesize that stretching the kinetochore by itself primarily mediates silencing the SAC. Furthermore, the results with two different doses of nocodazole treatment imply that centromere stretching is rather dispensable to silence the SAC.
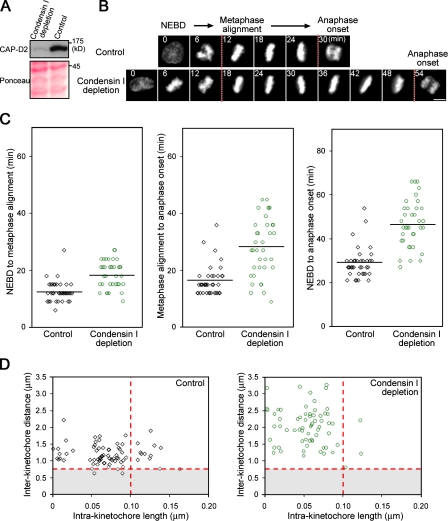
To further address whether the suppression of kinetochore stretching is involved in silencing the SAC, we next assayed intrakinetochore lengths in cells depleted of condensin I, a chromosomal protein complex that is known to confer integrity to centromeric chromatin (Gerlich et al., 2006). It was of particular interest to test the hypothesis in condensin I–depleted cells because kinetochores might not be under sufficient tension as a result of mechanically labile centromeres (Savvidou et al., 2005). As predicted, the depletion of the condensin I subunit CAP-D2 by RNAi resulted in a marked increase in interkinetochore distances (Fig. 3 D). In these cells, we noticed suppression of the kinetochore stretching both in fixed (Fig. 3 D) and live conditions (Videos 2 and 3, available at http://www.jcb.org/cgi/content/full/jcb.200811028/DC1). As previously shown (Hirota et al., 2004; Watrin and Legagneux, 2005), condensin I–depleted cells revealed a significant delay in mitotic progression (Fig. 3, B and C); therefore, interkinetochore stretching is not sufficient for silencing the SAC.
Figure 3.
Suppression of kinetochore stretching by condensin I depletion correlates with a delay in mitotic progression. (A) Depletion of CAP-D2. Cells transfected with the indicated siRNA were analyzed by Western blotting with CAP-D2 antibodies. The Ponceau S staining serves as a loading control. (B) Live cell imaging of condensin I–depleted cells. EGFP–histone H2B–expressing cells were transfected with siRNAs and analyzed after 72 h. Mitosis images were extracted from long-term imaging experiments and aligned on the time axis according to nuclear envelope breakdown (NEBD). The time points for metaphase alignment and anaphase onset are defined by dashed lines. (C) Mitotic progression in condensin I–depleted cells. The time intervals between the indicated mitotic events were measured in control (n = 38 cells) or condensin I RNAi (n = 36 cells) experiments. Horizontal lines indicate the mean. (D) Kinetochore stretching is suppressed in condensin I–depleted cells. Kinetochore profiles were assessed with the threshold values defined in Fig. 1 B (red dotted lines). The incidences for the kinetochore stretching were 16.2% and 4.5%, and the interkinetochore distances were 1.19 ± 0.03 µm (mean ± SEM) and 2.02 ± 0.07 µm for control (n = 74, 9 cells) and condensin I–depleted cells (n = 66, 10 cells), respectively. Bar, 10 µm.
Notably, the prolonged mitosis in condensin I–depleted cells was largely caused by a delay of anaphase onset after alignment of all chromosomes in metaphase (Fig. 3 C, middle). Because spindle morphology and microtubule attachments to kinetochores are not detectably affected in condensin I–depleted cells (Fig. S3, available at http://www.jcb.org/cgi/content/full/jcb.200811028/DC1; Gerlich et al., 2006), it is plausible that these chromosomes had achieved biorientation; nevertheless, the metaphase to anaphase transition was delayed. An implication from these observations is that the kinetochore stretching promotes anaphase to take place after chromosomes become bioriented on the spindle.
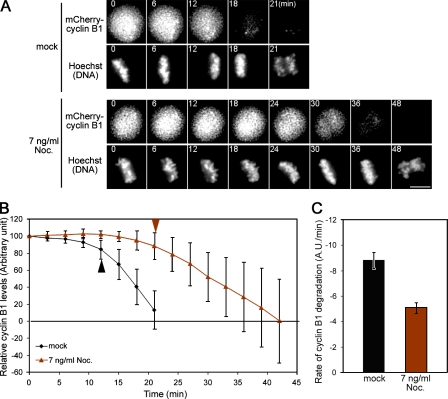
In mammalian cells, proteolysis of securin and cyclin B begins after all of the chromosomes achieve biorientation at the beginning of metaphase and ends before the anaphase onset (Clute and Pines, 1999; Hagting et al., 2002). To investigate how kinetochore stretching relates to SAC inactivation, we analyzed protein levels of cyclin B1 as a measure of SAC activity during the metaphase to anaphase transition. To do this, HeLa cells that stably express mCherry-tagged cyclin B1 were analyzed in the absence or presence of 7 ng/ml nocodazole, a condition that suppresses the kinetochore stretching (Fig. 2 C), and the obtained images were quantified for fluorescence intensities over time (Fig. 4 A). The resulting data revealed a stark difference in the kinetics for cyclin B1 proteolysis between the two conditions. In nocodazole-treated metaphase cells, cyclin B1 remained largely stable, and once cyclin B1 started to be degraded, the fluorescence intensity declined more slowly than in control cells (Fig. 4 B). By fitting a linear function, we determined the degradation rate, which should reflect the activity of APC/C. The low nocodazole treatment caused a drop to about half of the rate observed in control cells (−5.03 ± 0.43 arbitrary units/min vs. −8.83 ± 0.62 arbitrary units/min; Fig. 4 C). These changes in degradation kinetics caused nocodazole-treated cells to take twice as long as controls to reach the levels initiating anaphase. The reduced rate of cyclin B1 degradation suggests that activation of the APC/C was dampened and can explain why perturbation of kinetochore stretching caused a delay in the metaphase to anaphase transition.
Figure 4.
Kinetochore stretching promotes APC/C activation in metaphase. (A) Metaphase to anaphase transition in control or in 7 ng/ml nocodazole-treated cells. Levels of mCherry–cyclin B1 were followed with Hoechst DNA staining. Images were extracted from long-term imaging experiments and aligned on the time axis according to the metaphase alignment. (B) Kinetics of cyclin B1 proteolysis. Fluorescence intensities of cyclin B1 were measured during metaphase cells from both mock-treated (black line; n = 12) and 7 ng/ml nocodazole-treated experiments (brown line; n = 12), and the mean ± SD was plotted for each time point. Levels of fluorescence were normalized to the value just after the metaphase alignment. Arrowheads indicate the time points when cyclin B1 begin to degrade. (C) Quantification of the cyclin B1 degradation rate. The degradation rate of cyclin B1 intensities from 12 cells were averaged for each experiment and are shown in a histogram with SEM. A.U., arbitrary unit. Bar, 10 µm.
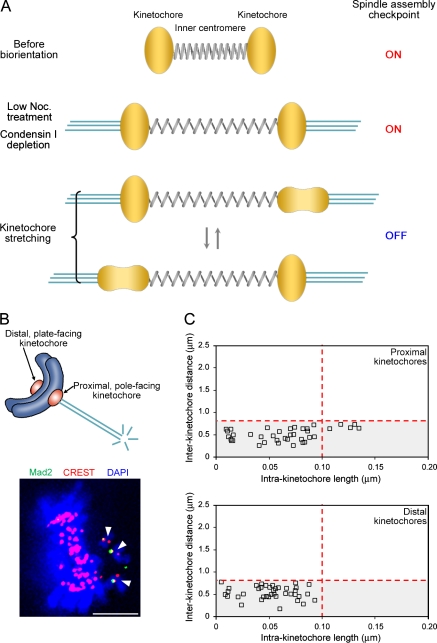
Our observations suggest that kinetochore stretching is required and centromere stretching is not sufficient to inactivate the SAC (Fig. 5 A). Finally, to address whether kinetochore stretching is sufficient for this process, we studied monooriented chromosomes that sometimes occur in an unperturbed condition. Mad2 was not detected in 19.0% of the distal plate-facing kinetochores. In contrast, Mad2 was negative in 90.5% of the proximal pole-facing kinetochores, suggesting that most of the proximal kinetochores have microtubule occupancy that can release Mad2 (Fig. 5 B). Analyzing the intrakinetochore lengths, we found that proximal kinetochores undergo stretching, whereas distal kinetochores do not (Fig. 5 C). The incidence of stretching at proximal kinetochores was 13.2%, which is comparable with that observed in bioriented chromosomes. As indicated by interkinetochore distances, centromeres were not stretched. Importantly, the laser ablation experiments have shown that the microtubule-attached kinetochores on monooriented chromosomes are not sensed by the SAC (Rieder et al., 1995). Therefore, the finding that attached kinetochores undergo stretching is consistent with the hypothesis that kinetochore stretching is sufficient to inactivate the SAC.
Figure 5.
The kinetochore stretching is essential to silence the SAC. (A) A model illustrating the kinetochore stretching and the SAC silencing. Biorientation induces stretching of centromeres (modeled as a spring). Normally the kinetochores (yellow amorphous structures) undergo stretching, as denoted by arrows, and this kinetochore stretching promotes SAC inactivation. If kinetochore stretching is inhibited (e.g., by low nocodazole treatment or by condensin I depletion), SAC is maintained. (B) Proximal and distal kinetochores of monooriented chromosomes (top) were assessed for microtubule attachments by Mad2 recruitment as in Fig. 2 A (bottom). Monooriented chromosomes are indicated by arrowheads. (C) Stretching is induced at proximal but not at distal kinetochores of monooriented chromosomes. Profiles of the intra- and interkinetochore lengths and distances were assessed with the threshold values defined in Fig. 1 B (red dotted lines). The incidences for the kinetochore stretching were 13.2% and 0.0%, and the interkinetochore distances were 0.51 ± 0.02 µm (mean ± SEM) and 0.54 ± 0.02 µm for proximal (n = 38, 24 cells) and distal (n = 39, 24 cells) kinetochores, respectively. Bar, 5 µm.
How does the kinetochore stretching occur?
One intuitive possibility is that stretching is caused by microtubules mechanically pulling the kinetochores. In this mechanical stretching model, kinetochore deformation is based on the elastic properties that kinetochores might have. Alternatively, kinetochore stretching might be the result of conformational rearrangements of the kinetochore components. In this case, the kinetochore stretching does not necessarily reflect the presence of tension. Both models are possible and will be perturbed with a microtubule poison. The results that centromere integrity is required for kinetochore stretching (Fig. 3 D) seemingly favor the mechanical stretching model, but it does not preclude the second model. Conversely, the kinetochore stretching in monooriented chromosomes (Fig. 5 C) can be better explained by the rearrangement model. However, it would be difficult to precisely assess the presence of tension at kinetochores because when chromosomes are pulled toward the pole, they must simultaneously receive antagonizing antipoleward forces, including the polar ejection force and the resistance from cytoplasm. Thus, the transient generation of tension might not immediately affect the dynamics of the centromere or the other sister kinetochore (Fig. 1 and Fig. S2, available at http://www.jcb.org/cgi/content/full/jcb.200811028/DC1).
Does the “tensionless pathway” comprise an independent branch of the SAC?
Our findings seem to provide an important clue to this longstanding question. Although the interkinetochore distance has been used to indicate a tensionless situation, we found that stretching centromeres, by itself, does not satisfy the SAC. Such a result is consistent with the observations made in the laser ablation experiments (Rieder et al., 1995) or in cells with an unreplicated genome, in which cells eventually underwent anaphase without tension across the centromeres (O'Connell et al., 2008). Instead of centromere stretching, we propose that stretching kinetochores is primarily involved in silencing the SAC.
The kinetochore stretching appears to have a disparate significance of microtubule attachments in silencing the SAC. Suppression of stretching at many kinetochores only decelerates cyclin B1 proteolysis (Fig. 4). This clearly contrasts with the situation for kinetochore attachments, in which a single unattached kinetochore can shut off APC/C activity for a longer period. The simplest interpretation is that stretching-less kinetochores generate a weaker “wait anaphase” signal than unattached kinetochores do. Another possible view is that repetitive kinetochore stretching promotes the inactivation process, and, thus, it takes longer to silence the SAC when stretching is perturbed. How the deformations of kinetochores promote inactivation of the SAC will be the key question to address. We observed an enrichment of BubR1 but not Mad2 at kinetochores when stretching was suppressed (Fig. 2, A and B; and Fig. S3, A and B). Therefore, one plausible mechanism is that the kinetochore stretching induces some change in the kinetochore chemistry that releases BubR1 from kinetochores.
Conclusions
We found that kinetochores undergo repetitive stretching after microtubule attachments, and the SAC seems to detect stretching of kinetochores rather than stretching of centromeres, which reflects the presence of tension. Although how the tensionless pathway activates the SAC has been discussed, it might also be important to ask the other way round: namely, how kinetochore stretching promotes SAC inactivation. Whether the kinetochore stretching is based on a mechanical pulling force or on functionally induced rearrangements of kinetochore components will be important to determine.
Materials and methods
Cell culture and transfections
HeLa cells were cultured in DME supplemented with 10% FCS, 0.2 mM l-glutamine, 100 U/ml penicillin, and 100 µg/ml streptomycin at 37°C in a 5% CO2 environment. To generate HeLa cell lines that stably express fluorescent-tagged proteins, EGFP–CENP-A–expressing cells (Gerlich et al., 2006) were transfected with pmCherry-Mis12 (cDNA was provided by C. Obuse, Hokkaido University, Sapporo, Japan), or HeLa cells were transfected with pmCherry–cyclin B1 (cDNA was provided by M. Naito, University of Tokyo, Tokyo, Japan). Stable expressants were selected in a complete medium containing 0.2 µg/ml puromycin and were screened by fluorescence microscopy for the expression. For condensin I RNAi, cells were transfected with 100 nM siRNA targeting the CAP-D2 sequence 5′-UAAAGUAUCCAAGAACUGGUCUCUG-3′ (Stealth; Invitrogen). For controls, the same procedure was set up using H2O.
Live cell imaging analysis
The EGFP–CENP-A– and mCherry-Mis12–coexpressing cells were grown in chambered coverslips (Laboratory-Tek; Thermo Fisher Scientific). 1 h before imaging, the medium was changed to prewarmed CO2-independent medium without phenol red (Invitrogen), and the chamber lids were sealed with silicone grease. Recordings were made at 37°C using a custom-built temperature-controlled incubator. Time-lapse images were collected at 3-s intervals with a 100× 1.40 NA Plan Apochromat oil objective lens (Carl Zeiss, Inc.) mounted on an inverted microscope (IX-71; Olympus) equipped with a charge-coupled device camera (CoolSNAP HQ; Photometrics) that was driven by softWoRx 3.6.0 software (Applied Precision, LLC). Data analysis was performed using ImageJ version 1.37 (National Institutes of Health). Center coordinates of CENP-A and Mis12 dots and their trajectories were automatically detected using Particle Tracker version 1.5 (Sbalzarini and Koumoutsakos, 2005). Theoretical coordinates were calculated according to the time lag between sequential acquisitions of green and red fluorescence (0.5 s). The resulting data were validated by acquisition of red and green fluorescence in the reverse sequential order. In analyzing cyclin B1 proteolysis using mCherry–cyclin B1–expressing cells, DNA was stained with 0.1 µg/ml Hoechst 33342.
Fluorescence microscopy
The EGFP–CENP-A– and mCherry-Mis12–coexpressing cells were grown on 18-mm coverglasses in a 12-well dish and fixed with 3.7% (vol/vol) formaldehyde in PBS at room temperature for 20 min. Three-dimensional stacks of fixed metaphase cells were collected with 0.2-µm steps. Coordinates of the particle center were obtained by Particle Tracker version 1.5. In many cases, both the CENP-A and Mis12 dots were positioned vertically to the optical section. The tilted cases were excluded for further analyses to avoid overestimating the CENP-A/Mis12 distance. Cells expressing EGFP-Ndc80 and Spc25-mCherry were similarly analyzed (cDNAs were provided by A. Musacchio, European Institute of Oncology, Milan, Italy). For immunofluorescence microscopy, HeLa cells were fixed with 2% formaldehyde for 15 min and permeabilized with 0.2% Triton X-100 for 10 min. After being blocked with 3% BSA, cells were incubated with rabbit monoclonal Mad2 or rabbit polyclonal BubR1 antibodies as primary antibodies overnight at room temperature followed by incubation with human CREST serum for 1 h. After washing with PBS, the primary antibodies were probed with anti–rabbit Alexa Fluor 488 (Invitrogen) and anti–human Alexa Fluor 568 (Invitrogen), and DNA was stained with 0.1 µg/ml DAPI. Images were captured with a 100× 1.40 NA Plan Apochromat oil objective lens on a microscope (Imager M1; Carl Zeiss, Inc.) equipped with a charge-coupled device camera (CoolSNAP HQ) driven by MetaMorph software (MDS Analytical Technologies).
Online supplemental material
Fig. S1 shows immunofluorescence of tubulin after various doses of nocodazole treatment. Fig. S2 shows averaged movements of CENP-A and Mis12 on the opposite side of stretched kinetochores. Fig. S3 indicates that BubR1 but not Mad2 is enriched at the kinetochores in condensin I–depleted cells. Video 1 presents the kinetochore stretching in living cells. Videos 2 and 3 compare kinetochore stretching in condensin I–depleted cells (CAP-D2 RNAi) and control cells, respectively. Online supplemental material is available at http://www.jcb.org/cgi/content/full/jcb.200811028/DC1.
Acknowledgments
We are grateful to Masaru Ushijima for help in statistic analyses, to Alexey Khodjakov and Jan-Michael Peters for crucial comments on the manuscript, and to Andrea Musacchio, Chikashi Obuse, and Mikihiko Naito for cDNAs.
Research in the laboratory of T. Hirota is supported by grants from the Japan Society for the Promotion of Science and the Ministry of Education, Culture, Sports, Science and Technology of Japan.
Footnotes
Abbreviations used in this paper: APC/C, anaphase-promoting complex/cyclosome; CENP-A, centromere protein A; SAC, spindle assembly checkpoint.
References
- Ciferri C., De Luca J., Monzani S., Ferrari K.J., Ristic D., Wyman C., Stark H., Kilmartin J., Salmon E.D., Musacchio A. 2005. Architecture of the human ndc80-hec1 complex, a critical constituent of the outer kinetochore.J. Biol. Chem. 280:29088–29095 [DOI] [PubMed] [Google Scholar]
- Clute P., Pines J. 1999. Temporal and spatial control of cyclin B1 destruction in metaphase.Nat. Cell Biol. 1:82–87 [DOI] [PubMed] [Google Scholar]
- Gerlich D., Hirota T., Koch B., Peters J.M., Ellenberg J. 2006. Condensin I stabilizes chromosomes mechanically through a dynamic interaction in live cells.Curr. Biol. 16:333–344 [DOI] [PubMed] [Google Scholar]
- Hagting A., Den Elzen N., Vodermaier H.C., Waizenegger I.C., Peters J.M., Pines J. 2002. Human securin proteolysis is controlled by the spindle checkpoint and reveals when the APC/C switches from activation by Cdc20 to Cdh1.J. Cell Biol. 157:1125–1137 [DOI] [PMC free article] [PubMed] [Google Scholar]
- Hirota T., Gerlich D., Koch B., Ellenberg J., Peters J.M. 2004. Distinct functions of condensin I and II in mitotic chromosome assembly.J. Cell Sci. 117:6435–6445 [DOI] [PubMed] [Google Scholar]
- King J.M., Nicklas R.B. 2000. Tension on chromosomes increases the number of kinetochore microtubules but only within limits.J. Cell Sci. 113:3815–3823 [DOI] [PubMed] [Google Scholar]
- Kline S.L., Cheeseman I.M., Hori T., Fukagawa T., Desai A. 2006. The human Mis12 complex is required for kinetochore assembly and proper chromosome segregation.J. Cell Biol. 173:9–17 [DOI] [PMC free article] [PubMed] [Google Scholar]
- Musacchio A., Salmon E.D. 2007. The spindle-assembly checkpoint in space and time.Nat. Rev. Mol. Cell Biol. 8:379–393 [DOI] [PubMed] [Google Scholar]
- O'Connell C.B., Loncarek J., Hergert P., Kourtidis A., Conklin D.S., Khodjakov A. 2008. The spindle assembly checkpoint is satisfied in the absence of interkinetochore tension during mitosis with unreplicated genomes.J. Cell Biol. 183:29–36 [DOI] [PMC free article] [PubMed] [Google Scholar]
- Peters J.M. 2006. The anaphase promoting complex/cyclosome: a machine designed to destroy.Nat. Rev. Mol. Cell Biol. 7:644–656 [DOI] [PubMed] [Google Scholar]
- Pinsky B.A., Biggins S. 2005. The spindle checkpoint: tension versus attachment.Trends Cell Biol. 15:486–493 [DOI] [PubMed] [Google Scholar]
- Rieder C.L., Cole R.W., Khodjakov A., Sluder G. 1995. The checkpoint delaying anaphase in response to chromosome monoorientation is mediated by an inhibitory signal produced by unattached kinetochores.J. Cell Biol. 130:941–948 [DOI] [PMC free article] [PubMed] [Google Scholar]
- Savvidou E., Cobbe N., Steffensen S., Cotterill S., Heck M.M. 2005. Drosophila CAP-D2 is required for condensin complex stability and resolution of sister chromatids.J. Cell Sci. 118:2529–2543 [DOI] [PubMed] [Google Scholar]
- Sbalzarini I.F., Koumoutsakos P. 2005. Feature point tracking and trajectory analysis for video imaging in cell biology.J. Struct. Biol. 151:182–195 [DOI] [PubMed] [Google Scholar]
- Waters J.C., Chen R.H., Murray A.W., Salmon E.D. 1998. Localization of Mad2 to kinetochores depends on microtubule attachment, not tension.J. Cell Biol. 141:1181–1191 [DOI] [PMC free article] [PubMed] [Google Scholar]
- Watrin E., Legagneux V. 2005. Contribution of hCAP-D2, a non-SMC subunit of condensin I, to chromosome and chromosomal protein dynamics during mitosis.Mol. Cell. Biol. 25:740–750 [DOI] [PMC free article] [PubMed] [Google Scholar]


