Abstract
Objective
Exercise training has been shown to increase regional blood flow capacity among muscle fibers that experience increased activity during exercise. The purpose of this study was to test the hypothesis that the increased blood flow capacity is partially the result of increases in arteriolar density (number of arterioles/mm2 of tissue) specifically in skeletal muscle tissue with the largest relative increase in muscle fiber activity during training bouts.
Methods
We tested this hypothesis by comparing and contrasting the effects of endurance exercise training (ET) and interval sprint training (IST) on arteriolar density in soleus muscle (S) red (Gr) and white (Gw) portions of gastrocnemius muscle of male Sprague Dawley rats. ET rats completed 10 weeks of treadmill training 30 m/min, 15% grade, 60 min/day, 5 days/wk while IST rats completed 10 wks of IST consisting of six 2.5 min exercise bouts, with 4.5 min rest between bouts (60 m/min, 15% incline), 5 days/wk. Our hypothesis would be supported if ET increased arteriolar density in S and Gr and if IST increased arteriolar density in Gw.
Results
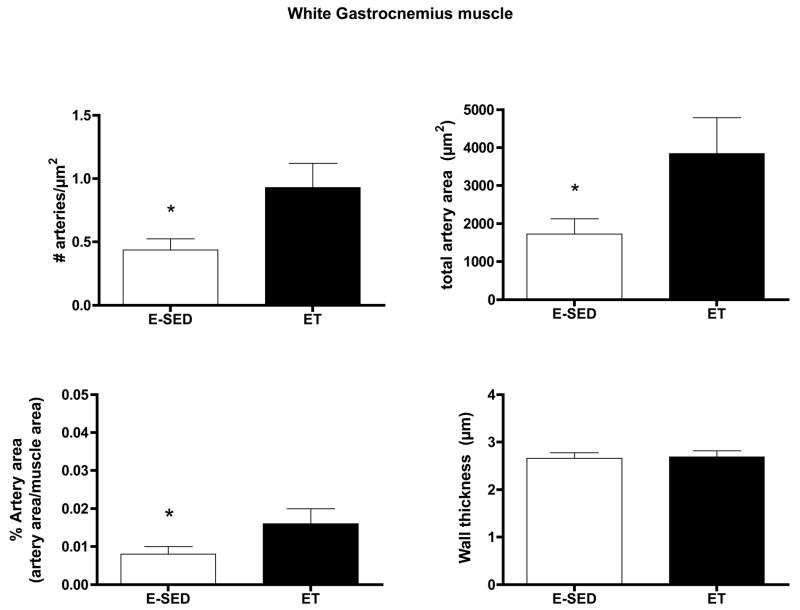
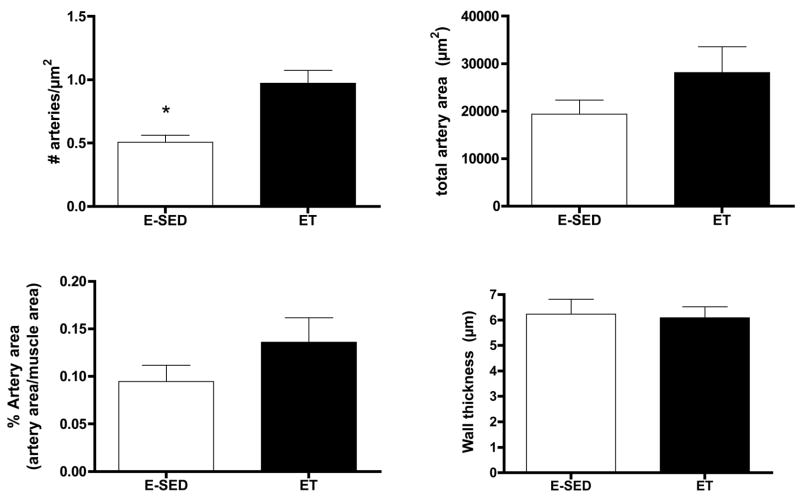
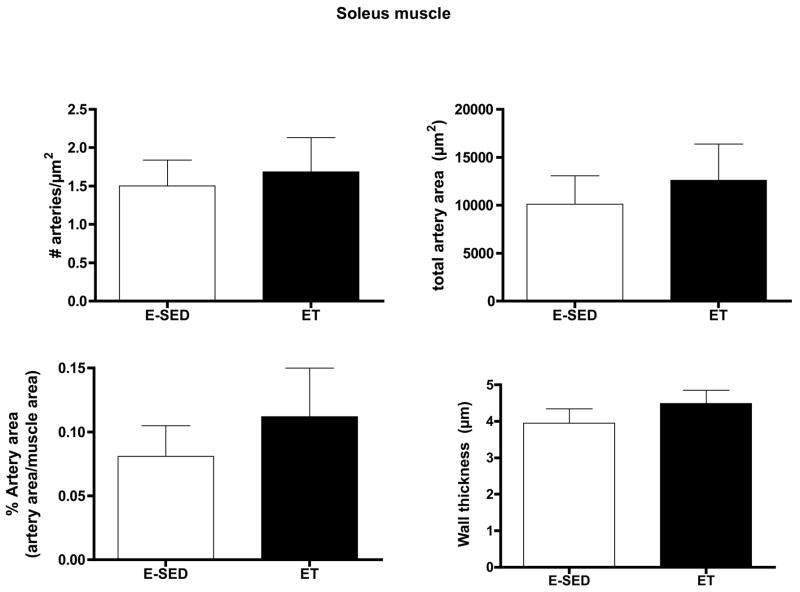
Results reveal that ET increased arteriolar density above values of sedentary rats (SED) in both the Gw (ET = 0.93 ± 0.19 arterioles/μm2; SED = 0.44 ± 0.09 arterioles/μm2) and Gr (ET = 0.97 ± 0.1 arterioles/μm2; SED = 0.51 ± 0.06 arterioles/μm2) muscles, but not in S (ET = 1.69 ± 0.45 arterioles/μm2; SED = 1.51 ± 0.34 arterioles/μm2) muscle. In contrast, IST did not alter arteriolar density in Gw or Gr muscle tissue. Although arterial wall thickness was greater in S (3.95 ± 0.40 μm) and Gr (6.24 ± 0.59 μm) than Gw (2.76 ± 0.18 μm), neither ET or IST altered mean wall thickness in either muscle.
Conclusion
Increases in blood flow capacity produced in Gr, and Gw by ET appear to be due in part to increased arteriolar density. In contrast, increased arteriolar density does not contribute to increased blood flow capacity of Gw in IST rats.
Keywords: blood flow, capacity, vascular remodeling, exercise
Exercise training improves cardiovascular function and increases vascular transport capacity of skeletal muscle (9, 10, 42). The ability of exercise training to augment blood flow to contracting skeletal muscles is a fundamental adaption to exercise training. Given the importance of increased skeletal muscle blood flow capacity, it is surprising that the mechanisms responsible for training-induced increases in blood flow are not well understood. Understanding this adaptation in intact subjects requires integration of knowledge about skeletal muscle fiber type composition, muscle fiber recruitment patterns during exercise, distribution of blood flow within and among muscles, and anatomy of skeletal muscle vascular beds. Muscle fiber type composition appears to impart fundamental differences in the biological strategy for vascular adaptation in skeletal muscle (34, 36).
Skeletal muscle is a complex tissue composed of fibers that can be grouped into 3 general phenotypes based on their contractile and metabolic properties (43): Slow-twitch oxidative (SO) fibers, Fast-twitch, glycolytic (FG) fibers, and Fast-twitch, oxidative, glycolytic (FOG). The remarkable matching of vascular structure and function to muscle fiber characteristics, within skeletal muscle, has been demonstrated for a number of mammalian species, ranging from rat to man (2, 16, 32, 43). The influence of muscle fiber type composition on vascular function in skeletal muscle and the relationships among muscle fiber type, oxidative capacity, vascularization, capillary exchange capacity, mechanisms of vascular control, muscle fiber recruitment patterns during exercise, and regional distribution of blood flow within and among muscles during exercise are well recognized (3–8, 11, 20, 24–32, 37, 38, 48, 49). During an acute bout of exercise the increase in muscle blood flow: 1) is distributed heterogeneously within and among skeletal muscles (26, 30, 32), 2) is related to muscle fiber type and muscle fiber recruitment patterns (25–27, 30, 32) and 3) changes within and among muscles over time during sustained submaximal exercise, due to changes in muscle fiber recruitment patterns (12, 25–27, 29, 30, 32). We have established that chronic exercise training modifies the relationships among fiber type, recruitment patterns and exercise muscle blood flow (7, 31, 45) due to training-induced increases in blood flow capacity that are concentrated in the muscle tissue having the greatest increase in activity during each training session (7, 14, 15, 31, 35, 44, 45).
Integration of current evidence indicates that training-induced vascular adaptation alters the determinants of skeletal muscle vascular resistance by at least two primary mechanisms: 1) Altered vasomotor reactivity of arteries and arterioles and 2) Structural remodeling of the arterial tree. A number of studies demonstrate that exercise hyperemia in skeletal muscle is altered by exercise training (7, 21, 22, 30). Recent evidence suggests that changes in control of vascular resistance contribute only modestly to increased blood flow capacity in skeletal muscle (34, 36). These results led us to focus on the role of structural remodeling of the microvascular arterial network plays in increases in blood flow capacity.
It seems reasonable to propose that muscle fiber-type interacts with fiber recruitment patterns during exercise so that the distribution of adaptive changes induced by training vary with the type of training preformed. For example, high intensity exercise (high speed, uphill running) has been shown to produce the greatest relative increase in contractile activity in fast-twitch, white skeletal muscle, like the white portion of the gastrocnemius muscle (13)(26). Following interval sprint training (IST), white gastrocnemius muscle exhibits the largest relative increase in oxidative capacity (13), capillary density (15) and blood flow capacity (31, 44, 45). In contrast, endurance exercise training (ET) has been shown to produce the greatest relative increase in contractile activity in the soleus (S) and red portion of the gastrocnemius muscle (Gr). Importantly, the Gr muscle also exhibits the largest relative increase in oxidative capacity (13), capillary density (15) and blood flow capacity of the extensor muscles examined in rats following endurance exercise training (31, 44, 45). We previously tested the hypothesis that changes in blood flow capacity result from changes in capillarity within and among muscles (14, 15). Although we found that capillarity increases in the soleus and red portion of the gastrocnemius muscles in EX rats and that capillarity is increased only in the white portion of the gastrocnemius muscle in IST rats (14, 15), the limited magnitude of these changes indicate that increases in blood flow capacity of in these muscle tissues following EX and IST training are not mediated solely by increased capillarization (15, 45). Given these observations, the purpose of this study is to test the hypothesis that changes in arteriolar density (number of arterioles/mm2) contribute to regional increases in blood flow capacity in soleus muscle and within the gastrocnemius muscle and that exercise training induces increases in arteriolar density in muscle tissue with the greatest relative increase in fiber activity during training bouts. Thus, our hypothesis was that ET would increase arteriolar density in soleus and red gastrocnemius and that IST would increase arteriolar density in the white portion of gastrocnemius muscle.
METHODS
Animals
Male Sprague-Dawley rats (weight 441±7g) were obtained from Harlan Inc. in groups of 25. Rats are ideal for these studies due to the fact that the different types of skeletal muscle fibers are distributed in a highly stratified manner throughout their limbs. This makes possible the analysis of relationships with muscle fiber type composition of muscle. Veterinary care was provided by the Office of Animal Resources (OAR) and the College of Veterinary Medicine faculty at the University of Missouri. Animals are observed daily by the OAR staff. Animals were housed in pairs in temperature (24 °C) and light (12:12 hour light:dark) controlled rooms. Rat chow and water were available ad libitum. Treadmill training was performed by highly motivated veterinary or pre-veterinary students who insured that the rats receive proper care. All procedures were conducted and all animal care fulfilled the Principles for Use of Animals and the Guide for the Care and Use of Laboratory Animals as approved by the Institutional Animal Care and Use Committee of the University of Missouri.
Experimental Design
We used two different training programs that concentrate increased fiber activity during exercise to different areas of the gastrocnemius muscle tissue: 1) Endurance training (ET), which increases activity in high-oxidative muscle tissue (FOG and SO) of red gastrocnemius and 2) Interval sprint training (IST), which increases activity in low-oxidative (FG) white gastrocnemius muscle tissue. Because our hypothesis is that the patterns of structural vascular adaptation are not the same in these two types of exercise training, we compared and contrasted regional changes in arteriolar density of these two different training programs to reveal and differentiate patterns of adaptation within the gastrocnemius muscle. Our hypothesis was that exercise training induces increases in arteriolar density in skeletal muscle tissue with the greatest increase in activity during training bouts.
We used sets of four (4) groups of 10 rats: ET, endurance sedentary (E-SED), IST and IST sedentary (I-SED). At the end of the training programs the rats were anesthetized and the muscle tissue was perfusion fixed and the tissue analyzed for arteriolar density as described below.
Endurance Training Program
Over a 10 wk period rats were trained on the treadmill using a program modified after Dudley et al. (13) as described by Hood and Terjung (17). This training program has been demonstrated to produce approximately 50 % increases in oxidative capacity in high oxidative extensor muscles (13). One to two wks following delivery from the breeder, 25 rats began to run for 5–10 mins, 5 days/wk at a speed of 30 m/min, 0 incline. After 1 wk the 5 rats that did not easily adapt to treadmill exercise were removed from the study. The remaining rats were randomly divided into 2 groups of 10 rats. The E-SED group was restricted to their cages and placed on the treadmill with no exercise 5 days/wk while the ET group continued the training program. The duration of running and treadmill grade were increased gradually until by 3–4 wks the rats ran at 30 m/min, up a 15 % grade, for 60 min, 5 days/wk. The ET rats continued training at this intensity until the time of study (total training time of 10–12 wks).
Interval-Sprint Training Program
One to two wks following delivery from the breeder, 25 rats began to run for 5–10, 5 days/wk at a speed of 30 m/min, 0 incline. After 2 wks the 5 rats that did not easily adapt to treadmill exercise were removed from the study. The remaining rats were randomly divided into 2 groups of 10 rats. The I-SED group was restricted to cages while the other IST group continued the training program. The duration of running and treadmill grade are gradually increased until by 3–4 wks the rats were able to run 6 alternating bouts of 2.5 min running, at 60 m/min, up a 15 % grade, and 4.5 min rest between bouts, 5 days/wk. The IST rats continued training at this intensity until the time of study (total training time of 10–12 wks). This training program has been demonstrated to produce approximately 50 % increases in oxidative capacity, increased blood flow capacity and increased capillarity in FG extensor muscles (15, 31, 44, 45).
Citrate synthase assay
After euthanasia, samples of white, red portions of the vastus lateralis muscle, the vastus intermedius muscle were sampled. Muscle samples were frozen in liquid N2 and stored at −70 °C until processed. Citrate synthase activity was measured from whole muscle homogenate using the spectrophotometric method of Srere (47).
Fixation and Specimen Processing for Histological analysis
The hindlimb muscle of rats were prepared and collected for measurements of arteriolar density. The limbs were fixed at a 90 degree angle at the ankle. The rat hindquarters were prepared and one iliac artery perfused with 20 mls of heparinized saline at a pressure of 150 mmHg followed by infusion of saline/Lidocaine (0.88 ug/g) (31, 33). Arterial pressure was monitored from a side branch. Formalin was then perfused through the tissue for 3 hrs or until 150 ml of formalin had passed through the muscle tissue. Perfusion pressure during fixation was maintained at approximately 100 mmHg pressure. After fixation the soleus and gastrocnemius muscles were removed and sliced at mid-belly orthogonal to the long axis. After dehydration through a graded series of alcohol washes, tissues were embedded in paraffin. Five μm sections were cut with an automated microtome (Microm), floated onto positively charged slides (Fischer), and stained with standard hematoxylin and eosin and Verhoeff’s elastic stain (41) to define internal elastic lamina of the larger arteries and veins.
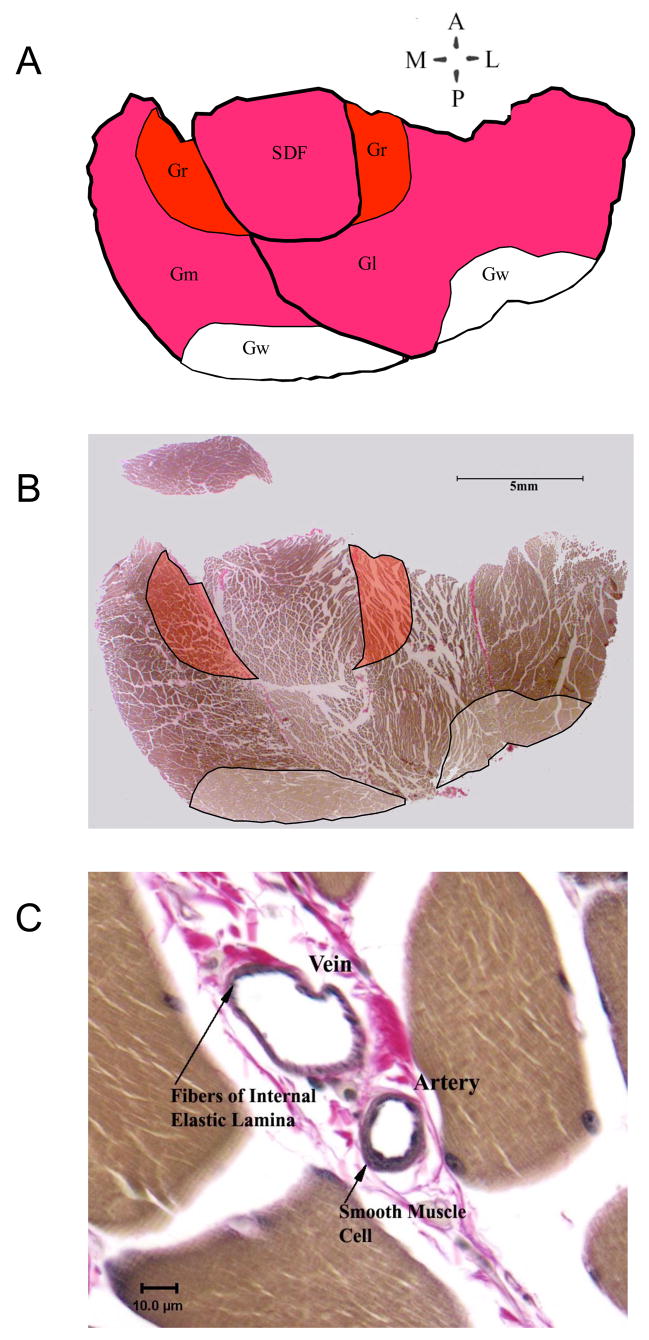
The areas for red (Gr), mixed (Gm), and white (Gw) portions of the gastrocnemius muscle were determined using published criteria and direct visualization of the white portions of the cross-section as illustrated in figure 1A and B. The entire cross section of soleus was examined. For each artery in the area of study, inner, outer, diameter and wall thickness were measured using the Spot Imaging software with a Spot Insight color digital camera mounted on an Olympus B-Max 60 light microscope. The area of tissue analyzed was measured with Image-Pro Plus software and arteriolar density (number/mm2), percentage artery area, and total artery area were calculated. Arteries were evaluated at 400X. Vessels larger than 8μm with smooth muscle layers were considered to be arteries, arterioles, veins and venules. Differentiation of arteries and veins was made on the basis of a number of factors including presence of internal elastic lamina and smooth muscle in the wall. Vessels without elastic interna and with smooth muscle present in the wall, that could not be differentiated by this method, were classified as arteries and veins on the basis of the ratio of wall thickness/lumen diameter with the smaller ratios characteristic of veins as shown in figure 1C. Arterial numerical, volume and length densities were calculated. In addition arteries were divided into categories by size (internal diameters) including >25μm, 20 to 25, 16 to 20 μm, 12 to 16 μm, 8 to 12 μm, and 6 to 8 μm. We assumed that vessels are cylindrical in transverse section. Arteriolar density was not measured in soleus muscle from IST rats because previous results indicate that IST does not alter oxidative capacity, blood flow capacity, or capillarity of the soleus muscle (13)(15)(31, 44, 45).
Figure 1.
Illustration of approach to data collection. A. Tracing of image B showing relative positions of Medial and Lateral heads of the gastrocnemius muscle (GM and GI), Superficial Digital Flexor (SDF), and white and red portions of gastrocnemius (GW and GR). B. Slide image showing typical sample area for data collection frm GR and Gw. C. Data, image of analyzed artery with vein showing difference between wall to lumen relationship of vein and artery.
Data Analysis and Statistics
A one way analysis of variance was used to compare various parameters within muscles or tissues across conditions and to compare a parameter (arteriolar diameter, arteriolar density, or wall thickness) across muscles. Differences among treatment means were evaluated with Duncan’s new multiple-range test as described previously (3–8, 11, 20, 24–32, 37, 38, 48, 49). A multivariate analysis was used to compare means across muscles for different groups. Differences will be considered significant when p < 0.05.
RESULTS
Efficacy of Exercise Training
Both ET (422 ± 7 g) and IST (389 ± 5 g) rats had body weights smaller than E-SED (498 ± 5 g) and I-SED (431 ± 9 g) rats. Heart weights of ET (1.42 ± 0.07 g), IST (1.44 ± 0.07 g), E-SED (1.43 ± 0.04 g), I-SED (1.43 ± 0.04 g) rats were similar whereas heart weight/body weight ratios were increased in both ET (3.16 ± 0.05 g/kg) and IST (3.70 ± 0.15 g/kg) compared to their respective sedentary values (E-SED = 3.04 ± 0.16 g/kg, and I-SED = 3.31 ± 0.09 g/kg, SED). Oxidative capacity of the red portion of the vastus lateralis and the vastus intermedius muscle were increased in ET rats while there was no significant change in the white portion of the vastus lateralis. In contrast, oxidative capacity of both the red and white portions of the vastus lateralis muscle was significantly greater in the IST rats compared to I-SED values while there was no significant change in the oxidative capacity of the vastus intermedius muscle of IST rats. These results indicate that both ET and IST rats underwent the expected adaptations to this training program (15, 31, 44, 45).
Arteriolar Density after Endurance Training
Endurance training increased arteriolar density in both the Gw and Gr (Figs. 2–3). In the soleus muscle arteriolar density was only increased 12 % and this increase did not attain statistical significance (Fig 4). Only arteriolar density was increased in the Gr (Fig 3) and arteriolar density, mean arteriolar area, and total arteriolar area were increased in Gw of ET rats (Fig 2). Although arterial wall thickness was greater in S and Gr than Gw, endurance training did not alter wall thickness in any muscle tissue examined.
Figure 2.
Effects of endurance training (ET) on arteriolar density of white gastrocnemius muscle. Values are means ± SEM. n = 9 for ET and 10 for E-SED. * = ET value significantly different from E-SED with p < 0.05.
Figure 3.
Effects of endurance training (ET) on arteriolar density of red gastrocnemius muscle. Values are means ± SEM. n = 17 for ET and 18 for E-SED. * = ET value significantly different from E-SED with p < 0.05.
Figure 4.
Effects of endurance training (ET) on arteriolar density of soleus muscle. Values are means ± SEM. n = 9 for ET and 10 for E-SED. There were no statistically significant differences between ET and E-SED with p < 0.05.
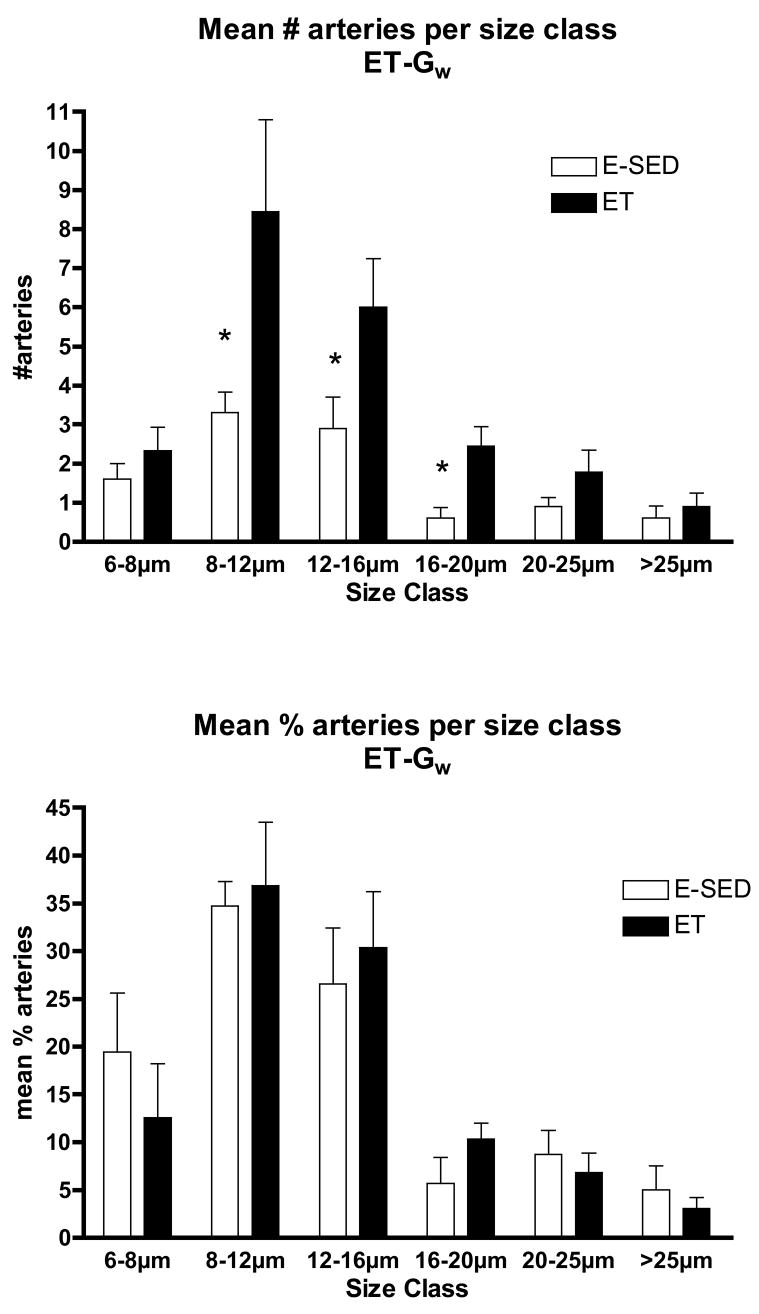
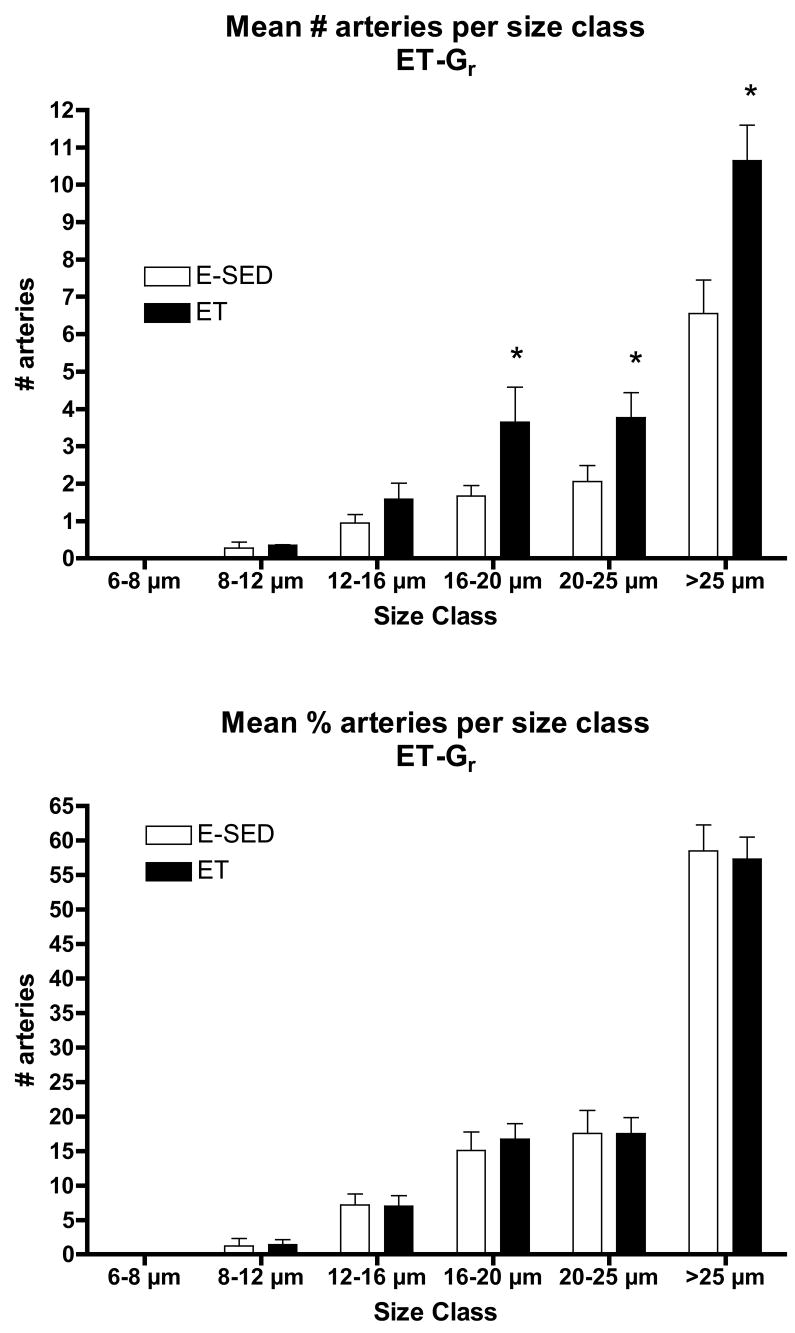
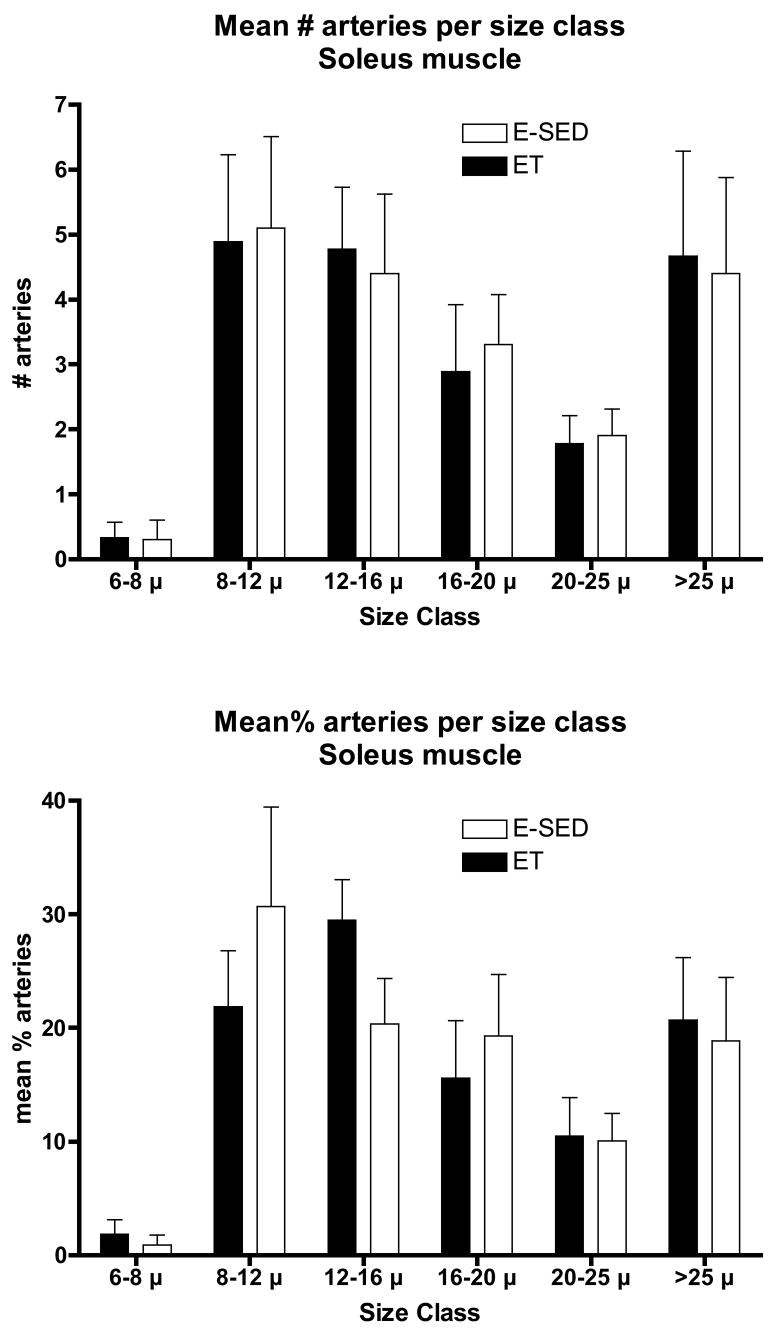
The increase in arteriolar density in Gw caused by ET appeared to be the result of an increase in the number of arterioles in the size range of 8–20 μm diameters, not in the smallest arterioles or arterioles larger than 25 μm (Fig 5). In contrast, in Gr muscle tissue, the increase in arteriolar density with ET was the result of an increase in the number of arterioles of larger diameter (16 to > 25 μm diameter) (Fig 6). Although Gw tended to have a greater percentage of small arterioles than does Gr muscle, the % of arterioles in the 6 size ranges were not significantly altered by endurance training (Figs. 5 & 6). ET did not alter the density of any size arteriole examined in the soleus muscle (Fig 7). Of interest, the soleus seemed to have a small % of arterioles in the 6–8 μm diameter size and then a relatively uniform distribution of arteriole size from 8 to 25 μm diameter (Fig 7).
Figure 5.
Arteriolar density of arterioles with different diameters (top panel) in the white gastrocnemius muscle (Gw) following endurance exercise training (ET) and percentage of arterioles in given size range (bottom panel). Values are means ± SEM. * = ET value significantly different from E-SED with p < 0.05.
Figure 6.
Arteriolar density of arterioles with different diameters (top panel) in the red gastrocnemius muscle (Gr) following endurance exercise training (ET) and percentage of arterioles in given size range (bottom panel). Values are means ± SEM. * = ET value significantly different from E-SED with p < 0.05.
Figure 7.
Arteriolar density of arterioles with different diameters (top panel) in the soleus muscle following endurance exercise training (ET) and percentage of arterioles in given size range (bottom panel). Values are means ± SEM. There were no statistically significant differences between ET and E-SED with p < 0.05.
Arteriolar Density after Interval Sprint Training
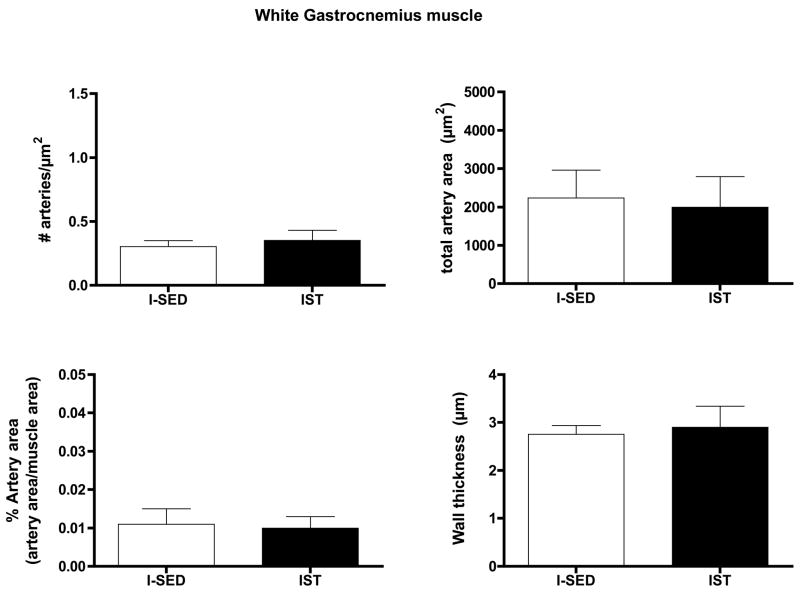
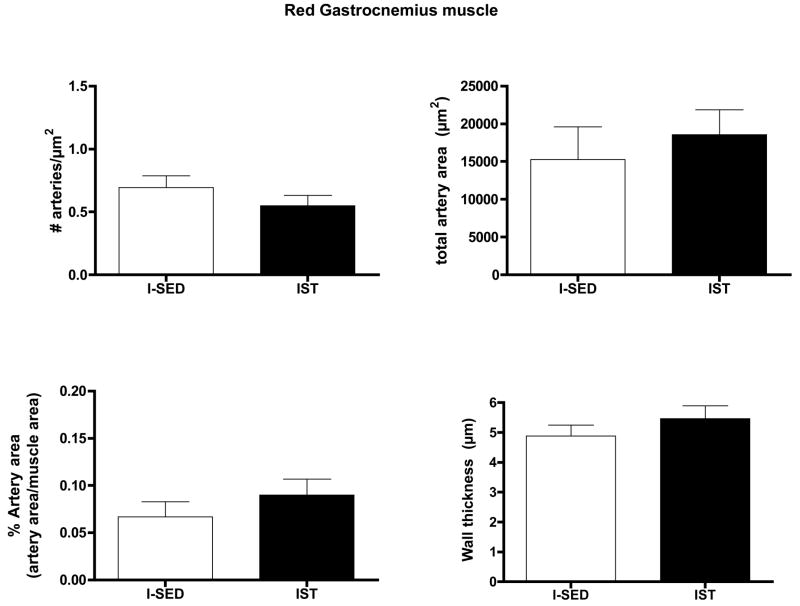
IST did not alter arteriolar density, % artery area, total artery area, or wall thickness in either the Gw or Gr muscle tissue (Figs. 8 and 9). IST did not significantly alter the number of arterioles in any size range examined in either Gw or Gr muscle (Data not shown).
Figure 8.
Effects of interval sprint training (IST) on arteriolar density of white gastrocnemius muscle. Values are means ± SEM. n = 12 for IST and 15 for I-SED. There were no statistically significant differences between IST and I-SED for any of these parameters (p < 0.05).
Figure 9.
Effects of interval sprint training (IST) on arteriolar density of red gastrocnemius muscle. Values are means ± SEM. n = 13 for IST and 14 for I-SED. There were no statistically significant differences between IST and I-SED for any of these parameters (p < 0.05).
Discussion
The results of this study reveal that endurance exercise training stimulates increased arteriolar density in both red and white portions of the gastrocnemius muscle. The increase in arteriolar density of Gw was focused in the smaller arterioles (diameters of 8–20 μms) where as in the red potion of the gastrocnemius muscle the increases were seen in arterioles greater than 16 μm diameter. In Gw muscle 60 to 70 % of arterioles were of 8 to 16 μms in diameter where as in Gr muscle, 60 % of the arterioles were larger than 25 μms in diameter. Of interest, the relative percentage of arterioles in each size category remained the same in both Gw and Gr muscle of E-SED and ET rats (Figures 5 and 6). This suggests that arteriolar growth occurs in a manner that preserves the distribution of arteriolar size in the arteriolar networks of both Gw and Gr during remodeling of the arteriolar network in response to ET. This suggests that this network feature of the arteriolar tree in these two kinds of muscle tissue is important. In contrast to these effects of endurance training, interval sprint training did not alter mean arteriolar density or the density of any size of arterioles, in either portion of the gastrocnemius muscle. Our hypothesis was that exercise training induces increases in arteriolar density in muscle tissue with the greatest relative increase in fiber activity during training bouts so that endurance exercise training would produce increases in arteriolar density in S and Gr and that interval sprint training would increase arteriolar density in the white portion of gastrocnemius. Results only partially support our hypothesis. To put these data in context it is important to consider what is known about training induced changes in blood flow capacity and skeletal muscle capillary beds in these tissues.
Exercise Training Induces Non-uniformly Distributed Capillary Angiogenesis
Previous results indicate that exercise training-induced angiogenesis of capillaries within and among skeletal muscles of rats is greatest in the muscle tissue with the greatest relative increase in fiber activity during training bouts as are the regional increases in oxidative capacity (1, 13–15, 23, 31, 44, 45). Our detailed analysis of three different types of exercise training on capillarity in different regions of the gastrocnemius muscle and soleus muscle revealed that exercise training-induced adaptations of capillary supply and mitochondrial content are spatially coupled in the gastrocnemius muscle so that the regions that exhibit increased oxidative capacity also exhibit increased capillarity (14, 15). Thus, capillary supply is increased in Gr but not in Gw by endurance training where as capillary supply is only increased in Gw by IST. While these adaptations of blood flow capacity, capillary supply and oxidative capacity are coupled spatially within and among muscles, the magnitude of adaptations are not tightly coupled. For example, oxidative capacity is increased nearly 3 fold by IST in Gw whereas blood flow capacity is only increased 2 fold and capillary supply by 20 % (1, 13–15, 23, 31, 44, 45).
Exercise Training Induces Non-uniform Changes in Regional Blood Flow Capacity
Exercise training-induced adaptive changes in blood flow capacity also appear to be coupled to changes in muscle oxidative capacity in the gastrocnemius muscle but not in the soleus muscle (15, 23, 31). Indeed, results indicate that, blood flow capacity does not appear to be consistently coupled to capillarity or mitochondrial content within and among skeletal muscle (14, 15, 23, 31, 44, 45). For example, ET produces a nearly 2 fold increase in blood flow capacity of S muscle while capillary/fiber ratio is not altered. Importantly, results also indicate that increases in blood flow capacity can not be fully explained from changes in capillarity or known changes in control of vascular resistance (14, 15, 23, 31, 44, 45). These previous observations suggest that training-induced arteriogenesis and/or remodeling may play important roles in the increases in blood flow capacity (14, 15, 23, 31, 44, 45). Present results indicate that increased arteriolar density stimulated by endurance exercise training could play a role in the increases in blood flow capacity in both red and white portions of the gastrocnemius muscle but not soleus muscle. These data are not consistent with our hypothesis that the greatest increase in arteriolar density would occur in the S and Gr muscle tissue as endurance training doubled arteriolar density in both Gr and Gw muscle and did not alter it is S (Figs 2–4). In contrast to the similar increase in arteriolar density of Gr and Gw seen with endurance training in the present study, Gute et al. (14) reported that endurance training increased capillary density by 50 % in Gw muscle and by 27 % in Gr muscle. Thus, endurance training appears to increase both arteriolar and capillary density throughout the gastrocnemius muscle and the increase in arteriolar density is not greater in the Gr than Gw. In contrast, available results indicate that endurance exercise training increases soleus blood flow capacity with out altering arteriolar density or capillarity. Given these results, the report that endurance training produces greater increases in Gr blood flow capacity than in Gw suggests that adaptations in vasomotor control of resistance may be a major influence in increased blood flow capacity of Gr with ET (33). This conclusion is consistent with results from McAllister et al (36) demonstrating that endurance training increased endothelium-dependent dilation in fast-twitch, oxidative, glycolytic skeletal muscle. This combined with increases in arteriolar density (present results) and capillary density (14, 15) In Gr produce increase blood flow capacity in Gr and Gm muscle (23, 45).
Our hypothesis was that IST would result in increased arteriolar density in Gw muscle. This hypothesis was based on reported increases in blood flow capacity (31) and capillary density in Gw muscle of IST rats (14). Present results indicate that IST did not alter arteriolar density in either Gw or Gr, counter to our hypothesis. These results suggest that the increase in blood flow capacity in Gw produced by IST is the result of increased capillary density (14) and increased dilator capacity of the resistance arteries that provide blood flow to this tissue (34). As above, this result is consistent with recent results demonstrating that IST produced increased endothelium-dependent dilation in Gw muscle (34).
Exercise Training Induces Non-uniform Changes in Control of Vascular Resistance
We recently examined the effects of ET and IST on endothelium-dependent dilation and endothelial phenotype of arteries perfusing gastrocnemius and soleus muscles of rats (34, 36). In both studies we found that the distribution of training-induced adaptations of endothelial function in the arteries that perfuse Gw were dramatically different following IST (34) and endurance training (36). After IST, endothelial function, eNOS expression, and smooth muscle function were altered in some arteries (34) but the adaptations were distributed non-uniformly. Endothelium-dependent dilation stimulated by acetylcholine (ACh) was increased specifically in Gw muscle (34). Similarly, ACh-induced dilation was enhanced in Gw 2A arterioles not Gr 2As. Further, in Gw 2As and 3As spontaneous tone, and sensitivity to stretch, phenylephrine, and sodium nitroprusside were not altered by IST. Some arterioles in Gw muscle and the gastrocnemius feed artery exhibited increased eNOS content (34).
In contrast to these result in IST rats, endurance trained rats exhibited increased ACh-induced dilation in Gr and mixed portions of the gastrocnemius, not in the S or Gw (36). ET did not alter ACh-induced dilation is isolated arterioles from S, Gr, or Gw but flow-induced dilation was increased in 2A arterioles from Gr. The eNOS content of 2A, 4A, and 5A arterioles from Gr muscle was increased by ET where as eNOS content was not altered in arterioles from Gw muscle (36). A key observation of both of these studies is that changes in vasodilator and vasoconstrictor properties of resistance arteries and arterioles in the arteriolar trees of the gastrocnemius muscle are altered, non-uniformly by both ET and IST (34, 36). These studies demonstrate that the effects of training on endothelium and smooth muscle of skeletal muscle arterial trees are non-uniform.
Caveats and Experimental Problems
The morphometric approach used in this study focuses attention on arteriolar density of the small arterioles. Larger arterioles rarely appeared in the tissue sections. Thus, our results do not allow conclusions about the effects of training on resistance arteries and arterioles of diameters larger than 50 μm diameter. Available information does not indicate that endurance training alters the size of larger arterioles in soleus muscle as Jasperse and Laughlin reported that ET did not alter the number or diameters of soleus feed arteries (18), McAllister et al. reported that ET did not alter diameters of soleus 1A arterioles (36), and Spier et al. reported that ET did not alter diameter of soleus muscle arterioles (46). These results do not indicate that soleus arterioles can not be remodeled as Jasperse et al. reported that inactivity for 2 weeks results in significant decreases in soleus feed artery diameters (19). In gastrocnemius muscle, there is evidence of structural adaptation in larger resistance arteries with both types of training. For example, we reported that 3A arterioles in Gw muscle of IST rats were significantly larger in diameter (96 ± 8 μm) than those from SED rats (73 ± 4 μm) (34). Also, rats McAllister et al. reported that 1A arterioles (which provide blood to both Gr and Gw muscle) were larger in diameter (257 ± 10 μm) in ET rats than 1A arterioles from SED rats (224 ± 5 μm) and Spier er al. reported similar increases in diameter of 1A arterioles in the lateral head of the gastrocnemius muscle from ET rats (46). Although 1A and 2A gastrocnemius arterioles tended to be of larger diameter in ET in our previous study, the differences were not significant (34). Thus, we conclude that available evidence suggests that, even in these larger resistance arteries and arterioles exercise training-induced structural adaptation in skeletal muscle arteriolar trees occurs in a non-uniform manner. A different technical approach will be required to fully address the question of the effects of training on the larger arterioles in these muscle tissues.
We did not anticipate that adaptations in arteriolar density would not reflect reported adaptations of capillary density (14, 15) in these muscles. The different spatial patterns of adaptation of capillarity and arteriolar density in skeletal muscle suggests that exercise-induced stimuli for arterial remodeling (functional and/or structural) are different than those for capillary angiogenesis. There is considerable evidence that, in rat skeletal muscle, the anatomical processes by which new capillaries form (sprouting and/or intussusception) are substantially different than the process by which new arterioles form. Indeed, Price and Skalak (39, 40) have shown that during normal maturation and in response to chronic prazosin treatment, new arterioles form when capillaries become invested with smooth muscle. However, the role of “capillary arterialization” in vascular adaptation induced by exercise training in skeletal muscle has not been established. Present results do not reveal mechanisms responsible for the spacial differences in structural vascular adaptation associated with different types of exercise.
Understanding the different strategies for vascular adaptation in skeletal muscle composed of different fiber types requires an appreciation of changes in arterialization and arteriolar density produced by training. Present results indicate that increased arteriolar density in high-oxidative and low-oxidative fast muscle (gastrocnemius) contributes importantly to increased blood flow capacity in endurance training but not IST. Thus, current results support the hypothesis that increases in blood flow capacity in gastrocnemius muscle are the result of a mixture of increased arteriolar density, increased capillarity, and changes in control of resistance (14, 15, 23, 31, 44, 45).
In conclusion, as we entered into these experiments we conceived that the biologic strategy for vascular adaptation to training involved a mixture of angiogenesis of arteries, capillaries and veins and altered control of vascular resistance in skeletal muscle tissue undergoing adaptation. Our results indicate that fiber recruitment patterns during exercise and muscle fiber type composition interact with exercise intensity/duration to provide graded adaptations through each of these mechanisms within the arterial tree of skeletal muscle. In the light of these results it seems possible that each type of skeletal muscle (fast red, fast white, slow) can adapt via graded changes in capillarity, arteriolar density, and vascular control processes (14, 15, 30, 31, 33, 44, 45). At this time the biological strategies of the adaptations produced in response to altered activity in skeletal muscle of different phenotypes can only be partially characterized.
Table 1.
Body weights, heart weights and citrate synthase activity of muscles in the 4 groups of rats.
| Variable | ET (n = 18) | E-SED (n = 18) | IST (n = 14) | I-SED (n = 23) |
|---|---|---|---|---|
| Body Weight, grams | *423 ± 7 | 499 ± 5 | *389 ± 5 | 432 ± 9 |
| Heart Weight, grams | 1.42 ± 0.07 | 1.43 ± 0.04 | 1.44 ± 0.07 | 1.43 ± 0.04 |
| HW/BW, g/kg | *3.16 ± 0.05 | 3.04 ± 0.16 | *3.70 ± 0.15 | 3.31 ± 0.09 |
| CS activity, (μmol/min/g) | ||||
| Vastus Lateralis, red | *59.4 ± 2.4 | 39.1 ± 3.0 | * 44.0 ± 5.3 | 24.1 ± 2.5 |
| Vastus Lateralis, white | 12.4 ± 0.8 | 10.9 ± 0.6 | *13.1 ± 5.3 | 8.2 ± 0.5 |
| Vastus Intermedius | *52.9 ± 2.0 | 40.4 ± 1.1 | 37.4 ± 5.9 | 36.1 ± 0.5 |
Values are means ± SE. n = number of rats. ET = endurance trained. E-SED = sedentary group for ET. IST = interval sprint trained. I-SED = IST sedentary group. HW/BW = heart weight/body weight ratio. CS = citrate synthase.
= the ET or IST value is statistically different from respective E-SED or I-SED value with p<0.05.
Acknowledgments
The authors gratefully acknowledge the expert technical assistance of Pam Thorne, Denise Holiman, Jennifer Casati, Tammy Strawn, and Beth DeGarmo.
This work was supported by National Heart, Lung, and Blood Institute Grant HL-36088.
References
- 1.Adair TH, Gay WJ, Montani JP. Growth regulation of the vascular system: evidence for a metabolic hypothesis. American Journal of Physiology. 1990;259:393–404. doi: 10.1152/ajpregu.1990.259.3.R393. [DOI] [PubMed] [Google Scholar]
- 2.Armstrong RB. Properties, distribution, and functions of mammalian skeletal muscle fibers. In: Cerretelli P, Whipp BJ, editors. Exercise bioenergetics and gas exchange. Elsevier/North-Holland Biomedical Press; 1996. pp. 137–146. [Google Scholar]
- 3.Armstrong RB, Delp MD, Goljan EF, Laughlin MH. Distribution of blood flow in muscles of miniature swine during exercise. J Appl Physiol. 1987;62:1285–1298. doi: 10.1152/jappl.1987.62.3.1285. [DOI] [PubMed] [Google Scholar]
- 4.Armstrong RB, Delp MD, Laughlin MH. Progressive elevations in muscle blood flow during prolonged exercise in swine. Journal of Applied Physiology. 1987;63:285–291. doi: 10.1152/jappl.1987.63.1.285. [DOI] [PubMed] [Google Scholar]
- 5.Armstrong RB, Laughlin MH. Atropine: No effect on anticipatory or exercise muscle hyperemia in conscious rats. J Appl Physiol. 1986;61:679–692. doi: 10.1152/jappl.1986.61.2.679. [DOI] [PubMed] [Google Scholar]
- 6.Armstrong RB, Laughlin MH. Blood flows within and among rat muscles as a function of time during high speed treadmill exercise. Journal of Physiology May. 1983:187–208. doi: 10.1113/jphysiol.1983.sp014933. [DOI] [PMC free article] [PubMed] [Google Scholar]
- 7.Armstrong RB, Laughlin MH. Exercise blood flow patterns within and among rat muscles after training. American Journal of Physiology. 1984;246:H59–H68. doi: 10.1152/ajpheart.1984.246.1.H59. [DOI] [PubMed] [Google Scholar]
- 8.Armstrong RB, Vandenakker CB, Laughlin MH. Muscle blood flow patterns during exercise in partially curarized rats. Journal of Applied Physiology. 1985;58:698–701. doi: 10.1152/jappl.1985.58.3.698. [DOI] [PubMed] [Google Scholar]
- 9.Bevegard BS, Shepherd JT. Reaction in man of resistance and capacity vessels in forearm and hand to leg exercise. Journal of Applied Physiology. 1966;21:123–132. doi: 10.1152/jappl.1966.21.1.123. [DOI] [PubMed] [Google Scholar]
- 10.Clausen JP, Trap-Jensen J. Effects of training on the distribution of cardiac output in patients with coronary artery disease. Circulation. 1970;42:611–624. doi: 10.1161/01.cir.42.4.611. [DOI] [PubMed] [Google Scholar]
- 11.Delp MD. Differential effects of training on the control of skeletal muscle perfusion. Med Sci Sports Exerc. 1998;30:361–74. doi: 10.1097/00005768-199803000-00005. [DOI] [PubMed] [Google Scholar]
- 12.Delp MD, Laughlin MH, Armstrong RB. No relationship between progressive muscle hyperemia and temperature in rats. J Exptl Biol. 1989;141:87–95. doi: 10.1242/jeb.141.1.87. [DOI] [PubMed] [Google Scholar]
- 13.Dudley GA, Abraham WM, Terjung RL. Influence of exercise intensity and duration on biochemical adaptations in skeletal muscle. Journal of Applied Physiology. 1982;53:844–850. doi: 10.1152/jappl.1982.53.4.844. [DOI] [PubMed] [Google Scholar]
- 14.Gute D, Fraga C, Laughlin MH, Amann JF. Regional changes in capillary supply in skeletal muscle of high-intensity endurance-trained rats. Journal of Applied Physiology. 1996;81:619–626. doi: 10.1152/jappl.1996.81.2.619. [DOI] [PubMed] [Google Scholar]
- 15.Gute D, Laughlin MH, Amann JF. Regional changes in capillary supply in skeletal muscle of interval-sprint and low intensity, endurance trained rats. Microcirculation. 1994;1:183–193. doi: 10.3109/10739689409148273. [DOI] [PubMed] [Google Scholar]
- 16.Holloszy JO. Adaptations of muscular tissue to training. Progress in Cardiovascular Diseases. 1976;18:445–458. doi: 10.1016/0033-0620(76)90011-6. [DOI] [PubMed] [Google Scholar]
- 17.Hood DA, Terjung RL. Effect of endurance training on leucine metabolism in perfused rat skeletal muscle. American Journal of Physiology. 1987;253:E648–E656. doi: 10.1152/ajpendo.1987.253.6.E648. [DOI] [PubMed] [Google Scholar]
- 18.Jasperse JL, Laughlin MH. Vasomotor responses of soleus feed arteries from sedentary and exercise trained rats. J Appl Physiol. 1999;86:441–449. doi: 10.1152/jappl.1999.86.2.441. [DOI] [PubMed] [Google Scholar]
- 19.Jasperse JL, Woodman CR, Price EM, Hasser EM, Laughlin MH. Hindlimb unweighting decreases ecNOS gene expression and endothelium-dependent dilation in rat soleus feed arteries. J Appl Physiol. 1999;87:1476–1482. doi: 10.1152/jappl.1999.87.4.1476. [DOI] [PubMed] [Google Scholar]
- 20.Klabunde RE, Laughlin MH, Armstrong RB. Systemic adenosine deaminase administration does not reduce active hyperemia in running rats. Journal of Applied Physiology. 1988;64:108–114. doi: 10.1152/jappl.1988.64.1.108. [DOI] [PubMed] [Google Scholar]
- 21.Lash JM. Exercise training enhances adrenergic constriction and dilation in the rat spinotrapezius muscle. J Appl Physiol. 1998;85:168–74. doi: 10.1152/jappl.1998.85.1.168. [DOI] [PubMed] [Google Scholar]
- 22.Lash JM, Bohlen HG. Time-and order-dependent changes in functional and NO-mediated dilation during exercise training. Journal of Applied Physiology. 1997;82:460–468. doi: 10.1152/jappl.1997.82.2.460. [DOI] [PubMed] [Google Scholar]
- 23.Laughlin MH. Skeletal muscle blood flow capacity: role of muscle pump in exercise hyperemia. American Journal of Physiology. 1987;253:993–1004. doi: 10.1152/ajpheart.1987.253.5.H993. [DOI] [PubMed] [Google Scholar]
- 24.Laughlin MH, Armstrong RB. Adrenoreceptor effects on rat muscle blood flow during treadmill exercise. J Appl Physiol. 1987;62:1465–1472. doi: 10.1152/jappl.1987.62.4.1465. [DOI] [PubMed] [Google Scholar]
- 25.Laughlin MH, Armstrong RB. Muscle blood flow during locomotory exercise. Exerc Sport Sci Revs. 1985;13:95–136. [PubMed] [Google Scholar]
- 26.Laughlin MH, Armstrong RB. Muscular blood flow distribution patterns as a function of running speed in rats. Am J Physiol. 1982;243:H296–H306. doi: 10.1152/ajpheart.1982.243.2.H296. [DOI] [PubMed] [Google Scholar]
- 27.Laughlin MH, Armstrong RB. Rat muscle blood flow as a function of time during prolonged slow treadmill exercise. American Journal of Physiology. 1983;244:H814–H824. doi: 10.1152/ajpheart.1983.244.6.H814. [DOI] [PubMed] [Google Scholar]
- 28.Laughlin MH, Klabunde RE, Delp MD, Armstrong RB. Effects of dipyridamole on muscle blood flow in exercising miniature swine. American Journal of Physiology. 1989;257:H1507–H1515. doi: 10.1152/ajpheart.1989.257.5.H1507. [DOI] [PubMed] [Google Scholar]
- 29.Laughlin MH, Korthuis RJ. Control of muscle blood flow during sustained physiological exercise. Can J Spt Sci. 1987;12 [Google Scholar]
- 30.Laughlin MH, Korthuis RJ, Duncker DJ, Bache RJ. Control of blood flow to cardiac and skeletal muscle during exercise Chapter 16. American Physiological Society and Oxford University Press; New York: 1996. [Google Scholar]
- 31.Laughlin MH, Korthuis RJ, Sexton WL, Armstrong RB. Regional muscle blood flow capacity and exercise hyperemia in high intensity trained rats. Journal of Applied Physiology. 1988;64:2420–2427. doi: 10.1152/jappl.1988.64.6.2420. [DOI] [PubMed] [Google Scholar]
- 32.Laughlin MH, McAllister RM, Delp MD. Heterogeneity of blood flow in striated muscle. Raven Publishers; Philadelphia: 1997. pp. 1945–1955. [Google Scholar]
- 33.Laughlin MH, Ripperger J. Vascular transport capacity of hindlimb muscles of exercise-trained rats. J Appl Physiol. 1987;62:438–43. doi: 10.1152/jappl.1987.62.2.438. [DOI] [PubMed] [Google Scholar]
- 34.Laughlin MH, Woodman CR, Schrage WG, Gute D, Price EM. Interval sprint training enhances endothelial function and eNOS content in some arteries that perfuse white gastrocnemius muscle. J Appl Physiol. 2004;96:233–244. doi: 10.1152/japplphysiol.00105.2003. [DOI] [PubMed] [Google Scholar]
- 35.Mackie BG, Terjung RL. Blood flow to different skeletal muscle fiber types during contraction. American Journal of Physiology. 1983;245:265–275. doi: 10.1152/ajpheart.1983.245.2.H265. [DOI] [PubMed] [Google Scholar]
- 36.McAllister RM, Jasperse JL, Laughlin MH. Nonuniform effects of endurance exercise training on vasodilation in rat skeletal muscle. J Appl Physiol. 2005;98:753–761. doi: 10.1152/japplphysiol.01263.2003. [DOI] [PubMed] [Google Scholar]
- 37.Mohrman SJ, Peterson DF, Laughlin MH. Naloxone does not affect muscle blood flow during low intensity exercise in rats. Med Sci Sports Ex. 1988;21:34–39. doi: 10.1249/00005768-198902000-00007. [DOI] [PubMed] [Google Scholar]
- 38.Peterson DF, Armstrong RB, Laughlin MH. Sympathetic neural influences on muscle blood flow in rats during submaximal exercise. Journal of Applied Physiology. 1988;65:434–440. doi: 10.1152/jappl.1988.65.1.434. [DOI] [PubMed] [Google Scholar]
- 39.Price RJ, Owens GK, Skalak TC. Immunohistochemical identification of arteriolar development using markers of smooth muscle differentiation. Evidence that capillary arterialization proceeds from terminal arterioles. Circ Res. 1994;75:520–7. doi: 10.1161/01.res.75.3.520. [DOI] [PubMed] [Google Scholar]
- 40.Price RL, Thomas CS. Chronic α1-adrenergic blockade stimulates terminal and arcade arteriolar development. American Journal of Physiology. 1996;271:752–759. doi: 10.1152/ajpheart.1996.271.2.H752. [DOI] [PubMed] [Google Scholar]
- 41.Prophet EB, Mills B, Arrington JB, Sobin LH. Laboratory Methods in Histotechnology. American Registry of Pathology; Washington D.C: 1994. [Google Scholar]
- 42.Rowell LB. Human Cardiovascular Control. Oxford University Press; Oxford: 1993. [Google Scholar]
- 43.Saltin B, Gollnick PD. Skeletal muscle adaptability: significance for metabolism and performance. Handbook of Physiolgy: Skeletal Muscle Sect. 1977;10:555–631. [Google Scholar]
- 44.Sexton WL, Korthuis RJ, Laughlin MH. High intensity exercise training increases vascular transport capacity of rat hindquarters. American Journal of Physiology, Heart and Circulatory Physiology. 1988;254:H274–H278. doi: 10.1152/ajpheart.1988.254.2.H274. [DOI] [PubMed] [Google Scholar]
- 45.Sexton WL, Laughlin MH. Influence of endurance exercise training on distribution of vascular adaptations in rat skeletal muscle. American Journal of Physiology. 1994;266:H483–H490. doi: 10.1152/ajpheart.1994.266.2.H483. [DOI] [PubMed] [Google Scholar]
- 46.Spier SA, Delp MD, Meininger CJ, Donato AJ, Ramsey MW, Muller-Delp JM. Effects of ageing and exercise training on endothelium-dependent vasodilatation and structure of rat skeletal muscle arterioles. J Physiol. 2004;556:947–958. doi: 10.1113/jphysiol.2003.060301. [DOI] [PMC free article] [PubMed] [Google Scholar]
- 47.Srere PA. Citrate synthase. Methods in Enzymology. 1969;13:3–5. [Google Scholar]
- 48.Yang HT, Laughlin MH, Terjung RL. Prior exercise training increases collateral-dependent blood flow in rats after acute femoral artery occlusion. American Journal of Physiology Heart Circulatory Physiology. 2000;279:H1890–H1897. doi: 10.1152/ajpheart.2000.279.4.H1890. [DOI] [PubMed] [Google Scholar]
- 49.Yang HT, Ren J, Laughlin MH, Terjung RL. Prior exercise training produces NO-dependent increases in collateral blood flow after acute arterial occlusion. Am J Physiol Heart Circ Physiol. 2002;282:H301–10. doi: 10.1152/ajpheart.00160.2001. [DOI] [PubMed] [Google Scholar]


