

Abstract
As the rate of functional RNA sequence discovery escalates, high-throughput techniques for reliable structural determination are becoming crucial for revealing the essential features of these RNAs in a timely fashion. Computational predictions of RNA secondary structure quickly generate reasonable models but suffer from several approximations, including overly simplified models and incomplete knowledge of significant interactions. Similar problems limit the accuracy of predictions for other self-folding polymers, including DNA and peptide nucleic acid (PNA). The work presented here demonstrates that incorporating unassigned data from simple nuclear magnetic resonance (NMR) experiments into a dynamic folding algorithm greatly reduces the potential folding space of a given RNA and therefore increases the confidence and accuracy of modeling. This procedure has been packaged into an NMR-assisted prediction of secondary structure (NAPSS) algorithm that can produce pseudoknotted as well as non-pseudoknotted secondary structures. The method reveals a probable pseudoknot in the part of the coding region of the R2 retrotransposon from Bombyx mori that orchestrates second-strand DNA cleavage during insertion into the genome.
Introduction
New and interesting RNA sequences are being rapidly discovered. As a consequence, researchers are becoming increasingly reliant on computer-generated secondary structure predictions as an initial step in elucidating structure−function relationships. Thermodynamics-based dynamic folding algorithms, such as MFOLD and RNAstructure, however, are less than 75% accurate on average when predicting secondary structure from primary sequence alone.1,2 Similar problems are encountered when structure prediction algorithms are used to design self-folding structures formed by RNA or related polymers such as DNA and peptide nucleic acid (PNA). Thus, there is a demand for rapid, accurate methods to model secondary structures.
Incorporation of data from chemical mapping(2) and/or microarray experiments(3) can improve the accuracy of algorithms predicting secondary structure by providing constraints that identify unpaired nucleotides. Nuclear magnetic resonance spectroscopy can produce complementary experimental constraints that identify base pairs.(4) NMR can also yield geometric constraints that help model 3D structure. Advances in NMR techniques5,6 and stable isotope labeling methods7–12 permit rapid acquisition of NMR spectra of RNAs with more than one hundred nucleotides.(13) Here, we show that incorporating easily extracted information from unassigned NMR spectra into an expanded recursive folding algorithm can greatly enhance the accuracy of a modeled secondary structure. Rapid generation of reliable secondary structures would accelerate generation of searchable databases of secondary structures to provide a new level of comparison for genomes.
To test the power of NMR-assisted secondary structure prediction, a 74-nucleotide fragment of the 5′ coding region from the Bombyx mori R2 retrotransposon was studied. The R2 retrotransposon is a mobile genetic element that inserts itself specifically into a host’s DNA with a mechanism that, if better understood, could have implications for genetic therapies.(14) The 74-nucleotide fragment is part of a 323-nucleotide region that binds to one copy of the R2 protein and orchestrates second-strand DNA cleavage during insertion.(15) Chemical mapping and microarray binding experiments on the 323-nucleotide region yielded few constraints in the 74-nucleotide segment.(16) In this work, two NMR spectra provide helical constraints that, when input into a new computer algorithm, greatly reduce the potential folding space for this RNA and reveal a novel pseudoknot structure. The NMR-assisted prediction of RNA secondary structure (NAPSS) algorithm reported here is applicable to many other RNAs as well as other polymers and nanostructures with discernible magnetic resonance signatures and known thermodynamics. Such polymers include DNA,(17) PNA,(18) and 2′-O-methyl,(19) 2′-fluoro,(20) 2′-amino,(21) and locked nucleic acid (LNA)(22) modified nucleic acids.
Materials and Methods
RNA Sample Production
The original plasmid for the B. mori R2 retrotransposon coding region was provided by Dr. Shawn Christensen and Prof. Thomas Eickbush.(15) The plasmid for 74-nt fragment production was derived from this by standard polymerase chain reaction (PCR) techniques with DNA primers purchased from Integrated DNA Technologies, Inc. The fragment sequence corresponds to nucleotides 50−123 of the 323 nt region that is protected by R2 protein bound to R2 mRNA.15,16 Base pair C51-G105 was flipped (to G2-C56 in Figure 1) to enhance transcription efficiency; this change does not cause any major changes in the predicted secondary structures. After linearizing the plasmid with BbsI restriction endonuclease (New England Biolabs, Inc.), the RNA was transcribed with Ampliscribe T7 RNA polymerase kits (Epicenter Biotechnologies) with or without 13C-, 15N-labeled GTP and UTP (Sigma-Aldrich Co.), and purified on denaturing polyacrylamide gels. The 15-nt hairpin mimic (5′CUUGCGAAAGCGGGA3′) was purchased from Dharmacon, Inc., and used without further purification.
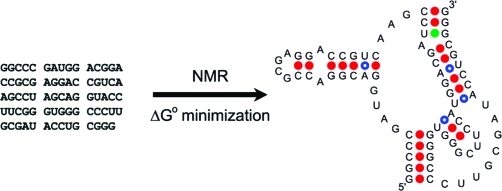
Figure 1.

Comparison of predicted structures and NMR evidence at 15 °C for a 74-nt fragment of the B. mori R2 retrotransposon coding region. (a) Possible secondary structures; colored dots indicate base pair type (blue = AU, red = GC, green = GU). (b) NMR spectral data. Upper frames depict the imino proton region from a 200 msec 2D-NOESY spectrum of an unlabeled sample; lower frames are taken from a 2D-NHSQC spectrum of a G- and U-labeled sample. Typical chemical shift ranges are indicated by brackets above and to the right of the spectra. Dashed lines and asterisk indicate an imino proton connection that is not apparent from this plot alone, but is confirmed by a 1D NOE experiment (see Figure S3 of Supporting Information). The connections in the upper left frame depict a helical walk that rules out structure 3. Similarly, the upper right frame depicts a helix that does not match any in structure 2 or 3, but does coincide with the helices in structure 1 indicated by purple boxes (including a connection across a flush coaxial stack). Additional helical walks connecting two and five consecutive GC pairs are also observed but not depicted here (see Figure 2). Data were acquired on a 600 MHz spectrometer at 15 °C in NMR buffer of 150 mM NaCl, 2 mM MgCl2, 10 mM NaH2PO4, 0.05 mM EDTA, pH 6.0. Similar spectra were acquired at 25 °C with no differences in the observed patterns (see Figure S4 of Supporting Information).
NMR Experimental Conditions
Native gel electrophoresis was used to find conditions giving a single folding of the 74-nt fragment. A single, sharp band was observed on a native polyacrylamide gel when at least 1 mM Mg2+ was present in the sample buffer during incubation at 60 °C for 5 min followed by either slow or rapid cooling to 4 °C. The 74-nt RNA was therefore dialyzed into NMR sample buffer of 150 mM NaCl, 10 mM NaH2PO4, 2 mM MgCl2, 0.05 mM EDTA, pH 6.0 using a 10 kDa MWCO Slide-a-Lyzer dialysis cassette (Thermo Fisher Scientific, Inc.) and then renatured at 60 °C for 5 min to produce a single conformation based on native gel electrophoresis. The 15-nt hairpin mimic was dialyzed into the same buffer using a 1 kDa MWCO Float-a-Lyzer dialysis device (Spectrum Laboratories, Inc.). Spectra were acquired on a Varian Inova 600 MHz spectrometer with a NOESY mixing time of 200 msec at 15 and 25 °C for the 74-nt fragment, and at 0 °C for the 15-nt hairpin mimic. Water suppression was accomplished with a WATERGATE-type pulse sequence with flipback.23,24
Algorithm for NMR Constraint Incorporation
Computer code was written in C++ (for a brief overview of the computational process, see Figure S1 of Supporting Information). The algorithm requires three text files as input: the RNA’s primary sequence, an exported dot plot from RNAstructure that represents every possible base pair as a dot in a 2D matrix, and helical walks derived from NMR spectra showing imino−imino proton connections that produce NOE crosspeaks. From these data, the algorithm performs a recursive search of the dot plot matrix to find potential match sites for the NMR-derived constraints. The algorithm allows walks through continuous helixes, single base bulges, and flush coaxial stacks that consist of two non-pseudoknotted helices having no intervening nucleotides between them on one of the strands. These latter two conformations, which can bring the imino protons of nonconsecutive base pairs close enough to produce an NOE crosspeak, are considered at every step in the matching procedure except for the first and last step in each constraint, as a single terminal base pair is unlikely to produce a stable NMR resonance due to increased water exchange and conformational flexibility. To further ensure valid walks through coaxial stacks, such connections also require each of the flanking base pairs to be present in low free energy structure(s) as the closing base pair of an external or multibranch loop.
It is assumed that imino walks will not be continuous across bulges of more than one nucleotide,(25) which is consistent with thermodynamic data indicating lack of cooperativity between helixes separated by bulges with more than one nucleotide.26,27 The current version of NAPSS also does not consider the possibility of an imino−imino connection across helices involved in a pseudoknotted stack because a search of NMR28–33 and crystal structures34–37 did not reveal any such pair of imino hydrogens within the distance required for observing an NOE. NAPSS could be modified, however, if either of these assumptions is disproved in the future.
A new dot plot is then generated for every valid combination of helical matches. Each of these dot plots is “trimmed” from the original plot by removing other dots in the same rows or columns as the matched base pairs because the pairing of these nucleotides has already been constrained. After temporarily forcing the nucleotides of experimentally determined base pairs to be single stranded, the remaining unconstrained dot plot regions are subjected to a refolding algorithm to determine stable configurations for these regions. The constrained base pairs are reinserted, and the free energy of each structure is calculated with standard thermodynamic values2,38 for nonpseudoknotted regions, and a simple polynomial function(39) for pseudoknotted regions. This approach allows pseudoknots to form whether or not both helixes from the pseudoknot are observed in the NMR spectra. The final output is a list of secondary structures consistent with the NMR helical constraints and ranked according to their predicted stabilities (ΔG°37). The current implementation of NAPSS completes these calculations for the 74-nt fragment of the B. mori R2 coding region in only 12 s of CPU time on a dual-core 2.0 GHz Intel Xeon 5130 processor. The source code for NAPSS is freely available for download at http://rna.urmc.rochester.edu/.
Results
Choosing Accurate Secondary Structures
The prediction algorithms, RNAstructure,(2) NUPACK,(39) and SFOLD,(40) generate many thermodynamically favorable secondary structures for the 74-nucleotide segment from the 5′ coding region of the B. mori R2 RNA. Because of incomplete knowledge of the thermodynamic parameters and structural features governing the true stability of a particular folding, it is often difficult to select the correct structure from such a list. Figure 1a shows three structures that are representative of the overall ensemble for this RNA because they have predicted thermodynamic stabilities (ΔG°37) close to the most favorable predicted value and because the vast majority of the remaining secondary structures are subtle variations on one of these three selections (also see Figure S2 of Supporting Information). As can be seen in Figure 1a, the structures contain helical segments that differ in base pair sequence.
The upper panels of Figure 1b depict two copies of the imino region of a 2D-NOESY spectrum for an unlabeled sample of the 74-nucleotide RNA, while the lower panels display the corresponding region from a 1H−15N HSQC spectrum for a sample that has G and U nucleotides labeled with 13C and 15N. Base pair types for these imino resonances are identified on the basis of their 1H and 15N chemical shifts. Individual 1H resonances along the diagonal can be connected through NOE cross-peaks observed between imino protons in adjacent base pairs to form helical walks. In this case, four helical segments are identified in the NMR spectra. Of the possible secondary structures from Figure 1b (and Figure S2 of Supporting Information), only structure 1 can accommodate these experimental constraints (see caption to Figure 1).
Automating with Dot Plots
Base pair dot plots provide a way to integrate NMR-derived experimental constraints with structure prediction (Figure 2). A base pair dot plot is a triangular half of a two-dimensional N × N grid (where N is the number of nucleotides) that compiles all the base pairs present in a list of predicted secondary structures and symbolizes them as dots at coordinates corresponding to the nucleotide indices for each pair.(41) An algorithm was written to search for helical walk regions in predicted secondary structures (see Figure S1 of Supporting Information). The algorithm allows imino−imino connections through helical segments of secondary structure as well as across single-base bulges and flush coaxial stacks as described in the section.
Figure 2.

Procedure for trimming dot plots. (a) Full dot plot generated by RNAstructure 4.4 for the B. mori R2 retrotransposon 74-nt fragment. (b) Dot plot for the same RNA with a maximum free energy equal to 75% of the ΔG°37 for the minimum free energy structure. (c) Trimmed dot plots generated by NAPSS for each valid combination of helical constraint matches from NMR. Colored circles indicate positions of NMR constraint matches and boxes contain the coaxially stacked helices indicative of a pseudoknot structure that is present in all possible match combinations for this RNA.
Once a list of constraint matches is determined, a new “trimmed” dot plot is generated for every valid combination of matches. Nucleotides constrained by the NMR data are temporarily forced to be single stranded, and the remaining unconstrained regions are then subjected to a refolding algorithm. The final output consists of secondary structures that are consistent with the experimental data and ranked according to their predicted free energies. This is similar to previous iterative methods,42,43 but NAPSS constrained helices are chosen on the basis of the NMR experiments, and a single iteration is sufficient.
For the B. mori R2 retrotransposon fragment, the initial algorithmic search of a dot plot that considers all pairs in structures within 25% of the predicted minimum ΔG°37 yields 11 possible structures, all of which contain the pseudoknot and coaxially stacked helices indicated by the boxes in Figure 1a and Figure 2c, with structure 1 in Figure 1a having the most favorable predicted thermodynamic stability. This search was done with the four helical walks mentioned in Figure 1, but only considering a 4-bp connection for the walk depicted in the left frame of this figure. Extending this helix to a 5-bp walk reduces the number of output structures to 10 yet causes no change in the most stable predictions (see Figure S5 of Supporting Information). In comparison, an unconstrained RNAstructure 4.4 prediction, using a heuristic to generate low free energy structures, yields 65210 total structures within the same free energy window and a minimum free energy structure with only 58% of the correct base pairs.
Additional Evidence for the Pseudoknot
In addition to imino walks, other regions of NMR spectra can be examined for evidence of secondary structure motifs to test the predicted secondary structure. For example, Figure 3 demonstrates the multiple-peak signature of the UUCG tetraloop(44) found in the 13C-HSQC spectrum of the B. mori R2 fragment. This argues against structure 3 from Figure 1a being the correct secondary structure because this folding contains no UUCG tetraloop.
Figure 3.

13C-HSQC spectrum from the 13C, 15N, G-, and U-labeled B. mori R2 74-nt fragment sample. Boxes indicate resonances out of typical chemical shift ranges that are indicative of a UNCG-type tetraloop.(44) Other “signature” peaks are not present because cytosine is not 13C-labeled in this sample.
Structures 2 and 3 from Figure 1a contain a tandem GU motif that is expected to give a distinct NMR signature in the 10−12 ppm region.(45) To test the conclusion that structures 2 and 3 are incorrect predictions, a 2D-NOESY imino proton spectrum was measured for a hairpin, 5′CUUGCGAAAGCGGGA3′, with a stem having five base pairs equivalent to those in the hairpin at the 3′ end of putative structures 2 and 3. As seen in Figure 4, an overlay of the NOESY spectrum from the 74-nucleotide R2 fragment with that of the model hairpin reveals that the pattern of resonances and cross-peaks from a tandem GU wobble pair in the hairpin’s spectrum is not evident in the 74-nucleotide fragment’s spectrum.
Figure 4.

Overlay of 2D-NOESY imino spectra from the B. mori R2 74-nt fragment (black) and 15-nt hairpin mimic, 5′CUUGCGAAAGCGGGA3′ (red). Peaks from the tandem GU wobble pairs in the hairpin mimic are highlighted with arrows. Both spectra were acquired on a 600 MHz spectrometer using a 200 msec mixing time and buffer of 150 mM NaCl, 2 mM MgCl2, 10 mM NaH2PO4, 0.05 mM EDTA, pH 6.0. Hairpin spectrum was measured at 0 °C; fragment spectrum was recorded at 15 °C. No additional peaks were observed in the fragment spectrum at lower temperatures.
Discussion
Determination of RNA secondary structure is important for understanding structure−function relationships and can facilitate design of therapeutics targeting RNA. Computer algorithms based on free energy minimization are important tools in determining potential foldings for RNA sequences, but their overall accuracy is limited by several factors.(46) For the 74-nucleotide fragment of the B. mori R2 retrotransposon, ten similar pseudoknotted structures are identified as consistent with the NMR experimental data. This is a vast improvement compared to the 65000 non-pseudoknotted structures that result from an unconstrained RNAstructure prediction for this sequence within the same free energy window. Evidently, NMR-derived experimental constraints can rapidly reduce the potential folding space for a given RNA and provide a more accurate modeling of its secondary structure. This reduced library of possible secondary structures should also allow faster three-dimensional modeling of large RNAs by programs such as FARNA(47) and MC-SYM.(48)
Owing to the reduced spectral complexity in the imino range as compared to other NMR regions, the observance of sharp NMR resonances in large biomolecular complexes,11,13,49 and the possibilities for segmental labeling,9,11,12 NAPSS should be applicable to RNAs of up to about 300 nucleotides from an experimental as well as a computational standpoint as long as the RNA is in a single conformation. The latter assumption can be tested by methods including native gel electrophoresis and dynamic light scattering.(50) Evidence of multiple conformations can also be found in NMR spectra as an excess number of peaks, as a set of minor (small amplitude) peaks in the presence of a major set of peaks, or, in the case of exchange between the conformations, there may be large NOE cross peaks between like protons. In this case, the NAPSS analysis can only be applied if an imino−imino NOE walk can be clearly attributed to a particular conformation. If walks from multiple conformations are erroneously presumed to belong to a single structure, then many otherwise valid secondary structures will be removed by the NAPSS filter, including the correct structure.
One feature of the procedure described here is that even though RNAstructure’s dynamic programming algorithm cannot explicitly generate structures with pseudoknots, NAPSS can provide pseudoknotted solutions. Identifying pseudoknots is important because they are essential for many biological functions, including promoting frameshifting,28–31,33,34,37,51–54 constructing virus ribosome entry sites,(55) and maintaining proper telomere length.32,56,57 The pseudoknot discovered here is likely important for temporally orchestrating the binding of a copy of R2 protein to the R2 RNA and subsequent functioning of the R2 protein to make the second DNA cleavage at the insertion site in the genome.
This work demonstrates that available NMR instrumentation allows the secondary structure of relatively large RNA molecules to be accurately determined within a few days of preparing the NMR sample. The base pairing constraints obtained from NMR experiments can also be used in concert with information from other methods that yield complementary structural data for modeling RNA. For example, the NAPSS algorithm can be applied to a dot plot file generated by RNAstructure that has already taken into account the results of chemical modification experiments.(2) The folding space could be further restricted by steric constraints from consideration of 3D structure. The helical regions that NAPSS identifies can also provide key entry points for the complete spectral assignments that are required for determining three-dimensional structures of RNAs by NMR.5,6
The current implementation of the NAPSS algorithm shows the utility of NMR-derived base pair walks for limiting the potential folding space of an RNA structure. NMR spectra often contain additional structural evidence that can rapidly limit folding space further. For example, determining the relative orientation of the base pairs from which imino resonances originate would provide enhanced constraints. Preliminary data indicate that the volumes of imino−imino cross-peaks from the Watson−Crick segments of the B. mori R2 fragment correlate well with the distances expected for structure 1 from Figure 1a (data not shown). Spectra for other RNAs will be necessary to determine if comparisons between measured and expected volumes report base pair orientation reliably enough to be incorporated into the secondary structure prediction algorithm. Another possible means of obtaining information about base pair orientation is based on the chemical shift values of various nonexchangeable protons within the base pairs. Although chemical shifts can be reliably predicted from a known three-dimensional structure,(58) the empirical database is too small for a definitive validation of inferring orientation solely from chemical shifts.
The NAPSS algorithm currently searches for walks through helixes of AU and GC Watson−Crick pairs and GU wobble pairs. While no stable GU wobble pairs were observed in the current study, NMR evidence for GU pairs in a secondary structure would greatly reduce potential folding space because GU pairs are much less common than AU and GC pairs. Other less common RNA secondary structure elements that exhibit distinct NMR signatures could also be included in future versions of this algorithm to enhance its predictive power. Examples include imino GA pairs(59) and tetraloop resonances,44,60,61 such as the signature illustrated in Figure 3. NAPSS could also be expanded to assist in NMR structural studies of modified oligonucleotides and other polymers that exhibit similar connectivities.
NAPSS is designed for deducing the secondary structure of an RNA in the absence of ligands because the thermodynamics have no provision for ligands. It could, however, reveal the correct secondary structure in the presence of ligand if the ligand does not force new helical segments not included in any suboptimal structure. Thus, applications in the presence of ligand should include a relatively large user-defined free energy window for generating structures.
Acknowledgments
We thank Dr. Shawn Christensen and Prof. Thomas Eickbush for providing the original B. mori R2 plasmid template and William Burke for his assistance with plasmid construction. We also thank them and Prof. Thomas Krugh for helpful discussions. Funding was provided by NIH Grants GM22939 (D.H.T.) and GM076485 (D.H.M.).
Supporting Information Available
NAPSS algorithm pseudocode; centroid secondary structures from SFOLD; 1D difference NOE spectra for downfield AU imino proton resonances; 2D-NOESY and 2D-NHSQC spectra at 25 °C; secondary structures output from NAPSS. This material is available free of charge via the Internet at http://pubs.acs.org.
Funding Statement
National Institutes of Health, United States
Supplementary Material
References
- Mathews D. H.; Sabina J.; Zuker M.; Turner D. H. J. Mol. Biol. 1999, 288, 911–940. [DOI] [PubMed] [Google Scholar]
- Mathews D. H.; Disney M. D.; Childs J. L.; Schroeder S. J.; Zuker M.; Turner D. H. Proc. Natl. Acad. Sci. U.S.A. 2004, 101, 7287–7292. [DOI] [PMC free article] [PubMed] [Google Scholar]
- Kierzek E.; Kierzek R.; Turner D. H.; Catrina I. E. Biochemistry 2006, 45, 581–593. [DOI] [PMC free article] [PubMed] [Google Scholar]
- Johnston P. D.; Redfield A. G. Biochemistry 1981, 20, 1147–1156. [DOI] [PubMed] [Google Scholar]
- Furtig B.; Richter C.; Wohnert J.; Schwalbe H. ChemBioChem 2003, 4, 936–962. [DOI] [PubMed] [Google Scholar]
- Latham M. R.; Brown D. J.; McCallum S. A.; Pardi A. ChemBioChem 2005, 6, 1492–1505. [DOI] [PubMed] [Google Scholar]
- Flodell S.; Cromsigt J.; Schleucher J.; Kidd-Ljunggren K.; Wijmenga S. J. Biomol. Struct. Dyn. 2002, 19, 627–636. [DOI] [PubMed] [Google Scholar]
- Ponchon L.; Dardel F. Nat. Methods 2007, 4, 571–576. [DOI] [PubMed] [Google Scholar]
- Xu J.; Lapham J.; Crothers D. M. Proc. Natl. Acad. Sci. U.S.A. 1996, 93, 44–48. [DOI] [PMC free article] [PubMed] [Google Scholar]
- Tolbert T. J.; Williamson J. R. J. Am. Chem. Soc. 1997, 119, 12100–12108. [Google Scholar]
- Kim I.; Lukavsky P. J.; Puglisi J. D. J. Am. Chem. Soc. 2002, 124, 9338–9339. [DOI] [PubMed] [Google Scholar]
- Tzakos A. G.; Easton L. E.; Lukavsky P. J. J. Am. Chem. Soc. 2006, 128, 13344–13345. [DOI] [PubMed] [Google Scholar]
- D’Souza V.; Dey A.; Habib D.; Summers M. F. J. Mol. Biol. 2004, 337, 427–442. [DOI] [PubMed] [Google Scholar]
- Eickbush D. G.; Luan D. M. D.; Eickbush T. H. Mol. Cell. Biol. 2000, 20, 213–223. [DOI] [PMC free article] [PubMed] [Google Scholar]
- Christensen S. M.; Ye J. Q.; Eickbush T. H. Proc. Natl. Acad. Sci. U.S.A. 2006, 103, 17602–17607. [DOI] [PMC free article] [PubMed] [Google Scholar]
- Kierzek E.; Kierzek R.; Moss W. N.; Christensen S. M.; Eickbush T. H.; Turner D. H. Nucleic Acids Res. 2008, 36, 1770–1782. [DOI] [PMC free article] [PubMed] [Google Scholar]
- SantaLucia J. Jr Proc. Natl. Acad. Sci. U.S.A. 1998, 95, 1460–1465. [DOI] [PMC free article] [PubMed] [Google Scholar]
- Schwarz F. P.; Robinson S.; Butler J. M. Nucleic Acids Res. 1999, 27, 4792–4800. [DOI] [PMC free article] [PubMed] [Google Scholar]
- Kierzek E.; Mathews D. H.; Ciesielska A.; Turner D. H.; Kierzek R. Nucleic Acids Res. 2006, 34, 3609–3614. [DOI] [PMC free article] [PubMed] [Google Scholar]
- Sabahi A.; Guidry J.; Inamati G. B.; Manoharan M.; Wittung-Stafshede P. Nucleic Acids Res. 2001, 29, 2163–2170. [DOI] [PMC free article] [PubMed] [Google Scholar]
- Pham J. W.; Radhakrishnan I.; Sontheimer E. J. Nucleic Acids Res. 2004, 32, 3446–3455. [DOI] [PMC free article] [PubMed] [Google Scholar]
- McTigue P. M.; Peterson R. J.; Kahn J. D. Biochemistry 2004, 43, 5388–5405. [DOI] [PubMed] [Google Scholar]
- Piotto M.; Saudek V.; Sklenar V. J. Biomol. NMR 1992, 2, 661–665. [DOI] [PubMed] [Google Scholar]
- Grzesiek S.; Bax A. J. Am. Chem. Soc. 1993, 115, 12593–12594. [Google Scholar]
- Du Z. H.; Yu J. H.; Ulyanov N. B.; Andino R.; James T. L. Biochemistry 2004, 43, 11959–11972. [DOI] [PubMed] [Google Scholar]
- Jaeger J. A.; Turner D. H.; Zuker M. Proc. Natl. Acad. Sci. U.S.A. 1989, 86, 7706–7710. [DOI] [PMC free article] [PubMed] [Google Scholar]
- Weeks K. M.; Crothers D. M. Science 1993, 261, 1574–1577. [DOI] [PubMed] [Google Scholar]
- Michiels P. J. A.; Versleijen A. A. M.; Verlaan P. W.; Pleij C. W. A.; Hilbers C. W.; Heus H. A. J. Mol. Biol. 2001, 310, 1109–1123. [DOI] [PMC free article] [PubMed] [Google Scholar]
- Nixon P. L.; Rangan A.; Kim Y. G.; Rich A.; Hoffman D. W.; Hennig M.; Giedroc D. P. J. Mol. Biol. 2002, 322, 621–633. [DOI] [PubMed] [Google Scholar]
- Shen L. X.; Tinoco I. J. Mol. Biol. 1995, 247, 963–978. [DOI] [PubMed] [Google Scholar]
- Cornish P. V.; Hennig M.; Giedroc D. P. Proc. Natl. Acad. Sci. U.S.A. 2005, 102, 12694–12699. [DOI] [PMC free article] [PubMed] [Google Scholar]
- Theimer C. A.; Blois C. A.; Feigon J. Mol. Cell 2005, 17, 671–682. [DOI] [PubMed] [Google Scholar]
- Cornish P. V.; Stammler S. N.; Giedroc D. P. RNA 2006, 12, 1959–1969. [DOI] [PMC free article] [PubMed] [Google Scholar]
- Egli M.; Minasov G.; Su L.; Rich A. Proc. Natl. Acad. Sci. U.S.A. 2002, 99, 4302–4307. [DOI] [PMC free article] [PubMed] [Google Scholar]
- Ke A. L.; Zhou K. H.; Ding F.; Cate J. H. D.; Doudna J. A. Nature 2004, 429, 201–205. [DOI] [PubMed] [Google Scholar]
- Serganov A.; Keiper S.; Malinina L.; Tereshko V.; Skripkin E.; Hobartner C.; Polonskaia A.; Phan A. T.; Wombacher R.; Micura R.; Dauter Z.; Jaschke A.; Patel D. J. Nat. Struct. Mol. Biol. 2005, 12, 218–224. [DOI] [PMC free article] [PubMed] [Google Scholar]
- Pallan P. S.; Marshall W. S.; Harp J.; Jewett F. C.; Wawrzak Z.; Brown B. A.; Rich A.; Egli M. Biochemistry 2005, 44, 11315–11322. [DOI] [PMC free article] [PubMed] [Google Scholar]
- Xia T. B.; SantaLucia J.; Burkard M. E.; Kierzek R.; Schroeder S. J.; Jiao X. Q.; Cox C.; Turner D. H. Biochemistry 1998, 37, 14719–14735. [DOI] [PubMed] [Google Scholar]
- Dirks R. M.; Pierce N. A. J. Comput. Chem. 2003, 24, 1664–1677. [DOI] [PubMed] [Google Scholar]
- Ding Y.; Chan C. Y.; Lawrence C. E. RNA 2005, 11, 1157–1166. [DOI] [PMC free article] [PubMed] [Google Scholar]
- Zuker M. Science 1989, 244, 48–52. [DOI] [PubMed] [Google Scholar]
- Ren J.; Rastegari B.; Condon A.; Hoos H. H. RNA 2005, 11, 1494–1504. [DOI] [PMC free article] [PubMed] [Google Scholar]
- Ruan J.; Stormo G. D.; Zhang W. Bioinformatics 2004, 20, 58–66. [DOI] [PubMed] [Google Scholar]
- Allain F. H. T.; Varani G. Nucleic Acids Res. 1995, 23, 341–350. [DOI] [PMC free article] [PubMed] [Google Scholar]
- Kieft J. S.; Tinoco I. Structure 1997, 5, 713–721. [DOI] [PubMed] [Google Scholar]
- Mathews D. H.; Turner D. H. Curr. Opin. Struct. Biol. 2006, 16, 270–278. [DOI] [PubMed] [Google Scholar]
- Das R.; Baker D. Proc. Natl. Acad. Sci. U.S.A. 2007, 104, 14664–14669. [DOI] [PMC free article] [PubMed] [Google Scholar]
- Parisien M.; Major F. Nature 2008, 452, 51–55. [DOI] [PubMed] [Google Scholar]
- Gelis I.; Bonvin A.; Keramisanou D.; Koukaki M.; Gouridis G.; Karamanou S.; Economou A.; Kalodimos C. G. Cell 2007, 131, 756–769. [DOI] [PMC free article] [PubMed] [Google Scholar]
- Doudna J. A.; Ferre-d’Amare A. R., Establishing suitability of RNA preparations for crystallization. Determination of polydispersity. InRibozyme Protocols; Turner P., Ed.; Methods in Molecular Biology Series; Humana Press: Totowa, NJ, 1997; Vol. 74, pp 371−377. [DOI] [PubMed] [Google Scholar]
- Giedroc D. P.; Theimer C. A.; Nixon P. L. J. Mol. Biol. 2000, 298, 167–185. [DOI] [PMC free article] [PubMed] [Google Scholar]
- Plant E. P.; Jacobs K. L. M.; Harger J. W.; Meskauskas A.; Jacobs J. L.; Baxter J. L.; Petrov A. N.; Dinman J. D. RNA 2003, 9, 168–174. [DOI] [PMC free article] [PubMed] [Google Scholar]
- Ivanov I. P.; Anderson C. B.; Gesteland R. F.; Atkins J. F. J. Mol. Biol. 2004, 339, 495–504. [DOI] [PMC free article] [PubMed] [Google Scholar]
- Chen X. Y.; Chamorro M.; Lee S. I.; Shen L. X.; Hines J. V.; Tinoco I.; Varmus H. E. EMBO J. 1995, 14, 842–852. [DOI] [PMC free article] [PubMed] [Google Scholar]
- Wang C. Y.; Le S. Y.; Ali N.; Siddiqui A. RNA 1995, 1, 526–537. [PMC free article] [PubMed] [Google Scholar]
- Theimer C. A.; Feigon J. Curr. Opin. Struct. Biol. 2006, 16, 307–318. [DOI] [PubMed] [Google Scholar]
- Yingling Y. G.; Shapiro B. A. J. Mol. Biol. 2005, 348, 27–42. [DOI] [PubMed] [Google Scholar]
- Cromsigt J.; Hilbers C. W.; Wijmenga S. S. J. Biomol. NMR 2001, 21, 11–29. [DOI] [PubMed] [Google Scholar]
- Wohnert J.; Dingley A. J.; Stoldt M.; Gorlach M.; Grzesiek S.; Brown L. R. Nucleic Acids Res. 1999, 27, 3104–3110. [DOI] [PMC free article] [PubMed] [Google Scholar]
- Allain F. H. T.; Varani G. J. Mol. Biol. 1995, 250, 333–353. [DOI] [PubMed] [Google Scholar]
- Jucker F. M.; Heus H. A.; Yip P. F.; Moors E. H. M.; Pardi A. J. Mol. Biol. 1996, 264, 968–980. [DOI] [PubMed] [Google Scholar]
Associated Data
This section collects any data citations, data availability statements, or supplementary materials included in this article.