

Abstract

In this paper we describe a method for creating multifunctional glass surfaces presenting discrete patches of different proteins on an inert PEG-functionalized background. Microcontact printing is used to stamp the substrate with octadecyltrichlorosilane to define the active regions. The substrate is then back-filled with PEG-silane {[[2-methoxypoly(ethyleneoxy)]propyl]trimethoxysilane} to define passive regions. A microfluidics device is subsequently affixed to the substrate to deliver proteins to the active regions, with as many channels as there are proteins to be patterned. Examples of trifunctional surfaces are given which present three terminating functional groups, i.e., protein 1, protein 2, and PEG. These surfaces should be broadly useful in biological studies, as patch size is well established to influence cell viability, growth, and differentiation. Three examples of cellular interactions with the surfaces are demonstrated, including the capture of cells from a single cell suspension, the selective sorting of cells from a mixed suspension, and the adhesion of cells to ligand micropatches at critical shear stresses. Within these examples, we demonstrate that the patterned immobilized proteins are active, as they retain their ability to interact with either antibodies in solution or receptors presented by cells. When appropriate (e.g., for E-selectin), proteins are patterned in their physiological orientations using a sandwich immobilization technique, which is readily accommodated within our method. The protein surface densities are highly reproducible in the patches, as supported by fluorescence intensity measurements. Potential applications include biosensors based on the interaction of cells or of marker proteins with protein patches, fundamental studies of cell adhesion as a function of patch size and shear stress, and studies of cell differentiation as a function of surface cues.
Introduction
We demonstrate the creation of surfaces which present multiple functionalities by serial application of microcontact printing (μCP) to define the regions of interest on the substrate, followed by filling of those regions by affixing the substrate as a lid over microfluidic (MF) channels. The functionalization of the micropatterned surfaces can be generic, ranging from surfaces that present alkanethiols of different chain lengths and terminal functionalities to surfaces with PEG-functionalized regions and regions presenting proteins and antibodies. We focus on the latter class of functionalities for biological application. The method allows the definition of discrete active regions for protein adsorption surrounded by inert PEG-functionalized regions and the delivery of distinct proteins to the active regions from MF channels. Thus, surfaces presenting more than one protein in distinct patches surrounded by inert PEG-functionalized regions can be created.
It is well established that many cellular functions depend on the size of protein patches with which the cells interact. For example, Ismagilov and collaborators recently reported studies of blood clotting in which surfaces that present micrometer-scale patches covered with tissue factor, an initiator of the clotting response, are placed in contact with blood plasma. Blood clotting was reported only for patches above a critical size.(1) For adherent cells grown in patterned arrays, cellular responses such as cell viability, adhesion, or motility have been demonstrated to depend strongly on the size and shape of the cell-covered regions for a variety of cell types, including hepatocytes,2–4 neurons,5,6 fibroblasts,(7) epidermal cells,(8) and endothelial cells.9,10 Stem cell differentiation and signaling have been shown to depend strongly on the diameter and pitch of adhesive islands which control the colony diameter.(11) Recently, cell culture dishes micropatterned with a PEG derivative that resists protein and cell attachments have been shown to confine and guide the motion of 3T3 fibroblasts and human microvascular endothelial cells.(12)
For other systems, the role of the protein patch size has yet to be established, but it is likely to play a role. For example, the patch size should influence the adhesion of free-flowing cells such as blood platelets or leukocytes. These cells bind to each other or to bounding surfaces through interaction with a variety of proteins, as has been demonstrated by studies of the rolling and adhesive behavior of cells on randomly functionalized surfaces.(13) Control over the area and spacing of discrete functionalized patches in these systems should enable the accurate quantification of binding events under physiological flow conditions. Patterned surfaces are also exploited in cell-based biosensors.14–17
Surface patterning techniques are commonly divided into serial and parallel methods. In serial methods, regions on the surface are defined by either placing a functionality serially in desired locations or serially removing a functionality to expose regions of otherwise protected substrate, which are later filled with another molecule of interest. Typically, serial methods include dip pen nanolithography (DPN), e-beam lithography (EBL), and scanning tunneling microscopy (STM), collectively referred to as scanning probe lithography (SPL) techniques. In DPN, AFM tips are inked with a solution of the material to be transferred. The material on the tip transfers to the substrate while the probe is scanned across the surface, probably being mediated by the water meniscus formed by capillary condensation.(18) Alternatively, the probe can “scratch” the surface and selectively remove material such as polymers, liquid crystals, bilayers, resists, and SAMs.(19) EBL has been used to selectively ablate PEG and backfill with a protein or other functionality,(20) to locally “deactivate” a protein,(21) or to create gold patterns that constrain protein distribution.(22) These methods are well suited for high-precision (sub 100 nm) patterning of individual features. They have also been adapted to create multifunctional surfaces.23–26 Drawbacks of these methods include that they are time-consuming (requiring days to weeks to pattern a surface over millimeter length scales), that they have been demonstrated primarily on metallic substrates (e.g., Au, Cu, etc.), and that they require significant investment in equipment.
Parallel techniques allow the rapid definition of patterned regions to be functionalized and simultaneous introduction of functionalities to regions of interest. They are useful for patterning high-density features over large areas, often in applications when sub 100 nm precision is not crucial (although features at this length scale are achieved by nanoimprint lithography(27)). Photolithographic techniques, including soft lithography or μCP, are parallel methods. They are inexpensive, not extremely material specific, and readily adopted for creating micrometer-scale features over large areas (>cm2). These techniques are also benign to many proteins of interest and can be used on glass or polystyrene substrates, which are often the materials of choice in cell patterning and protein adhesion studies. Methods to automate these processes have been explored.(28)
Lithographic methods to create patterned bifunctional surfaces which present two molecules or chemical moieties in well-defined regions have been used for some time,2–7,9–11,14–17,29–42 although new techniques continue to emerge.43–49 One common technique exploits a photolithographic resist to protect regions of the surface during aninitial functionalization. Upon removal of the resist, theopen regions are backfilled with a second functionalityby immersion.1,4,5,14–17,29–33 Another method exploits μCP2,7,9,14–17,34–40,50–52 to transfer one functionality onto the surface in a pattern dictated by a poly(dimethylsiloxane) (PDMS) stamp which can be created with features as small as 50 nm.(53) Open regions are subsequently backfilled to introduce a second functionality. The stamped features can be precursors to protein adsorption34–38 or the proteins of interest themselves.40,50–52 A third method uses MF networks made of PDMS. The substrate is affixed to a grooved PDMS stamp to form an MF channel through which a solution of the adsorbing species is introduced. The species adsorbs where the substrate is in contact with the channel.3,10,15–17,54 Typically, bifunctional surfaces present a single active species which is typically a binding ligand or protein, surrounded by an inactive species such as PEG.
Methods to create multifunctional surfaces include serial methods such as DPN (parallelized variants of which have been developed exploiting continuous delivery of the species to be printed through specially designed pins).(26) Extensions of photolithographic methods have been developed in which masks are used sequentially to expose selected regions, which are then functionalized.(49) Extensions of the μCP technique have been developed to make multifunctional surfaces, including inking PDMS stamps with several functionalities on different regions, inking and stamping multiple times,55–57 or “subtractive offset printing”, in which proteins are selectively removed from a planar PDMS stamp to achieve a pattern and subsequently backfilled with another functionality of interest.(55) Collapsible stamps have also been developed that deliver ink from ink wells that span the stamp.(58)
MF networks have also been extended to create multifunctional surfaces in a highly parallelizable manner.59–64 The substrate to be patterned is affixed as a lid to an MF device which has several distinct channels. Functionalities of interest are introduced individually in the separate channels; they adsorb or chemisorb onto the substrate as they pass through the channel. The geometry of the pattern created on the surface is controlled by the shape and size of the MF channel; this method has been used to create patterned stripes with widths as small as 3 μm.(59) Thus, surfaces presenting an arbitrary number of functionalities have been created. However, this technique does not allow the formation of discrete patches of functionalized regions, which have been shown to be important in many biological studies as described above. Currently, microarray techniques, in which species of interest are deposited serially in spots on substrates, are used to create discrete patches presenting different functionalities.(65)
In this work we present a hybrid method to create substrates with discrete patches containing distinct functionalities, as depicted schematically in Figure 1. μCP is used to define the size and shape of the active features comprised of octadecyltrichlorosilane (OTS) on glass, which promotes protein adsorption, surrounded by passive regions functionalized with [[2-methoxypoly(ethyleneoxy)]propyl]trimethoxysilane (PEG-silane)(66) to prevent protein adsorption as shown in the left panel of Figure 1. MF channels are used to deliver distinct species (proteins, antibodies, surfactants) to the active regions, as depicted in the right panel of Figure 1. The number of patches filled is dictated by the width and contour of the MF channel containing that species. We demonstrate the creation and utility of these surfaces. First, trifunctional surfaces presenting micropatches of two proteins surrounded by inert PEG-functionalized regions are created. Such trifunctional surfaces are then used to capture and pattern cells from a single cell suspension and to sort and pattern cells from a mixed suspension. Finally, the role of the patch length scale in binding of LS174T colon carcinoma cells under prescribed flow conditions is demonstrated.
Figure 1.

Creation of multifunctional surfaces by serial use of μCP (left panel) and MF (right panel). A PDMS stamp (a1, a2) inked with an active species that promotes adsorption (b) is contacted with the substrate (c), rinsed (d), and backfilled with a passive species that prevents adsorption (e, f). The substrate is affixed as a lid to an MF network with n channels (g) through which adsorbing species 1 through n are introduced. The MF network used in this study is shown in (h). Images of the indicated areas of the actual MF network with flow directions within the network are shown in (1) and (2). By this method, surfaces presenting n species on distinct patches surrounded by continuous passivated regions are created. The pictures are not drawn to scale.
Materials and Methods
Reagents and Monoclonal Antibodies (mAbʼs)
The chimeric form of E-selectin−IgG Fc (E-selectin) was a generous gift of Wyeth External Research (Cambridge, MA). Anti-CD44 (2C5) mAb was from R&D Systems (Minneapolis, MN). Anti-CD66de (COL-1), anti-CD162 (KPL-1), PE-conjugated anti-CD162 (KPL-1-PE), PE-conjugated anti-CD66acde (B1.1-PE), and PE-conjugated anti-CD62E (68-5H11) mAbʼs, PE-conjugated mouse IgG, and FITC-conjugated mouse IgG were from BD Biosciences. FITC-conjugated bovine serum albumin (BSA), CellTracker Green CMFDA (5-(chloromethyl)fluorescein diacetate), and SNARF (1 carboxylic acid, acetate, succinimidyl ester) were purchased from Invitrogen (Molecular Probe, Oregon). All other reagents were used as received from Sigma unless otherwise stated. Experiments were done at room temperature unless otherwise stated. The antibodies passed through the MF channels were diluted in D-PBS.
Microcontact Printing and Microfluidics
PDMS stamps for μCP and MF were made by standard soft lithography.(67) The masks were designed using Adobe Illustrator CS2 and printed onto a transparency by a 5080 dpi printer (Pageworks, Cambridge, MA). To prepare masters, SU-8 2010 and SU-8 2050 epoxy negative photoresists (Microchem Corp., Massachusetts) were applied by spin coating (Laurell Technologies Corp., Pennsylvania) onto silicon wafers (Montco Silicon Technologies Inc., Pennsylvania) in two steps. SU-8 2010 was first spread at 600 rpm for 20 s and then at 3000 rpm for 20 s to a final thickness of 8−10 μm. The photoresist was prebaked at 95 °C for 1 min, exposed to UV (350−450 nm) radiation through appropriate masks for 20 s, postbaked at 115 °C for 8 min, and subsequently developed using SU-8 developer (Microchem Corp.). SU-8 2050 was first spread at 500 rpm for 10 s and then at 4000 rpm for 30 s to a final thickness of 50 μm. The resist was prebaked at 80 °C for 3 min and at 110 °C for 6 min, cooled, and exposed to UV (350−450 nm) radiation for 30 s through a mask. The resist was then postbaked for 8 min at 110 °C and developed as before. PDMS stamps were obtained by pouring Sylgard 184 prepolymer with cross-linker (Dow Corning, Michigan) in a 10:1 ratio (by weight), degassing in a vacuum, and curing at 80 °C for 1 h. Provisions were made for the inlets and outlet(s) while making the MF stamps. The cured stamps were peeled from the master and sonicated in ethanol for 15 min. OTS (10 mM) was prepared in n-hexane (Sigma-Aldrich, Wisconsin). Precleaned glass slides (Fisher Scientific) were plasma cleaned with oxygen in a plasma cleaner (Harrick PDC- 32G) and used immediately. OTS was applied by spin coating (3000 rpm for 30 s) onto the μCP stamp, which was placed in conformal contact with the glass slide for 1 min. Upon removal of the stamp, the glass slide was rinsed with n-hexane and DI water, dried with N2, and placed in a presilanized beaker for backfilling of the bare regions using a 2% solution of PEG-silane (MW 460−590; Gelest Inc., Pennsylvania) in anhydrous toluene with 1% triethylamine (Sigma-Aldrich) as a catalyst.(68) The reaction was performed at 70 °C for at least 1 h. The MF stamp was incubated in 0.1% BSA in a Petri dish for at least 1 h to passivate it against protein adsorption. Disposable 1 mL plastic syringes (Becton Dickinson, New Jersey) and 24 gauge PTFE tubing with luer lock fittings (Hamilton, Nevada) were used for handling the fluids. The MF stamp was removed from the BSA solution, washed sequentially with Dulbecco’s phosphate-buffered saline (D-PBS) and DI water, and dried with N2. The glass slide was removed from the PEG-silane solution, rinsed with toluene, and dried under N2. The glass slide presenting OTS patches surrounded by inert PEG was placed in conformal contact with the MF stamp.
Generation of micropatches coated with PE- and FITC-Labeled anti-IgG
PE- and FITC-labeled anti-IgG (50 μg/mL) were pumped for 1 h through the 100 and 200 μm channels, respectively, at 0.05−0.5 mL/h using syringe pump(s) (KDS 100 from KDScientific, Massachusetts) at the inlet(s) with vacuum applied at the outlets. Prior to removal of the PDMS that forms the MF network, the channels were flushed with D-PBS for 2−3 min to prevent spillover from one channel to another. The MF stamp was removed; the slide was rinsed in D-PBS and stored under D-PBS before imaging (Nikon Eclipse TE 2000E). PE- and FITC-labeled anti-IgG were able to adsorb noncovalently to the OTS presenting regions (positive control) but not to PEGylated microdomains (negative control).
Static Adhesion Assays on Discrete Anti-Human CD44 mAb and FITC−BSA Micropatches
A 35 μg/mL solution of anti-human CD44 mAb and a 0.5 mg/mL solution of FITC−BSA were perfused through the 200 and 100 μm MF channels, respectively, at a rate of 0.8 mL/h for 20 min. The channels were flushed with D-PBS before removal as described above. The slide was incubated with a suspension of SNARF-stained LS174T colon carcinoma cells (107 cells/mL) for 30 min at 37 °C, followed by washing with D-PBS to remove unbound and nonspecifically bound cells from the slide surface before imaging (Nikon Eclipse TE 2000E).(69) As a negative control, micropatterned surfaces were prepared presenting no antibodies, but patterned with OTS passivated with BSA and PEG patches in geometries similar to those of the patterned substrates used in the cell binding experiments. These substrates did not bind cells save for some weak nonspecific binding in the BSA-covered regions.
Cell Sorting via Static or Flow-Based Adhesion Assay
The MF channels were incubated with 2 μL of anti-human CD66de mAb (0.5 mg/mL) and anti-human CD162 mAb (0.5 mg/mL) for 1 h. The MF channels were removed, and the slide was rinsed in D-PBS and was subsequently incubated with D-PBS containing 1% BSA for 1 h to block nonspecific binding. Green CMFDA-labeled LS174T colon carcinoma cells and red SNARF-stained polymorphonuclear leukocytes (PMNs) were mixed at a 4:1 ratio and either (1) incubated at room temperature for 1/2 h or (2) perfused over anti-CD66de and anti-CD162 patterned glass substrate at 0.35 dyn/cm2 for 30 min, using a parallel plate flow chamber (which is 10 mm wide, 29 mm long, and 168 μm deep) before imaging using an inverted fluorescent microscope (Nikon TE 300) with a 10× objective configured to a DAGE-MTI camera. Negative control experiments similar to those in example 2 were performed in this study.
Comparative Cell Adhesion to Micropatches versus Uniformly Coated Surfaces
Standard photolithographic methods were used to create features (5 μm patches separated by 40 μm) as the aspect ratio of the features was incompatible with conventional soft lithography. A positive photoresist, S1813 (Rohm & Haas, Massachusetts), was spun onto a glass slide for 40 s at 5000 rpm. Half of the slide was protected with Teflon tape. The Teflon tape was then removed, and the slide was heated to 120 °C for 3 min followed by UV (350−450 nm) exposure for 20 s through a chrome mask. The slide was left at room temperature for 30 min and developed with MF-CD-26 (Rohm & Hass). The slide, half bare and half patterned with photoresist, was incubated with 0.1% OTS solution for 1 min and rinsed with hexane. The photoresist was then stripped off by sonication in acetone. The slide was successively incubated with 20% PEG-silane for 1 h at 90 °C, FITC−anti-human IgG Fc for 15 min, and finally 5 μg/mL E-selectin Fc for 30 min. The remaining areas were blocked with D-PBS containing 1% BSA for 30 min. The glass slide thus presented both 5 μm square patches and uniform regions of E-selectin surrounded by inert PEG. LS174T cells (106 cells/mL) were then perfused over this slide at a wall shear stress of either 0.70 or 0.35 dyn/cm.(2) Average rolling velocities were computed using Optima software as previously described.(70) The residence time was calculated by counting the number of frames a cell was tethered and relating it to the rate of frame acquisition.
As a negative control, micropatterned surfaces were prepared lacking E-selectin, but rather presenting FITC−anti-human IgG Fc and PEG patches in geometries similar to those of the patterned substrates and uniform regions used in the cell adhesion experiments. As a positive control we documented the E-selectin activity on the patterned regions and the uniform regions via fluorescence microscopy as described below.
Fluorescence Imaging and Intensity Measurements
To characterize the E-selectin (CD62E) surface density on the slide prepared as outlined in the previous section, an additional incubation step with PE-conjugated anti-CD62E mAb was performed for 30 min instead of BSA blocking. The slide was observed under a microscope (3-I Marianas) equipped with dual Cascade II 512 EM cameras (which can capture over 65 000 gray levels) using a 40× oil immersion objective. Antifade DABCO was applied to the slide to retard photobleaching. The gray scale intensities between the patches and the uniform region at least 200 μm away from all edges were compared using ImageJ.
Colon Carcinoma Cell Culture and Staining
LS174T colon carcinoma cells (American Tissue Culture Collection, Manassas, VA) were cultured and harvested as previously described.(70) LS174T cells were incubated with a 5 μM concentration of either SNARF or CMFDA for 1 h at 37 °C and subsequently washed with D-PBS once to remove excess dye. The cells were then resuspended in D-PBS and 0.1% BSA at a concentration of 107 cells/mL and maintained at 4 °C for no longer than 3 h before use in binding assays or in flow cytometry.
PMN Isolation and Labeling
PMNs were isolated from healthy human subjects as previously described and suspended in Ca2+/Mg2+-free D-PBS and 0.1% BSA at a concentration of 107 cells/mL.(71) The PMNs were then incubated with 5 μM SNARF at 4 °C for 1 h, washed once to remove excess dye, resuspended in Ca2+/Mg2+-free D-PBS and 0.1% BSA at a concentration of 107 cells/mL, and maintained at 4 °C before use in adhesion assays.
Flow Cytometry
The expression levels of CD66 and CD162 on the surface of LS174T colon carcinoma cells and PMN leukocytes were assessed by direct single-color immunofluorescence assays. In particular, LS174T cells and PMNs (2 × 10⁶ cells/mL) were incubated with either PE-conjugated anti-human CD66acde or antihuman CD162 mAb or an appropriate IgG isotype control for each for 1 h. The specimens were then diluted (to 1 × 10⁶ cells/mL) with D-PBS and 0.1% BSA before analysis by flow cytometry.(70)
Results and Discussion
Four examples of multifunctional surfaces are given. First, trifunctional surfaces are created presenting two proteins in distinct discrete patches surrounded by inert PEG-functionalized regions. In the second and third examples, respectively, trifunctional surfaces are used to capture and pattern cells from a single cell suspension and to sort and pattern cells from a mixed suspension. In the fourth example, a bifunctional surface presenting a binding ligand in discrete patches is used to identify critical length scales and associated shear stresses in the adhesion of suspension cells.
In the first example, a trifunctional surface presenting discrete patches of green fluorescent FITC-labeled anti-IgG antibody and red fluorescent PE-conjugated anti-IgG antibody surrounded by continuous PEG-functionalized regions was created, as shown in Figure 2a−d. μCP was used to define 45 μm square OTS-covered regions surrounded by PEG-silane; the OTS-covered regions were filled using an MF network with 200 μm wide channels, through which the FITC-labeled anti-IgG antibody was introduced, and 100 μm wide channels, through which the PE-labeled anti-IgG antibody was infused. The antibodies adhered only to the OTS-printed, but not PEGylated, regions to form discrete patches. Figure 2e was obtained under similar conditions except that 25 μm lines of OTS were printed onto the glass substrate prior to the MF step. Figure 2f is an example of the continuous pattern created in the absence of the μCP step. By using fluorescently labeled proteins, we are able to show the spatial discrimination of the patterns formed by protein adsorption conformed to the geometry dictated by the OTS patches and the MF channels.
Figure 2.

(a, b) Fluorescence images of PE-labeled (red) and FITC-labeled (green) anti-IgG Ab introduced via 100 and 200 μm MF channels, respectively, onto an array of 45 μm OTS squares on otherwise PEG-functionalized glass. The proteins adsorb onto the OTS patches. (c) and (d) are magnified images of the PE- and FITC-labeled anti-IgG Ab on the OTS squares. (e) is obtained under conditions similar to those of (a) and (b) except that 25 μm OTS lines (instead of squares) are printed onto the glass slide before the MF step. (f) shows the protein adsorption pattern of 200 μm lines of PE-labeled anti IgG Ab when the μCP step is omitted. For the multicolored images shown here, two separate gray scale images of the fluorophores are taken, color labeled, and merged with ImageJ. Scale bars are 200 μm.
In the second example, a trifunctional surface was generated which presents discrete patches covered with an anti-CD44 mAb or with an inert serum protein (FITC-conjugated BSA) surrounded by inert PEG-functionalized regions. Anti-CD44 mAb was selected because the adhesion of CD44-expressing LS174T colon carcinoma cells to host cells and/or ECM proteins such as fibrin(ogen) is implicated in cancer metastasis.70,72 Hence, these cells adhere specifically to anti-CD44 mAbʼs, so a surface presenting such antibodies could be used for cell capture. In Figure 3, we illustrate this concept with a surface that presents 65 μm square patches presenting either anti-CD44 mAb or FITC−BSA surrounded by PEG-silane on glass. Subsequently, a suspension of SNARF-stained LS174T colon carcinoma cells was placed on the micropatterned slide and allowed to incubate for 30 min at 37 °C under static conditions. As shown in panels a and b of Figure 3, the cells bound extensively and selectively to the anti-CD44-covered regions. Both the BSA- and PEG-covered areas remained relatively cell-free; i.e., about 10% of the cells were bound nonspecifically to these regions. As a negative control, micropatterned surfaces were prepared presenting no antibody, but patterned with OTS regions passivated with BSA and PEG patches in geometries similar to those of the patterned substrates used in the cell binding experiments. These substrates did not bind cells, save for some weak nonspecific binding in the BSA-covered regions (data not shown). Figure 3c shows an example of the continuous pattern of the cells created in the absence of the μCP step. This example illustrates the ability to trap cells from a static adhesion assay on discrete patches of the anti-CD44 antibody, with only weak nonspecific adhesion to the nonactive area. Furthermore, the ability to capture cells using an antibody immobilized to a surface provides evidence that the biological activity of the antibody is preserved in these assays.
Figure 3.
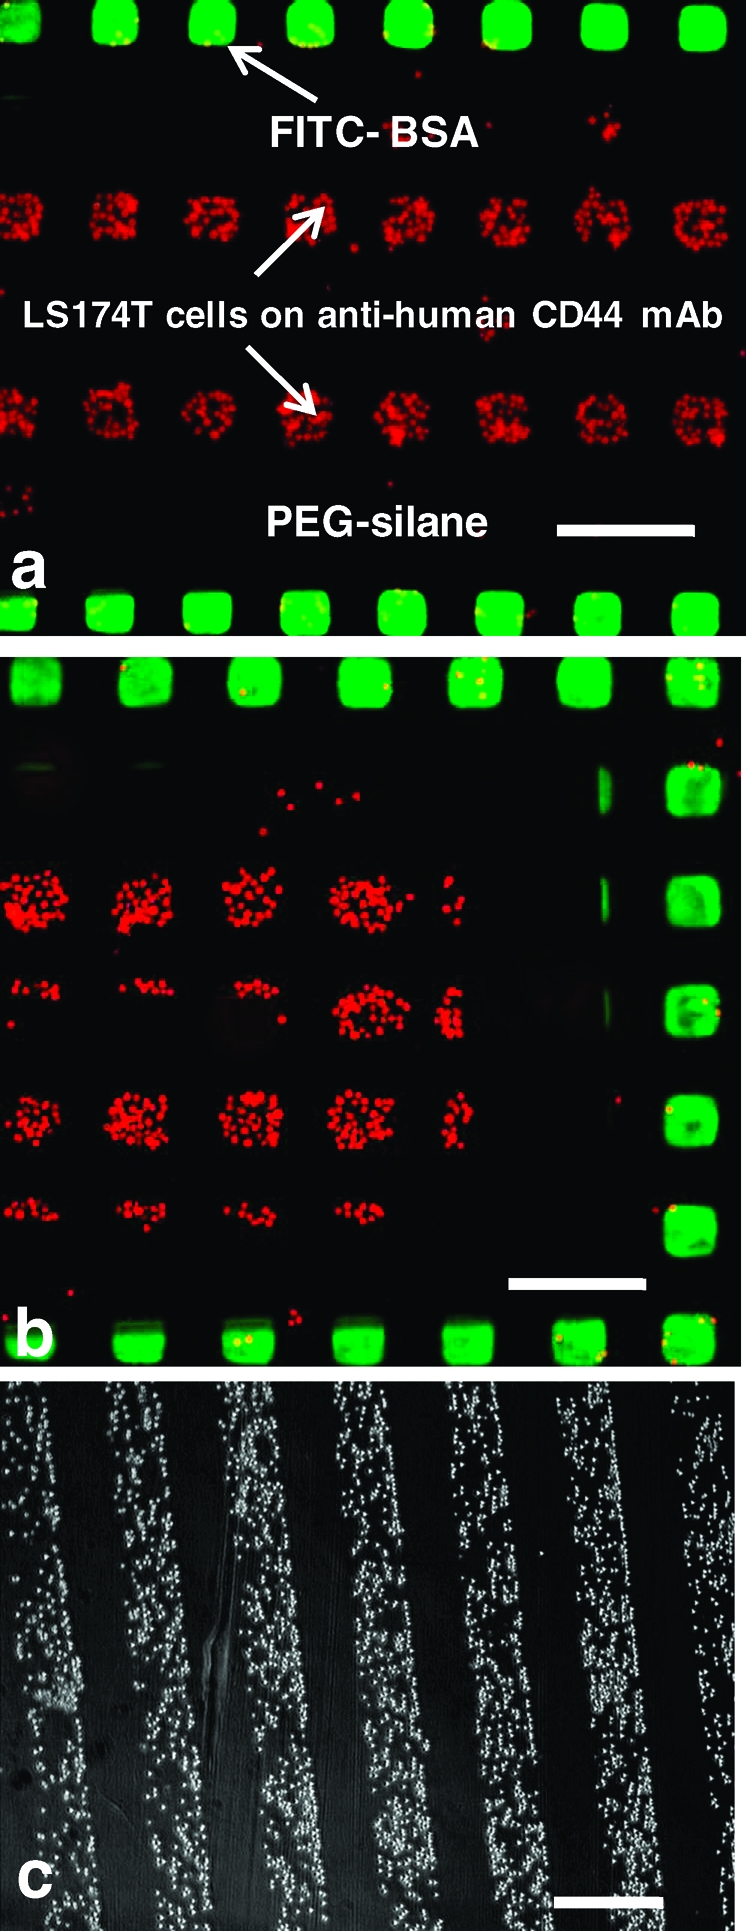
(a, b) Fluorescence images of 65 μm squares of patterned FITC-labeled BSA (green) and SNARF-stained LS174T colon carcinoma cells (red) surrounded by PEG-functionalized regions (black). The cells are bound primarily to regions of the glass slide which present the anti-human CD44 mAb. The PEG-functionalized regions are relatively cell free. The scale bar is 200 μm. (c) is a phase contrast image of the cell pattern obtained in the absence of the μCP step corresponding to Figure 2f. The scale bar is 400 μm. For the multicolored images shown here, two separate gray scale images of the fluorophores are taken, color labeled, and merged with ImageJ.
In the third example, we applied this methodology to sort cells from a mixed suspension of PMN leukocytes and LS174T colon carcinoma cells to spatially prescribed microdomains on a surface. To this end, a glass slide was patterned with anti-CD162 and anti-CD66de mAbʼs in discrete patches surrounded by inert PEG-functionalized regions. CD162, also known as P-selectin glycoprotein ligand-1 (PSGL-1), is selectively expressed on the surface of different leukocyte subpopulations, including PMNs.(13) CD66e is a member of the carcinoembryonic antigen family (CEA) and represents one of the most extensively used clinical tumor markers due to its limited expression in adult normal tissue and cells and high expression levels in a wide variety of tumor cell types.(73) Due to the specific nature of antibody−antigen interaction, we were able to sort PMNs and LS174T cells into discrete patches by employing two different experimental protocols. In both cases, PMNs adhered extensively to the anti-CD162-coated patches driven by the high affinity of this antibody for PSGL-1. In the first protocol, a mixed suspension of cells was allowed to incubate with the micropatterned surface under static (no-flow) conditions (Figure 4a). In the second protocol, the cell suspension was perfused over the micropatterned surface under controlled kinematic conditions by the use of a parallel plate flow chamber which mimics the shear environment of the circulatory system. The adhesion of PMNs on these patches was observed dynamically in the flow experiments; colony-like islands of cells consisting exclusively of PMNs on the anti-CD162 patches formed within minutes after the initiation of the fluid flow (Figure 4b).
Figure 4.

Sorting of a 4:1 mixture of CMFDA-labeled LS174T colon carcinoma cells (green) and SNARF-stained PMNs (red) on anti-CD162 and anti-CD66de mAb micropatterned glass slides surrounded by PEG-functionalized regions. (a) The cell mixture was incubated for 30 min on the slide. (b) The cell mixture was perfused over the micropatterned glass slide through a parallel plate flow chamber assay at 0.35 dyn/cm2. For the multicolored images shown here, two separate gray scale images of the fluorophores are taken, color labeled, and merged with ImageJ. The scale bars represent 100 μm.
In marked contrast, the CD162-negative LS174T colon carcinoma cells failed to bind to the anti-CD162-coated microregions even after prolonged static incubations or long perfusion times. As expected, LS174T cells bound avidly to the anti-CD66de-decorated patches (Figure 4). Microscopic observations reveal the presence of a small number of PMNs captured on the anti-CD66de-coated microregions (i.e., PMNs represented 25.5% of the cells adhered to these microregions in the static experiments and 19.7% under flow conditions) and minimal nonspecific binding of PMNs to the PEG-functionalized regions. These observations motivated the characterization of CD66de expression levels on the surface of both PMNs and LS174T cells using direct single-color immunofluorescence assay. CD66acd is not expressed by the LS174T cells,(73) whereas CD66e was abundantly expressed on the surface of these cells, as shown in Figure 5a. CD66acde is moderately expressed on the PMN surface (see Figure 5b). Consequently, the presence of PMNs on the anti-CD66de-coated patches could be attributed primarily to the CD66de expression detected on their surfaces. We have thus demonstrated herein the ability of this technique to sort cells by their capture to appropriate antibody-coated patches driven by the high affinity of the biologically active antibodies for their respective receptors on the cells.
Figure 5.

Surface densities of CD66 and CD162 molecules on PMNs and LS174T cells measured by flow cytometry. (a) Cells were incubated with PE-conjugated anti-CD162 mAbʼs or with an isotype-matched control mAb. (b) Cells were incubated with PE-conjugated anti-CD66acde mAbʼs or with an isotype-matched control mAb. The numbers in parentheses indicate the mean fluorescence intensity.
As a fourth example, a surface was designed to explore the role of the patch size in the adhesion of suspension cells under flow. The surface was bifunctional, patterned over half its area with discrete patches of immobilized E-selectin surrounded by inert PEG-functionalized regions and uniformly functionalized with E-selectin on the other half as shown in the SEM images in Figure 6 a,b. In both regions, an E-selectin−Ig chimera was bound to the surface in the proper orientation by first immobilizing an FITC−anti-human IgG Fc onto the OTS patches. The dual-patterned nature of the substrate allowed direct comparison of the extent of colon carcinoma cell adhesion to the E-selectin-decorated patches versus uniformly E-selectin-coated regions. Quantitative fluorescence microscopy utilizing a PE-conjugated anti-E-selectin mAb was employed to compare the E-selectin site density on the micropatches to that on the uniformly coated region. Our data disclose that the E-selectin surface densities are equivalent in both micropatterned (10291 ± 1189) and uniform (10481 ± 1511) regions, as assessed by gray scale fluorescence intensity measurements reported in Figure 7.
Figure 6.

LS174T colon carcinoma cells tether on an E-selectin (5 μg/mL) patterned glass slide. The slide was uniformly functionalized with E-selectin on half its area and with discrete patches of immobilized E-selectin surrounded by inert PEG-functionalized regions on the other half. (a) and (b) are scanning electron microscopy images of the photoresist templates of the two regions, respectively, on the same slide, taken at least 200 μm away from all the edges. The scale bar represents 40 μm. (a) LS174T cells were perfused through uniform E-selectin (c) and patches of E-selectin (d) at 0.70 dyn/cm2. (b) LS174T cells were perfused over uniform E-selectin (e) and patches of E-selectin (f) at 0.35 dyn/cm2. The red arrows indicate the transient cell binding to E-selectin patches. The scale bar represents 100 μm.
Figure 7.

Pseudocolor fluorescence images of PE-anti CD62E mAb (red) binding to E-selectin Fc and the corresponding 3D gray scale surface profile generated using ImageJ. To characterize E-selectin surface densities, gray scale data were averaged over three different locations, each on two substrates. (a, b) For 5 μm patches surrounded by PEG-functionalized regions the fluorescence intensity in the functionalized patches was 10291 ± 1189. (c, d) For the uniformly E-selectin-functionalized region, the fluorescence intensity was 10481 ± 1511. These data are representative except for a transition region of width less than 200 μm between the uniformly functionalized and patterned regions. The scale bar represents 40 μm.
In this assay, the patch size of 5 × 5 μm was chosen to be on the order of the cell diameter to eliminate secondary cell−cell interactions. The cell adhesion studies were performed in a flow chamber that allowed control over the wall shear stress level; both the micropatterned regions and uniformly coated regions could be observed. At a wall shear stress level of 0.70 dyn/cm2, LS174T cells tethered and rolled along the uniformly functionalized substrate with an average rolling velocity of 4.52 μm/s (Figure 6c), but were apparently unretarded by the micropatches (Figure 6d).
Lowering the wall shear stress to 0.35 dyn/cm2 resulted in an expected decrease in the average cell rolling velocity to 2.93 μm/s (p < 0.01) in the uniform region (Figure 6e). Most importantly, the decrease in wall shear stress resulted in intermittent cell tethering to the patches, with cells pausing, spending an average residence time of 0.64 s, and subsequently detaching into the flowing stream (Figure 6f). These results are summarized in Table 1. Furthermore, a fraction of these LS174T cells were able to rebind to E-selectin patches located downstream of the initial contact domain. This transient tethering behavior is distinctly different from that of the stable rolling behavior observed in the uniform surface control and reveals a dependence of the cellular adhesion event on the length scale of the functionalized regions. As a negative control, micropatterned surfaces were prepared lacking E-selectin, but rather presenting FITC−anti-human IgG Fc and PEG patches in the same patterned geometries and uniform regions used in the cell adhesion experiments. These substrates failed to capture cells under shear flow (data not shown), thereby confirming the requirement of E-selectin in specific cell tethering events. In this example, we illustrate the ability to immobilize the protein E-selectin in its physiological orientation on a substrate using a sandwich immobilization method. The protein maintains its biological activity as evidenced by flow-based adhesion assays and fluorescence microscopy experiments. The shear-dependent cell tethering events identified in this example can be attributed to the length scale of the receptor patch. Moreover, this assay can be used to extract important kinetic parameters of receptor−ligand binding.
Table 1. Average Rolling Velocities of LS174T Cells Tethered to Uniform E-selectin and Average Residence Time of LS174T Cells over Patches of E-selectin at Shear Stresses of 0.70 and 0.35 dyn/cm2 a.
| average rolling velocity (μm/s) |
average residence time (s) | ||
|---|---|---|---|
| shear stress (dyn/cm2) | hemodynamic free cell | cells tethered to the uniform surface | cells bound to the patch area |
| 0.70 | 554 ± 26 | 4.52 ± 0.44 | no binding |
| 0.35 | ndb | 2.93 ± 0.26c | 0.64 ± 0.08 |
At least 30 cells were tracked for calculating the average rolling velocity under each condition, and the mean is reported with the standard error.
nd = not determined.
P value <0.01.
Our technique builds upon other technologies in which proteins can be immobilized and retain their ability to participate in molecular recognition events. For example, the exploitation of immobilized proteins pervades modern separation techniques (e.g., affinity chromatography,(74) immunoprecipitation,(75) Western blotting(76)), sensor and cell binding biophysical studies (enzyme-linked immunosorbant assay (ELISA),76–78 surface plasmon resonance (SPR),(79) blot rolling,70,80 and cell-free bead adhesion assays(81)). In all of these examples, proteins in solution are affixed to the substrate by sandwich immobilization techniques or by physisorption or chemisorption. Proteins exploited in these assays include adhesion receptors,(70) enzymes (trypsin),(82) regulatory proteins (insulin),(83) transport proteins (hemoglobin),84,85 contractile and motile proteins (actin),(86) structural proteins (collagen),(87) and protective and exploitive proteins (antibodies, thrombin).(88) We further note that there are indeed proteins (predominantly soluble proteins such as fibrinogen) for which the immobilization induces structural changes that affect their binding properties, which are therefore not commonly exploited in immobilized form.
Conclusions
We have presented a novel method for creating multifunctional surfaces which present proteins in well-defined regions. The method relies on the serial application of μCP and MF, thus allowing control over the shape, size, and chemical functionality of the discrete functionalized patches. The potential utility of this method has been demonstrated in four examples. These examples point to the versatility of the technique, in which an arbitrary number of proteins can be presented in patches with highly reproducible surface coverages, as supported by fluorescence intensity measurements. These proteins retain their activities, as substantiated by their ability to interact with either antibodies in solution or receptors presented by cells. We have further shown that these patches can be used to selectively sort cells, with potential in the sensing and diagnostics of disease states, or to study the biophysics of cellular adhesion.
Acknowledgments
M.G., C.A., and Z.T. contributed equally to this work. This work was supported by NSF Grant CBET 0244592 (K.J.S., M.G.), NIH/NCI Grant CA101135 (K.K.), an AHA grant in aid (K.K., K.J.S.), a predoctoral fellowship from AHA (C.A.), and the NSF-IGERT Program by NSF Grant DGE-0549350 (Z.T.). The assistance of the Integrated Imaging Center at Johns Hopkins University is gratefully acknowledged.
Funding Statement
National Institutes of Health, United States
References
- Kastrup C. J.; Runyon M. K.; Shen F.; Ismagilov R. F. Proc. Natl. Acad. Sci. U.S.A. 2006, 103, 15747–15752. [DOI] [PMC free article] [PubMed] [Google Scholar]
- Singhvi R.; Kumar A.; Lopez G. P.; Stephanopoulos G. N.; Wang D. I.; Whitesides G. M.; Ingber D. E. Science 1994, 264, 696–698. [DOI] [PubMed] [Google Scholar]
- Folch A.; Toner M. Biotechnol. Prog. 1998, 14, 388–392. [DOI] [PubMed] [Google Scholar]
- Bhatia S. N.; Yarmush M. L.; Toner M. J. Biomed. Mater. Res. 1997, 34, 189–199. [DOI] [PubMed] [Google Scholar]
- Kleinfeld D.; Kahler K. H.; Hockberger P. E. J. Neurosci. 1988, 8, 4098–4120. [DOI] [PMC free article] [PubMed] [Google Scholar]
- Saneinejad S.; Shoichet M. S. J. Biomed. Mater. Res. 1998, 42, 13–19. [DOI] [PubMed] [Google Scholar]
- Brock A.; Chang E.; Ho C. C.; LeDuc P.; Jiang X.; Whitesides G. M.; Ingber D. E. Langmuir 2003, 19, 1611–1617. [DOI] [PubMed] [Google Scholar]
- Watt F. M.; Jordan P. W.; O’Neill C. H. Proc. Natl. Acad. Sci. U.S.A. 1988, 85, 5576. [DOI] [PMC free article] [PubMed] [Google Scholar]
- Chen C. S.; Mrksich M.; Huang S.; Whitesides G. M.; Ingber D. E. Science 1997, 276, 1425–1428. [DOI] [PubMed] [Google Scholar]
- Wu C. C.; Li Y. S.; Haga J. H.; Kaunas R.; Chiu J. J.; Su F. C.; Usami S.; Chien S. Proc. Natl. Acad. Sci. U.S.A. 2007, 104, 1254–1259. [DOI] [PMC free article] [PubMed] [Google Scholar]
- Peerani R.; Rao B. M.; Bauwens C.; Yin T.; Wood G. A.; Nagy A.; Kumacheva E.; Zandstra P. W. EMBO J. 2007, 26, 4744–4755. [DOI] [PMC free article] [PubMed] [Google Scholar]
- Kumar G.; Ho C. C.; Co C. C. Adv. Mater. 2007, 19, 1084–1090. [Google Scholar]
- Konstantopoulos K.; Kukreti S.; McIntire L. V. Adv. Drug Delivery Rev. 1998, 33, 141–164. [DOI] [PubMed] [Google Scholar]
- Mrksich M. Chem. Soc. Rev. 2000, 29, 267–273. [Google Scholar]
- Falconnet D.; Csucs G.; Grandin H. M.; Textor M. Biomaterials 2006, 27, 3044–3063. [DOI] [PubMed] [Google Scholar]
- Park T. H.; Shuler M. L. Biotechnol. Prog. 2003, 19, 243–253. [DOI] [PubMed] [Google Scholar]
- Yap F. L.; Zhang Y. Biosens. Bioelectron. 2007, 22, 775–788. [DOI] [PubMed] [Google Scholar]
- Lee K. B.; Park S. J.; Mirkin C. A.; Smith J. C.; Mrksich M. Science 2002, 295, 1702–1705. [DOI] [PubMed] [Google Scholar]
- Leung O. M.; Goh M. C. Science 1992, 255, 64–66. [DOI] [PubMed] [Google Scholar]
- Rundqvist J.; Hoh J. H.; Haviland D. B. Langmuir 2006, 22, 5100–5107. [DOI] [PubMed] [Google Scholar]
- Rundqvist J.; Mendoza B.; Werbin J. L.; Heinz W. F.; Lemmon C.; Romer L. H.; Haviland D. B.; Hoh J. H. J. Am. Chem. Soc. 2007, 129, 59–67. [DOI] [PubMed] [Google Scholar]
- Cherniavskaya O.; Chen C. J.; Heller E.; Sun E.; Provezano J.; Kam L.; Hone J.; Sheetz M. P.; Wind S. J. J. Vac. Sci. Technol., B 2005, 23, 2972–2978. [Google Scholar]
- Crommie M. F.; Lutz C. P.; Eigler D. M. Science 1993, 262, 218–220. [DOI] [PubMed] [Google Scholar]
- Hong S. H.; Mirkin C. A. Science 2000, 288, 1808–1811. [DOI] [PubMed] [Google Scholar]
- Vettiger P.; Despont M.; Drechsler U.; Durig U.; Haberle W.; Lutwyche M. I.; Rothuizen H. E.; Stutz R.; Widmer R.; Binnig G. K. IBM J. Res. Dev. 2000, 44, 323–340. [Google Scholar]
- Xu J. T.; Lynch M.; Nettikadan S.; Mosher C.; Vegasandra S.; Henderson E. Sens. Actuators, B 2006, 113, 1034–1041. [Google Scholar]
- Chou S. Y.; Krauss P. R.; Remstrom P. J. J. Vac. Sci. Technol., B 1996, 14, 4129–4133. [Google Scholar]
- Parashkov R.; Becker E.; Riedl T.; Johannes H. H.; Kowalsky W. Proc. IEEE 2005, 93, 1321–1329. [Google Scholar]
- Healy K. E.; Lom B.; Hockberger P. E. Biotechnol. Bioeng. 1994, 43, 792–800. [DOI] [PubMed] [Google Scholar]
- Healy K. E.; Thomas C. H.; Rezania A.; Kim J. E.; McKeown P. J.; Lom B.; Hockberger P. E. Biomaterials 1996, 17, 195–208. [DOI] [PubMed] [Google Scholar]
- Scotchford C. A.; Ball M.; Winkelmann M.; Voros J.; Csucs C.; Brunette D. M.; Danuser G.; Textor M. Biomaterials 2003, 24, 1147–1158. [DOI] [PubMed] [Google Scholar]
- Lom B.; Healy K. E.; Hockberger P. E. J. Neurosci. Methods 1993, 50, 385–397. [DOI] [PubMed] [Google Scholar]
- Corey J. M.; Wheeler B. C.; Brewer G. J. IEEE Trans. Biomed. Eng. 1996, 43, 944–955. [DOI] [PubMed] [Google Scholar]
- Mrksich M.; Whitesides G. M. Annu. Rev. Biophys. Biomol. Struct. 1996, 25, 55–78. [DOI] [PubMed] [Google Scholar]
- Mrksich M.; Dike L. E.; Tien J.; Ingber D. E.; Whitesides G. M. Exp. Cell Res. 1997, 235, 305–313. [DOI] [PubMed] [Google Scholar]
- Kane R. S.; Takayama S.; Ostuni E.; Ingber D. E.; Whitesides G. M. Biomaterials 1999, 20, 2363–2376. [DOI] [PubMed] [Google Scholar]
- Ostuni E.; Yan L.; Whitesides G. M. Colloids Surf., B 1999, 15, 3–30. [Google Scholar]
- Tan J. L.; Tien J.; Chen C. S. Langmuir 2002, 18, 519–523. [Google Scholar]
- St John P. M.; Kam L.; Turner S. W.; Craighead H. G.; Issacson M.; Turner J. N.; Shain W. J. Neurosci. Methods 1997, 75, 171–177. [DOI] [PubMed] [Google Scholar]
- James C. D.; Davis R. C.; Kam L.; Craighead H. G.; Isaacson M.; Turner J. N.; Shain W. Langmuir 1998, 14, 741–744. [Google Scholar]
- Wu L. Q.; Payne G. F. Trends Biotechnol. 2004, 22, 593–599. [DOI] [PubMed] [Google Scholar]
- Lussi J. W.; Michel R.; Reviakine I.; Falconnet D.; Goessl A.; Csucs G.; Hubbell J. A.; Textor M. Prog. Surf. Sci. 2004, 76, 55–69. [Google Scholar]
- Chang Y.; Ahn Y. S.; Hahn H. T.; Chen Y. Langmuir 2007, 23, 4112–4114. [DOI] [PubMed] [Google Scholar]
- Younes-Metzler O.; Ben R. N.; Giorgi J. B. Langmuir 2007, 23, 11355–11359. [DOI] [PubMed] [Google Scholar]
- Veiseh M.; Veiseh O.; Martin M. C.; Asphahani F.; Zhang M. Q. Langmuir 2007, 23, 4472–4479. [DOI] [PMC free article] [PubMed] [Google Scholar]
- Westcott N. P.; Yousaf M. N. Langmuir 2008, 24, 2261–2265. [DOI] [PubMed] [Google Scholar]
- Satomi T.; Nagasaki Y.; Kobayashi H.; Otsuka H.; Kataoka K. Langmuir 2007, 23, 6698–6703. [DOI] [PubMed] [Google Scholar]
- Pla-Roca M.; Fernandez J. G.; Mills C. A.; Martinez E.; Samitier J. Langmuir 2007, 23, 8614–8618. [DOI] [PubMed] [Google Scholar]
- Hui E. E.; Bhatia S. N. Langmuir 2007, 23, 4103–4107. [DOI] [PMC free article] [PubMed] [Google Scholar]
- Renault J. P.; Bernard A.; Bietsch A.; Michel B.; Bosshard H. R.; Delamarche E.; Kreiter M.; Hecht B.; Wild U. P. J. Phys. Chem. B 2003, 107, 703–711. [Google Scholar]
- Foley J.; Schmid H.; Stutz R.; Delamarche E. Langmuir 2005, 21, 11296–11303. [DOI] [PubMed] [Google Scholar]
- Bernard A.; Delamarche E.; Schmid H.; Michel B.; Bosshard H. R.; Biebuyck H. Langmuir 1998, 14, 2225–2229. [Google Scholar]
- Li H. W.; Muir B. V. O.; Fichet G.; Huck W. T. S. Langmuir 2003, 19, 1963–1965. [Google Scholar]
- Liu V. A.; Jastromb W. E.; Bhatia S. N. J. Biomed. Mater. Res. 2002, 60, 126–134. [DOI] [PubMed] [Google Scholar]
- Michel B.; Bernard A.; Bietsch A.; Delamarche E.; Geissler M.; Juncker D.; Kind H.; Renault J. P.; Rothuizen H.; Schmid H.; Schmidt-Winkel P.; Stutz R.; Wolf H. IBM J. Res. Dev. 2001, 45, 697–719. [Google Scholar]
- Renault J. P.; Bernard A.; Juncker D.; Michel B.; Bosshard H. R.; Delamarche E. Angew. Chem., Int. Ed. 2002, 41, 2320–2323. [DOI] [PubMed] [Google Scholar]
- Bernard A.; Renault J. P.; Michel B.; Bosshard H. R.; Delamarche E. Adv. Mater. 2000, 12, 1067. [Google Scholar]
- Tien J.; Nelson C. M.; Chen C. S. Proc. Natl. Acad. Sci. U.S.A. 2002, 99, 1758–1762. [DOI] [PMC free article] [PubMed] [Google Scholar]
- Delamarche E.; Bernard A.; Schmid H.; Michel B.; Biebuyck H. Science 1997, 276, 779–781. [DOI] [PubMed] [Google Scholar]
- Delamarche E.; Bernard A.; Schmid H.; Bietsch A.; Michel B.; Biebuyck H. J. Am. Chem. Soc. 1998, 120, 500–508. [Google Scholar]
- Delamarche E.; Juncker D.; Schmid H. Adv. Mater. 2005, 17, 2911. [DOI] [PubMed] [Google Scholar]
- Chiu D. T.; Jeon N. L.; Huang S.; Kane R. S.; Wargo C. J.; Choi I. S.; Ingber D. E.; Whitesides G. M. Proc. Natl. Acad. Sci. U.S.A. 2000, 97, 2408–2413. [DOI] [PMC free article] [PubMed] [Google Scholar]
- Bernard A.; Michel B.; Delamarche E. Anal. Chem. 2001, 73, 8–12. [DOI] [PubMed] [Google Scholar]
- Su J.; Bringer M. R.; Ismagilov R. F.; Mrksich M. J. Am. Chem. Soc. 2005, 127, 7280–7281. [DOI] [PubMed] [Google Scholar]
- Okorie U. M.; Diamond S. L. Biophys. J. 2006, 91, 3474–3481. [DOI] [PMC free article] [PubMed] [Google Scholar]
- Sapsford K. E.; Ligler F. S. Biosens. Bioelectron. 2004, 19, 1045–1055. [DOI] [PubMed] [Google Scholar]
- Xia Y.; Whitesides G. M. Annu. Rev. Mater. Sci. 1998, 28, 153. [Google Scholar]
- Veiseh M.; Zareie M. H.; Zhang M. Q. Langmuir 2002, 18, 6671–6678. [Google Scholar]
- Burdick M. M.; Konstantopoulos K. Am. J. Physiol. Cell Physiol. 2004, 287, C539–547. [DOI] [PubMed] [Google Scholar]
- Napier S. L.; Healy Z. R.; Schnaar R. L.; Konstantopoulos K. J. Biol. Chem. 2007, 282, 3433–3441. [DOI] [PubMed] [Google Scholar]
- Jadhav S.; Konstantopoulos K. Am. J. Physiol. Cell Physiol. 2002, 283, C1133–1143. [DOI] [PubMed] [Google Scholar]
- Alves C. S.; Burdick M. M.; Thomas S. N.; Pawar P.; Konstantopoulos K. Am. J. Physiol. Cell Physiol. 2008, 294, C907–916. [DOI] [PubMed] [Google Scholar]
- Thomas S. N.; Zhu F.; Schnaar R. L.; Alves C. S.; Konstantopoulos K.. J. Biol. Chem. 2008, 283 (23), 15637–15655. [DOI] [PMC free article] [PubMed] [Google Scholar]
- Kerrigan L. A.; Kadonaga J. T.. Current Protocols in Molecular Biology; John Wiley & Sons: New York, 2001; Chapter 12. [DOI] [PubMed] [Google Scholar]
- Motherway M.; Tipton K. F.; McCarthy A. D.; Couee I.; Irwin J.. Current Protocols in Protein Science; John Wiley & Sons: New York, 2002; Chapter 1. [DOI] [PubMed] [Google Scholar]
- Ibarrola I.; Arilla M. C.; Herrero M. D.; Esteban M. I.; Martinez A.; Asturias J. A. J. Invest. Allergol. Clin. Immunol. 2008, 18, 78–83. [PubMed] [Google Scholar]
- Cervino C.; Weber E.; Knopp D.; Niessner R. J. Immunol. Methods 2008, 329, 184–193. [DOI] [PubMed] [Google Scholar]
- Stejskal D.; Karpisek M.; Reutova H.; Humenanska V.; Petzel M.; Kusnierova P.; Vareka I.; Varekova R.; Stejskal P. Gen. Physiol. Biophys. 2008, 27, 59–63. [PubMed] [Google Scholar]
- Makogonenko E.; Goldstein A. L.; Bishop P. D.; Medved L. Biochemistry 2004, 43, 10748–10756. [DOI] [PubMed] [Google Scholar]
- Sackstein R.; Fuhlbrigge R. Methods Mol. Biol. 2006, 341, 217–226. [DOI] [PubMed] [Google Scholar]
- Perret E.; Benoliel A. M.; Nassoy P.; Pierres A.; Delmas V.; Thiery J. P.; Bongrand P.; Feracci H. EMBO J. 2002, 21, 2537–2546. [DOI] [PMC free article] [PubMed] [Google Scholar]
- Kang K.; Kan C.; Yeung A.; Liu D. Macromol. Biosci. 2005, 5, 344–351. [DOI] [PubMed] [Google Scholar]
- Hatakeyama H.; Kikuchi A.; Yamato M.; Okano T. Biomaterials 2005, 26, 5167–5176. [DOI] [PubMed] [Google Scholar]
- Starodub N. F.; Samokhina L. M.; Rachkov A. E. Ukr. Biokhim. Zh. 1993, 65, 17–22. [PubMed] [Google Scholar]
- Sun H, H. N. Biophys. Chem. 2004, 110, 297–308. [DOI] [PubMed] [Google Scholar]
- Zamanou A.; Samiotaki M.; Panayotou G.; Margaritis L.; Lymberi P. J. Autoimmunol. 2003, 20, 333–344. [DOI] [PubMed] [Google Scholar]
- Lee D. W.; Piret J. M.; Gregory D.; Haddow D. J.; Kilburn D. G. Ann. N.Y. Acad. Sci. 1992, 665, 137–145. [DOI] [PubMed] [Google Scholar]
- Weeterings C.; Adelmeijer J.; Myles T.; de Groot P. G.; Lisman T. Arterioscler., Thromb., Vasc. Biol. 2006, 26, 670–675. [DOI] [PubMed] [Google Scholar]