

Abstract
MicroRNAs (miRNAs) play important roles in modulating gene expression at the posttranscriptional level. In postnatal oligodendrocyte lineage cells, the miRNA expression profile (“microRNAome”) contains 43 miRNAs whose expression dynamically changes during the transition from A2B5+ oligodendrocyte progenitor cells to premyelinating GalC+ cells. The combination of microRNAome profiling with analyses of the oligodendrocyte transcriptome reveals a target bias for a class of miRNAs which includes miR-9. We show that miR-9 is downregulated during oligodendrocyte differentiation. In addition, miR-9 expression level inversely correlates with the expression of its predicted targets, among which is the peripheral myelin protein PMP22. We found that PMP22 mRNA but not protein is detectable in oligodendrocytes, whereas Schwann cells producing PMP22 protein lack miR-9. We demonstrate that miR-9 interacts with the 3′ untranslated region of PMP22 and downregulates its expression. Our results support models in which miRNAs can act as guardians of the transcriptome.
Keywords: microRNA, posttranscriptional regulation, oligodendrocyte, PMP22, myelin, glia
Introduction
Oligodendrocytes are glial cells of the CNS that synthesize myelin, the multilamellar membrane ensheathing axons. Myelin enables saltatory conduction of neuronal action potentials. In the rodent CNS, oligodendrocyte progenitor cells (OPCs) arise in multiple ventral and dorsal locations of the forebrain through three independent proliferative waves during late embryogenesis and early postnatal periods (Kessaris et al., 2006). Elucidating the molecular mechanisms that control oligodendrocyte maturation requires examining stage-specific changes at both transcriptional and posttranscriptional levels, as oligodendrocyte lineage cells differentiate from immature OPCs into premyelinating cells (OLs).
MicroRNAs (miRNAs) belong to a class of small (∼22 nt) noncoding RNAs and are now recognized as integral components of the posttranscriptional silencing machinery. Half of mammalian miRNAs are processed from non-protein-coding units, whereas intronic miRNAs are found within the introns of coding mRNAs and are usually coordinately expressed with their host genes (Saini et al., 2007). miRNAs are transcribed as long primary transcripts (pri-miRNAs) and processed in the nucleus by the enzyme Drosha, yielding precursor miRNAs (pre-miRNAs). The pre-miRNAs harbor a characteristic stem-loop structure and are exported from the nucleus to the cytoplasm by Exportin 5 (Stefani and Slack, 2008). After processing by the RNase III type enzyme Dicer, a small double-stranded RNA is produced, from which the miRNA is released. miRNAs act to either catalyze mRNA degradation or repress translation through base pairing within the 3′ untranslated region (3′UTR) of mRNA targets (Valencia-Sanchez et al., 2006). Only a few targets of animal miRNAs are currently known (Ambros, 2004), and the search of mRNA targets mainly relies on bioinformatic analyses that are based on the phylogenetically conserved base pair complementarity between the targets and miRNAs. Historically, miRNAs were discovered as regulators of cell fate determination in C. elegans (Lee et al., 1993), and a more recent study showed that disruption of the Dicer gene in mouse Purkinje cells led to a size reduction of forebrain (Schaefer et al., 2007), in agreement with the important role of miRNAs during neuronal cell specification (Lai et al., 2005). The systematic cloning of miRNAs revealed the presence of several hundred distinct miRNAs in the rat (Miska et al., 2004), mouse, and human brain (Sempere et al., 2004). Sixty percent of known miRNAs are found in the brain. Among those, few are preferentially expressed in the brain, and these include miR-9, miR-124, and miR-128.
In this study, we identify 98 miRNAs expressed by postnatal oligodendrocyte lineage cells. We also show that 37 of these miRNAs display a mRNA target bias and that the expression level of the predicted targets of 13 miRNAs is dynamically regulated during oligodendrocyte differentiation. Additionally, we document the functional interaction of miR-9 with peripheral myelin protein 22 (PMP22) mRNA.
Materials and Methods
FACS of oligodendrocyte lineage cells.
Sprague Dawley rats (Taconic) were handled in accordance with NIH guidelines and as approved by the NINDS ACUC Committee. P7 rat brains were minced with a scalpel and incubated for 30 min in HBSS containing 20 mm HEPES buffer, 10 mm NaOH, 0.5 mm EDTA, 1 mm l-Cysteine (Sigma-Aldrich), and 3 mg/ml papain (Roche). After gentle trituration, the solution was filtered through a 75 μm cell strainer, and dissociated cells were layered on a discontinuous 15–40% Percoll gradient solution. The gradient tubes were centrifuged (2000 × g, 15 min), and the upper half that contained predominantly a layer of myelin debris was discarded. The cells found at the interface between the 15% and the 40% Percoll layers were then removed with a clean Pasteur pipette and transferred to a new tube. The cells were centrifuged and resuspended in PBS containing 3% BSA and 0.05% sodium azide (Sigma-Aldrich). The A2B5 mouse monoclonal IgM antibody (purified from the A2B5 hybridoma culture supernatant and coupled to biotin using the biotinylation kit from Pierce) and a GalC rabbit polyclonal antibody (AB142, Chemicon) were used for the immunostaining. After incubation with the primary antibodies at 4°C for 1 h, the cells were washed three times with PBS and labeled with a streptavidin-PE conjugate (SA1004–1, Caltag Laboratories) and a goat anti-rabbit IgG antibody conjugated to Alexa Fluor 488 (A11034, Invitrogen). The A2B5+ GalC− cells (OPCs) and A2B5− GalC+ cells (OLs) were sorted using a FACSVantageSE flow cytometer (Becton Dickinson) (Cohen et al., 2003). The CD11b antibody (clone OX42, MCA275R, AbD Serotec) and the CD45 antibody (clone OX-1, MCA43G, AbD Serotec) were detected using a goat anti-mouse IgG2a-PE-Cy5.5 antibody (M32218, Caltag) and a goat anti-mouse IgG1 Tricolor conjugate antibody (M32006, Caltag).
Cell culture and transfection.
Rat Schwann cell cultures were established from neonatal sciatic nerves as described previously (Weinmaster and Lemke, 1990). The Schwann cells were transfected using Lipofectamine/Plus reagent (Invitrogen). The pcDNA6.2-GW/EmGFP-miR-Neg plasmid (Invitrogen) was used as negative control. The pcDNA6.2-GW/EmGFP-miR-9 was constructed by inserting the sequence 5′-TGCTGTCTTTGGTTATCTAGCTGTATGAGTTTTGGCCACTGACTGACTCATACAGAGATAACCAA-3′ into the pcDNA6.2-GW/EmGFP-miR-Neg plasmid according to the manufacturer instructions. The Schwann cells were harvested 24 h after transfection for Northern blot or 48 h for Western blot analyses.
The HeLa cell line was grown in DMEM (Invitrogen) containing 10% FBS and 50 μg/ml gentamycin. For transient transfection, HeLa cells were transfected using Lipofectamine 2000 (Invitrogen), 200 ng of each reporter plasmid and 10 nm of the miRNA precursor (Ambion). The luciferase activities were measured 48 h after transfection using the Dual Luciferase Reporter Assay System (Promega).
Microarrays and bioinformatics analysis.
Four biological replicates of A2B5+ GalC− cells and A2B5− GalC+ cells were used for hybridization onto the Rat Expression 230 2.0 Microarrays (Affymetrix). The microarray data were analyzed using Genespring 7.0 software (Silicon Genetics). The data were processed using RMA (Robust Multi-Array) and a global normalization was performed using Genespring per chip normalization (normalized to the 50th percentile) and per gene normalization (normalized to the median).
Total RNA from A2B5+ GalC− cells and A2B5− GalC+ cells was purified using the mirVana miRNA Isolation Kit (Ambion) and used for hybridization onto the miRNA microarrays (LC Sciences). The slides were scanned using an Axon GenePix 4000B microarray scanner (Axon Instruments) and the microarray images were background subtracted using a local regression method and normalized to the statistical mean of all detectable miRNAs.
Target bias analysis was conducted using TargetScan 4.0 (www.targetscan.org) in conjunction with the Fisher's exact test function (fisher.test) found in the R language for statistical computing and graphics (www.r-project.org). For each miRNA and each defined window of genes (“Top,” “Middle,” “Bottom”), four values were determined: (1) the number of genes in the window the miRNA targets, (2) the number of genes in the window, (3) the number of genes the miRNA can target regardless of window, and (4) the number of genes assayed. The values were then used to generate a p value for each miRNA in the three defined window of genes using a right-tailed condition (“enrichment”). Hierarchical clustering of miRNAs was done using GenePattern 2.0 (Reich et al., 2006). The Ingenuity Pathway Analysis software (Ingenuity Systems) was used for the Gene Ontology (GO) analysis of the overlap between the A2B5+ GalC− bottom window and A2B5− GalC+ top window containing the predicted targets of miR-9.
Real-time PCR.
Total RNA (150 ng) was treated with Turbo DNase (Ambion) for 10 min at 37°C and used for the reverse transcription. First-strand synthesis was conducted using the Taqman Reverse Transcription Kit (Applied Biosystems). Real-time PCR was performed using a Taqman Array microRNA Panel v1.0 and the Taqman 2X Universal PCR Master Mix (Applied Biosystems). After analysis using the Applied Biosystems 7900HT Fast Real-Time PCR Systems, a geometric averaging on multiple miRNAs was performed to select miR-203 as reference for normalization.
Real-time PCR of PMP22 was conducted using the LightCycler FastStart DNA MasterPlus SYBR Green I (Roche) and the following primers: 5′-TCCTCATCTGTGAGCGAATG-3′ and 5′-ACAGACCAGCAAGGATTTGG-3′. The β-actin primers for the normalization were 5′-TGTCACCAACTGGGACGATA-3′ and 5′-GGGGTGTTGAAGGTCT-CAAA-3′.
The sequences of the primers used in real-time PCR analysis of neural markers were as follows: for oligodendrocyte markers: Gtx: forward: 5′-AGGTGAAGGTGTGGTTCCAG-3′ and reverse: 5′-TTCGAGGGTTTGTGCTTTTTG-3′; MBP: forward: 5′-GCAGAGGACCCAAGATGAAAAC-3′ and reverse: 5′-GAAGCTCTGCCTCCGTAGC-3′; MOBP: forward: 5′-CAAGAGCGGTTGCTTTTACC-3′ and reverse: 5′-TTTTTCTTGGGGTTGACCTG-3′; for astrocyte markers: Aqp4: forward: 5′-TGGGATCCTCTACCTGGTCA-3′ and reverse: 5′-AGCTGGCAAAAATGGTGAATAC-3′; GLT1: forward: 5′-CCATGCTCCTCATTCTCACAG-3′ and reverse: 5′-AATCGCCCACTACATTGACC-3′; GFAP: forward: 5′-CAGCGGCTCGAGAGAGATTC-3′ and reverse: 5′-TGTGAGGTCTGCAAACTTGG-3′; for neuronal markers: KCC2: forward: 5′-TCTCCATCCTGGCCATCTAC-3′ and reverse: 5′-GCTTGGCACAGACATCAAAG-3′; Syt1: forward: 5′-GCTTTGAAGTTCCGTTCGAG-3′ and reverse: 5′-CAACGAAGACTTTGCCGATG-3′; SNAP25: forward: 5′-CATCAGTGGTGGCTTCATCC-3′ and reverse: 5′-TATGACGGAGGTTTCCGATG-3′.
Northern blot.
miRNAs from adult tissues (Ambion) were separated by electrophoresis through a 15% TBE-urea gel (Invitrogen) and transferred to a GeneScreen Plus nylon membrane (Perkin-Elmer). After crosslinking, the membrane was incubated with 10 pmol of biotinylated Locked Nucleic Acid (biot-LNA, IDTDNA Technologies). The biot-LNA probe for miR-9 was 5′-5Biot-TCA+TAC+AGC+TAG+ATA+ACC+AAAGA-3′ (Biot = biotin and + denotes an LNA substitution). After incubation overnight at 42°C, the membrane was washed twice in NorthernMax Low Stringency Wash Solution and once in NorthernMax High Stringency Wash Solution (Ambion). The detection was conducted using the Chemiluminescent DNA Detection Kit (Pierce). The blots were stripped and probed for U6 small nuclear RNA with the U6 biot-LNA 5′-5Biot-GAA+TTT+GCG+TGT+CAT+CCT+TGC+GCA-3′.
Total RNA from rat Schwann cells (10 μg/lane) was separated on denaturing agarose gel and transferred overnight to a nylon membrane (Hybond). After UV-crosslinking, the membranes were incubated with 32P-labeled probes for PMP22 and 18S ribosomal RNA (Random Prime kit, Amersham). The blot was washed twice in 2× SSPE, 0.1% SDS at room temperature and once in 1× SSPE, 0.1% SDS at 65°C before exposure to the film.
Construction of luciferase reporter plasmids.
The full-length 3′UTR of PMP22 was amplified by PCR from rat sciatic nerves using the primers Full F1: 5′-AGGCCTCTCGAGGCGCCCGACGCACCATCCGTCTAGGC-3′ and Full R2: 5′-GTCGACGCGGCCGCGAGTTACTCTGATGTTTATTTTAATGCATC-3′. The XhoI-NotI fragment was cloned into the psiCHECK2 reporter plasmid (Promega). Three fragments of the 3′UTR were obtained by PCR using the following primers: for fragment 1: 5′-GACTCGAGGGAGGAAGGAAACCAGAAAAC-3′ and 5′-GAGCGGCCGCAATCCCCACTCAACTGTGTTCTG-3′; for fragment 2: 5′-GACTCGAGTGTCGATTGAAGATGTATAT-3′ and 5′-GAGCGGCCGCTCACTGGGTCACCCATAGTG-3′; for fragment 3: 5′-GACTCGAGATTTAGCAGGAATAATCCGC-3′ and 5′-GTCGACGCGGCCGCGAGTTACTCTGATGTTTATTTTAATGCATC-3′.
The (PMP del. repeat) plasmid was made by overlap extension PCR using the Full F1 and Full R2 primers as external primers and using 5′-GGAGGAAGGAGAACACAGTTGAGTGGGGATTGC-3′ and 5′-TCCTTCCTCCCTCCCTGTGTACCC-3′ as internal primers. The (PMP del. BS) plasmid was constructed by using 5′-TGCGGGGACAAACCCCAGATGG-3′ and 5′-TCCCCGCAAATGGGAGGGAGGGATCTGC-3′ as internal primers.
Gelshift assay.
The full-length 3′UTR of PMP22 was inserted into pGEM-T easy (Promega) and used for in vitro transcription (Promega). Equal quantities of PMP22 RNA were incubated overnight with 0.1 pmol of biotinylated 2′-O-methyl RNAs (IDTDNA Technologies). The sequence of miR-9 was 5′-5BiotTEG-mUmCmUmUmUmGmGmUmUmAmUmCmUmAmGmCmUmGmUmAmUmGmA-3′. The sequence of miR-124a was 5′-5BiotTEG-mUmUmAmAmGmGmCmAmCmGmCmGmGmUmGmAmAmUmGmCmCmA-3′.
The miRNA:RNA complexes were resolved on a 1% native agarose gel, transferred to a GeneScreen Plus nylon membrane, and revealed using a Chemiluminescent DNA Detection Kit (Pierce).
Western blot and immunofluorescence.
Western blot analysis of PMP22 was done as described previously (Notterpek et al., 1999). For PMP22 immunofluorescence analysis, P7 rat brain sections were incubated with the mouse monoclonal CC1 antibody (Oncogene) and a rabbit anti-PMP22 antibody (Notterpek et al., 1999). The primary antibodies were detected using a goat anti-mouse IgG-Alexa Fluor 488 (A11001, Invitrogen) and a goat anti-rabbit IgG-Alexa Fluor 594 (A11012, Invitrogen). Nuclei were stained using DAPI (D3571, Invitrogen). Rat Schwann cells were processed for immunostaining with the mouse monoclonal anti-PMP22 antibody (Chemicon) and detected using a goat anti-mouse IgG conjugated to Alexa Fluor 594 (A11005, Invitrogen). Nuclei were labeled with Hoechst 33342 dye (Molecular Probes).
Results
Characterization of miRNAs expressed by oligodendrocyte lineage cells
In vivo miRNA expression profiles of defined neural populations have not been reported yet. To address this issue, two stage-specific populations of oligodendrocytes were obtained from postnatal rat brains: (1) OPCs that are positive for the A2B5 ganglioside and negative for the galactocerebroside marker (A2B5+ GalC− cells) and (2) OLs that are negative for the A2B5 marker and positive for galactocerebroside (A2B5− GalC+ cells) (Fig. 1A). The procedure was sufficient to obtain a high purity of oligodendrocyte lineage cells (supplemental Fig. 1, available at www.jneurosci.org as supplemental material). The real-time PCR analysis of neural markers on the A2B5− GalC+ population shows a marked depletion of neuronal markers (KCC2, Syt1, and SNAP25) and astrocyte markers (Aqp4, GLT1, and GFAP). Notably, these genes appear at least 4 PCR cycles after the oligodendrocyte markers (Gtx, MBP, and MOBP) (supplemental Fig. 1A, available at www.jneurosci.org as supplemental material). There is also a significant enrichment (3–5 cycles) of the oligodendrocyte markers in A2B5− GalC+ cells when compared with A2B5+ GalC− cells. We also determined the percentage of microglial cells found in the A2B5− GalC+ population using two well defined hematopoietic markers: CD11b and CD45. The FACS analysis reveals that ∼5% of the A2B5− GalC+ cells are CD11b positive and ∼7% are CD45 positive (supplemental Fig. 1B, available at www.jneurosci.org as supplemental material). For comparison, contaminating microglia and astrocytes found in culture of rat oligodendrocytes are ∼3% each (Chen et al., 2007). Additionally, the real-time PCR analysis of purified A2B5+ GalC− cells shows the low abundance of neuronal and astrocyte markers and the FACS analysis reveals the weak presence of contaminating microglial cells (<2%, based on CD11b expression) (supplemental Fig. 1B, available at www.jneurosci.org as supplemental material). Overall, these data indicate that the two populations studied herein were highly enriched for oligodendrocyte lineage cells directly obtained from postnatal rat brains.
Figure 1.
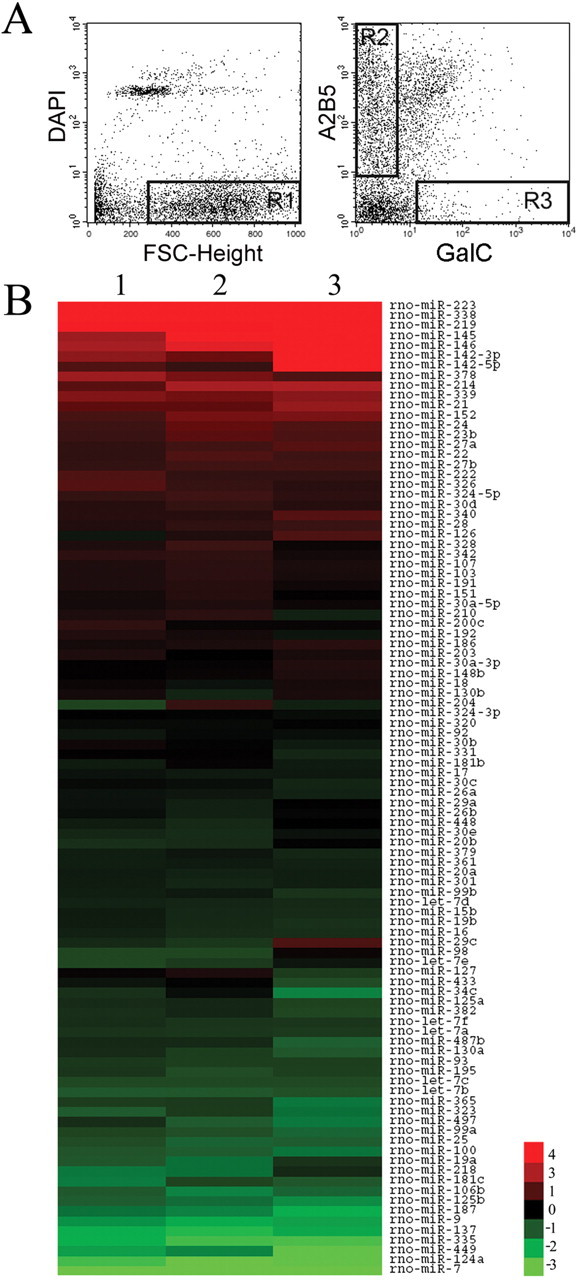
miRNA expression in oligodendrocyte lineage cells. A, FACS isolation of oligodendrocyte lineage cells. Live brain cells are obtained by excluding dead cells (DAPI positive) and cell debris [low Forward Scatter Characteristics (FSC-Height)]. The R1 gate is used to select the live cells that are subsequently sorted to purify both A2B5+ GalC− cells (Gate R2) and A2B5− GalC+ cells (Gate R3). B, miRNA expression in oligodendrocyte lineage cells. The heat map displays the log2 transformation of the relative fold change in miRNA expression level obtained from miRNA microarrays. Upregulated miRNAs (red) are those with increased expression levels during oligodendrocyte maturation, whereas downregulated miRNAs are shown in green. The middle of the heat map contains miRNAs showing little to no change in expression levels. The three columns correspond to three independent experiments.
We performed miRNA expression profiling of the A2B5+ GalC− cells and the A2B5− GalC+ cells using miRNA microarrays. The presence of 98 miRNAs was reproducibly detected (Fig. 1B) and further validated by real-time PCR. Overall, the fold changes obtained by miRNA microarrays and real-time PCR are similar for the 98 miRNAs (r = 0.99, Pearson correlation) (supplemental Fig. 2 and sup-plemental Table 1, available at www.jneurosci.org as supplemental material). Although 19 additional miRNAs were unambiguously detected by miRNA microarrays (supplemental Table 2, available at www.jneurosci.org as supplemental material), their validation essentially remained inconclusive because of the absence of adequate primers and probes in the multiplex PCR mix.
Table 1.
Top miRNAs expressed by oligodendrocyte lineage cells
| Top miRNAs in A2B5+ GalC− cells |
Top miRNAs in A2B5− GalC+ cells |
||
|---|---|---|---|
| miRNA | Mean signal | miRNA | Mean signal |
| rno-miR-9 | 71871 | rno-miR-219 | 41820 |
| rno-miR-125b | 46397 | rno-miR-145 | 30117 |
| rno-miR-16 | 37424 | rno-miR-23b | 29317 |
| rno-let-7c | 36388 | rno-miR-146 | 28413 |
| rno-let-7a | 35294 | rno-miR-26a | 25555 |
| rno-let-7f | 33031 | rno-miR-16 | 24548 |
| rno-let-7b | 31250 | rno-miR-223 | 24026 |
| rno-miR-26a | 30816 | rno-miR-30b | 23205 |
| rno-miR-100 | 27739 | rno-miR-30c | 22288 |
| rno-miR-99a | 27656 | rno-miR-21 | 20532 |
| rno-miR-130a | 27337 | rno-miR-30a-5p | 20278 |
| rno-miR-30c | 26013 | rno-miR-17 | 20078 |
| rno-miR-25 | 25881 | rno-miR-191 | 20059 |
| rno-miR-19b | 24918 | rno-let-7a | 19064 |
| rno-miR-20a | 24686 | rno-miR-20a | 19014 |
| rno-let-7d | 23587 | rno-miR-181b | 18819 |
| rno-miR-17 | 23569 | rno-let-7f | 18733 |
| rno-miR-30b | 23529 | rno-miR-103 | 18146 |
| rno-miR-124a | 22186 | rno-miR-126 | 17916 |
| rno-miR-181b | 21463 | rno-miR-107 | 17520 |
Boldface denotes top miRNAs found in both cell populations. Mean signals were derived from three independent microarray experiments.
The 20 miRNAs with the highest expression levels in oligodendrocyte lineage cells are shown in Table 1. The class of abundantly expressed miRNAs in OPCs includes many previously described brain-enriched miRNAs such as miR-9, miR-26a, miR-124a, miR-125b, miR-181b, and the let-7 family, encompassing let-7a, let-7b, let-7c, let-7d, and let-7f members. In contrast to the let-7 family, whose expression is remarkably stable during differentiation, 23 miRNAs are downregulated (with fold changes >2) and include miR-9 and miR-124a (Fig. 1B). We also found 20 miRNAs that are upregulated >2-fold during differentiation and some were previously identified from rat brain tissues: miR-21, miR-152, miR-142–5p and -3p, miR-338, miR-339, and miR-378 (Landgraf et al., 2007). Notably, miR-219 shows strong expression in OLs, consistent with its tight association with glial cells in the zebrafish brain (Kapsimali et al., 2007).
The miRNA microarray data were further confirmed by verifying the coexpression of intronic miRNAs with their host genes. Among the 98 miRNAs, 38 intronic miRNAs derive from 34 host genes and the Affymetrix microarray analysis of A2B5− GalC+ cells reveals the expression of these host genes [with a Normalized Expression Value (NEV) >0.9] (Table 2). In total, 29 of 34 genes are unambiguously detected in A2B5− GalC+ cells and only 4 genes (MCM7, SLIT2, SMC4L1, and an uncharacterized RIKEN sequence) are absent or moderately expressed (NEV <0.9). RIMB1 is the unique gene that is not conclusive because of the absence of probes. Additionally, the analysis of the Affymetrix microarray data of A2B5+ GalC− cells reveals that these 4 undetected genes are indeed expressed in OPCs (NEV >0.9), thus validating the miRNAs found by miRNA microarrays and PCR (Table 2). We also compared the fold changes of the miRNAs to the fold changes of their respective host genes. For 28 of 38 intronic miRNAs, the fold changes are in agreement with the fold changes of their host genes (supplemental Table 3, available at www.jneurosci.org as supplemental material). Some noticeable correlations are obtained for upregulated miRNAs such as miR-214 (with the DNM3 gene) and miR-338 (found in LOC688299, similar to apoptosis-associated tyrosine kinase). Likewise, the downregulation of miR-15 and miR-16b is consistent with the expression level of their host gene SMC4L1. Similarly, miR-25, miR-93, and miR-106b are downregulated together with MCM7, a marker of proliferation. Altogether, this comparison shows the coexpression of intronic miRNAs with their host genes during oligodendrocyte differentiation.
Table 2.
Correlation of intronic miRNA/ host gene expression in oligodendrocyte lineage cells
| Host gene | miRNA | A2B5+ GalC− miRNA value | A2B5− GALC+ miRNA value | Affymetrix ID | A2B5+ GalC− NEV | A2B5− GALC+ NEV | Correlation gene/miRNA expression |
|---|---|---|---|---|---|---|---|
| ACADVL | rno-miR-324-5p | 2046 | 3904 | 1367897_at | 0.97 | 1.05 | + |
| ARRB1 | rno-miR-326 | 125 | 266 | 1368968_at | 0.93 | 1 | + |
| CEECAM1 | rno-miR-219 | 1972 | 41820 | 1374763_at | 0.92 | 1.09 | + |
| CHM | rno-miR-361 | 8458 | 6514 | 1369227_at | 1 | 1.05 | + |
| COPZ2 | rno-miR-152 | 1103 | 3280 | 1372305_at | 0.82 | 1.41 | + |
| CTDSPL | rno-miR-26a | 30816 | 25555 | 1379238_at | 0.96 | 1.16 | + |
| CTDSPL | rno-miR-26a | 30816 | 25555 | 1391635_at | 0.99 | 1.09 | + |
| CTDSP1 | rno-miR-26b | 15014 | 13247 | 1388533_at | 0.97 | 1.12 | + |
| DNM3 | rno-miR-214 | 333 | 1342 | 1370672_a_at | 0.76 | 1.56 | + |
| EGFL7 | rno-miR-126 | 14557 | 17916 | 1370402_at | 0.71 | 1.16 | + |
| EGFL7 | rno-miR-126 | 14557 | 17916 | 1393427_s_at | 0.81 | 1.35 | + |
| EHD1 | rno-miR-192 | 348 | 393 | 1372317_at | 0.9 | 1.26 | + |
| EHD1 | rno-miR-192 | 348 | 393 | 1388623_at | 0.88 | 1.26 | + |
| ELMO3 | rno-miR-328 | 606 | 849 | 1374995_at | 1.01 | 1.03 | + |
| EVL | rno-miR-342 | 9046 | 13747 | 1367861_at | 1.14 | 0.92 | + |
| HNRPK | rno-miR-7 | 3124 | 96 | 1367895_at | 1.06 | 0.87 | + |
| HNRPK | rno-miR-7 | 3124 | 96 | 1398797_at | 1.04 | 0.97 | + |
| HUWE1 | rno-let-7f | 33031 | 18733 | 1370684_s_at | 1.05 | 0.93 | + |
| HUWE1 | rno-let-7f | 33031 | 18733 | 1389814_at | 1 | 1.01 | + |
| HUWE1 | rno-miR-98 | 4112 | 2632 | 1370684_s_at | 1.05 | 0.93 | + |
| HUWE1 | rno-miR-98 | 4112 | 2632 | 1389814_at | 1 | 1.01 | + |
| LOC288010 | rno-miR-28 | 980 | 1665 | 1385564_at | 0.94 | 1.07 | + |
| LOC288010 | rno-miR-28 | 980 | 1665 | 1392361_at | 0.96 | 1.09 | + |
| LOC688299 | rno-miR-338 | 274 | 15629 | 1385333_at | 0.46 | 1.6 | + |
| LOC498154 | rno-miR-339 | 526 | 2286 | 1383301_at | 0.93 | 1.11 | + |
| MCM7 | rno-miR-25 | 25881 | 9359 | 1388744_at | 1.3 | 0.68 | + |
| MCM7 | rno-miR-93 | 14677 | 7332 | 1388744_at | 1.3 | 0.68 | + |
| MCM7 | rno-miR-106b | 16362 | 4993 | 1388744_at | 1.3 | 0.68 | + |
| NFYC | rno-miR-30c | 26013 | 22288 | 1368820_at | 0.97 | 1.06 | + |
| NFYC | rno-miR-30e | 12458 | 9074 | 1368820_at | 0.97 | 1.06 | + |
| NR6A1 | rno-miR-181b | 21463 | 18819 | 1398548_at | 0.98 | 0.95 | + |
| PANK1 | rno-miR-107 | 12374 | 17520 | 1382924_at | 1.04 | 0.93 | + |
| PANK2 | rno-miR-103 | 12934 | 18146 | 1378378_at | 1.13 | 0.98 | + |
| PANK2 | rno-miR-103 | 12934 | 18146 | 1392033_a_at | 1.11 | 0.97 | + |
| PANK3 | rno-miR-103 | 12934 | 18146 | 1391348_at | 0.98 | 1.05 | + |
| PPARGC1B | rno-miR-378 | 42 | 421 | 1392715_at | 0.88 | 1.22 | + |
| PTK2 | rno-miR-151 | 1725 | 2110 | 1387875_at | 0.91 | 1.08 | + |
| RGD1308065 | rno-miR-130b | 2407 | 2419 | 1389807_at | 0.92 | 1.04 | + |
| RGD1308065 | rno-miR-130b | 2407 | 2419 | 1392096_at | 1.03 | 1.06 | + |
| RGD1307084 | rno-miR-301 | 9283 | 6998 | 1379261_at | 1.28 | 0.92 | + |
| RIMB1 | rno-miR-142-3p | 123 | 1641 | No probe | No probe | No probe | No probe |
| RIMB1 | rno-miR-142-5p | 1894 | 6892 | No probe | No probe | No probe | No probe |
| SLIT2 | rno-miR-218 | 2192 | 821 | 1382685_at | 1.09 | 0.86 | + |
| SLIT2 | rno-miR-218 | 2192 | 821 | 1395986_at | 1.16 | 0.84 | + |
| SLIT3 | rno-miR-218 | 2192 | 821 | 1368920_at | 0.77 | 1.24 | + |
| SMC4L1 | rno-miR-15b | 11688 | 8123 | 1383008_at | 1.35 | 0.66 | + |
| SMC4L1 | rno-miR-16 | 37424 | 24548 | 1383008_at | 1.35 | 0.66 | + |
| TRPM3 | rno-miR-204 | 1175 | 764 | 1380800_at | 0.92 | 1.03 | + |
| ZFP265 | rno-miR-186 | 3214 | 4353 | 1387117_at | 0.98 | 1.19 | + |
| 2610203C20Rik | rno-miR-125b | 46397 | 12627 | 1373651_at | 1.35 | 0.71 | + |
The normalized expression values (NEVs) were obtained by normalizing the signals of all the genes present in rat Affymetrix microarrays and across all the replicates. Bold denotes NEV < 0.9 and highlights the host genes with low NEVs that are either absent or moderately expressed. +, The A2B5+ GalC− NEV and/or the A2B5− GALC+ NEV is higher than 0.9. No probe, The microarray does not contain any probe to detect the host gene.
Target bias analysis of miRNAs in oligodendrocyte lineage cells
To delineate miRNAs with important biological functions in oligodendrocyte lineage cells, we conducted a target bias analysis (Tsang et al., 2007). In principle, if a miRNA is coexpressed with a significant number of its predicted targets, this positive correlation signature (positive target bias) would enrich for functional targets. Similarly, if one finds that a miRNA is negatively correlated with the expression of its predicted targets, this negative correlation signature (negative target bias) would also lead to the enrichment of functional targets.
To explore the target bias in A2B5− GalC+ cells, the rat Affymetrix microarrays data were used to establish a rank order list of mRNAs based on their Normalized Expression Values (NEV) (GEO, accession number GSE11218). This list was further examined for the distribution of predicted targets for each of the 98 validated miRNAs. The predicted targets were compiled from TargetScan 4.0 algorithm (Grimson et al., 2007). The Fisher's exact test was used to determine whether the top tenth (top window), middle tenth (middle window), or bottom tenth (bottom window) percentile windows of the rank order list of mRNAs contain more predicted targets than would be expected by chance. Interestingly, 37 of 98 miRNAs show a target bias in either the top tenth or bottom tenth percentile windows (Fig. 2A). In total, 35 of 37 correlation signatures are negative (Fig. 2A,B). In contrast, only miR-9 and miR-124a predicted targets show a positive correlation signature (Fig. 2B; supplemental Table 4, available at www.jneurosci.org as supplemental material). This cellular prevalence of negative correlation signatures is in agreement with other genome-wide studies showing that the predicted targets are expressed at lower levels in tissues where the miRNA is present compared with other tissues where the miRNA is absent (Farh et al., 2005). However, a closer examination revealed six miRNAs among which miR-34c, miR-137, miR-146, miR-186, miR-218, and miR-449 that were previously reported with positive correlation signatures in neuronal cells (Tsang et al., 2007).
Figure 2.
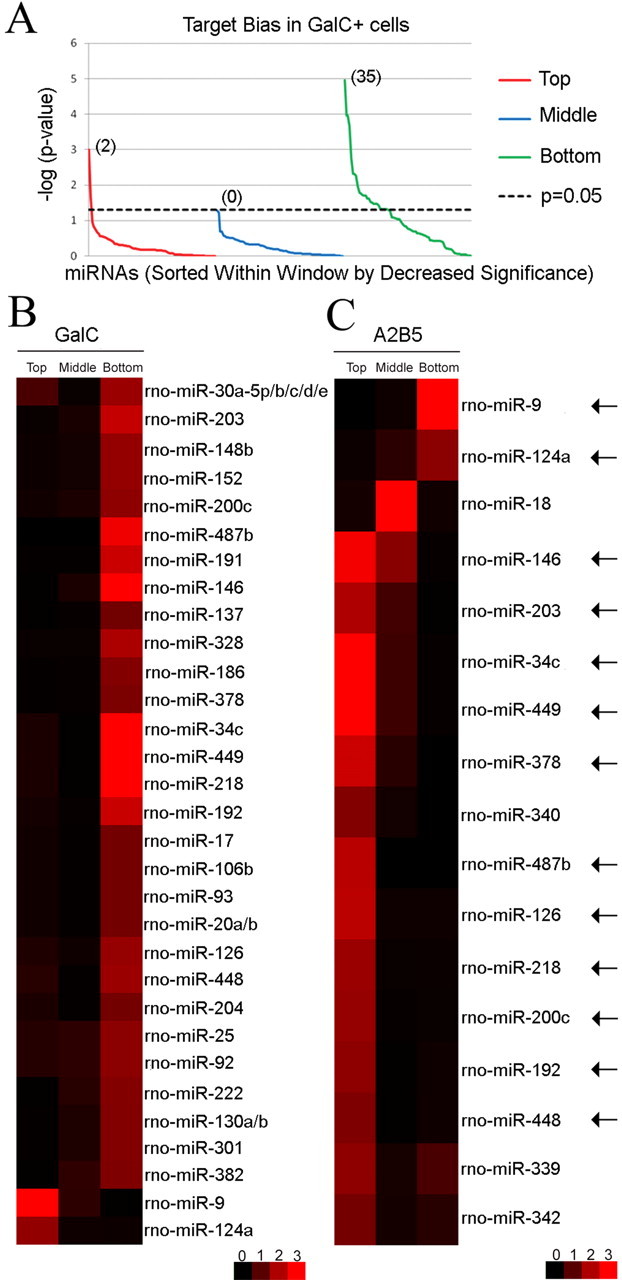
Target bias reversal of a subset of miRNAs during oligodendrocyte differentiation. A, Target bias analysis in A2B5− GalC+ cells. The p values are calculated in three windows (top tenth, middle tenth, and bottom tenth percentile windows) of the GalC rank order list, log-transformed, and depicted by line chart. For each window, the 98 miRNAs are sorted by decrease level of significance. Thirty-seven of 98 miRNAs are associated with a target bias. Notably, a negative target bias is predominant (35 miRNAs in the green line above 1.3, corresponding to p < 0.05, right-tailed Fisher's exact test), whereas only two miRNAs are found with a positive target bias (red line above the 1.3 value). As a negative control, the middle window does not contain any target bias (blue line below 1.3 for all 98 miRNAs). B, Targeting bias in A2B5− GalC+ cells. The heat map shows the significance values calculated for 37 miRNAs with target bias within each window (top, middle, bottom). As in A, the p values depicted are generated using a −log (p value) transformation. Red denotes target bias in the considered window, whereas black is used for no statistical difference. From the heat map display, 35 of 37 miRNAs show a negative target bias. Only miR-9 and miR-124a are associated with a positive target bias in OLs and are located at the bottom of the heat map. C, Targeting bias in A2B5+ GalC− cells. The analysis reveals that 17 of 98 miRNAs show a target bias in A2B5+ GalC− cells. Interestingly, the target bias analysis of 13 miRNAs (indicated by arrows) shows a coordinated reversal in the distribution of predicted targets during oligodendrocyte differentiation (from the top A2B5+ GalC− window to the bottom A2B5− GalC+ window for 11 miRNAs and from the bottom A2B5+ GalC− window to the top A2B5− GalC+ window for 2 miRNAs). miR-9 and miR-124a, whose distribution bias of predicted targets switches from negative to positive correlation signatures, are located on the top of the heat map.
To determine whether these fluctuations in correlation signatures were dependent not only on the cell types (neuronal versus glial cells) but also on the stages of differentiation, a second target bias analysis was conducted with A2B5+ GalC− cells. The predicted targets of the 98 miRNAs were compared with a rank order list of mRNAs obtained from A2B5+ GalC− cells (GEO, accession number GSE11218). This analysis shows that 17 miRNAs are associated with a target bias (Fig. 2C; supplemental Table 4, available at www.jneurosci.org as supplemental material). Interestingly, we observed two classes of inversions in the correlation signatures for 13 of 37 previously identified miRNAs. The first class is defined by a switch from positive to negative correlations and contains 11 miRNAs such as miR-34c, miR-146, miR-218, and miR-449 (Fig. 2C). The second class is defined by a reversal from negative to positive correlations and only contains miR-9 and miR-124a (Fig. 2C). The miRNAs in the first class are in line with studies showing that the expression level of the predicted targets is generally higher before differentiation, and that some miRNAs dampen the output of the transcriptionally downregulated mRNAs to facilitate a faster transition in gene expression (Stark et al., 2005). The miRNAs in the second class may serve as buffers to silence the genetic noise of unwanted transcripts arising from “leaky” transcription (Hornstein and Shomron, 2006), and such a role has been attributed to miR-9 (Li et al., 2006).
To determine whether the changes in expression level of the miRNAs influence the level of their predicted targets, we selected miRNAs with significant target bias since a disruption of the bias when the miRNA is upregulated or downregulated would be a good indication of a functional interaction. The supplemental Table 5 (available at www.jneurosci.org as supplemental material) contains 6 miRNAs that are upregulated >2-fold during differentiation: miR-146, miR-152, miR-222, miR-339, miR-340, and miR-378. We found that miR-146, miR-152, miR-222, and miR-378 predicted targets are globally downregulated during differentiation. Furthermore, 10 miRNAs are downregulated >2-fold and only the predicted targets of miR-9 and miR-124a are associated with a reversal of the correlation signatures from the bottom A2B5+ GalC− window to the top A2B5− GalC+ window. Additionally, we found that the predicted targets of miR-218, miR-449, and miR-487b reverse their correlation signatures from the top A2B5+ GalC− window to the bottom A2B5− GalC+ window. Overall, this analysis shows that 9 of 16 miRNAs, including miR-9, may affect the expression level of their predicted targets and thus would be excellent candidates to consider when searching for functional targets using DNA microarray techniques.
PMP22 mRNA is not translated into protein in oligodendrocytes
To find a functional target of miR-9, we examined the predicted targets found in the bottom tenth percentile of OPCs and in the top tenth percentile of OLs (supplemental Table 6, available at www.jneurosci.org as supplemental material). A subsequent Gene Ontology (GO) query with the overlap between the two windows containing the predicted targets of miR-9 revealed that demyelination of sciatic nerve was ranked as a top category (p < 2.10 × 10⁻⁵). Two genes were found in this category: NDRG1 and PMP22. NDRG1 has been previously reported to be expressed in oligodendrocytes, whereas PMP22 has not been detected, thus making PMP22 an attractive candidate target of miR-9. We confirmed by real-time PCR the presence of PMP22 mRNA in oligodendrocytes (Fig. 3A) and the quantification revealed an increase of ∼2- fold during differentiation (Fig. 3B). To confirm that oligodendrocytes do not translate the PMP22 mRNA into protein, frozen postnatal rat brain sections were processed for double immunolabeling. The postnatal oligodendrocytes in the corpus callosum of rat brains are labeled with the CC1 antibody and not with the PMP22 antibody (Fig. 3C). As positive control, the PMP22 antibody clearly stains neuroepithelial junctions in adjacent sections (Fig. 3D) (Roux et al., 2004). Altogether, the in vivo experiments show that PMP22 is transcribed in oligodendrocytes, however no protein is synthesized. A similar situation exists in vitro, because PMP22 mRNA is found in the CG-4 oligodendrocyte cell line, whereas the protein cannot be detected by Western blot (supplemental Fig. 3, available at www.jneurosci.org as supplemental material). Overall, the data suggest the involvement of posttranscriptional mechanisms in the control of PMP22 expression.
Figure 3.
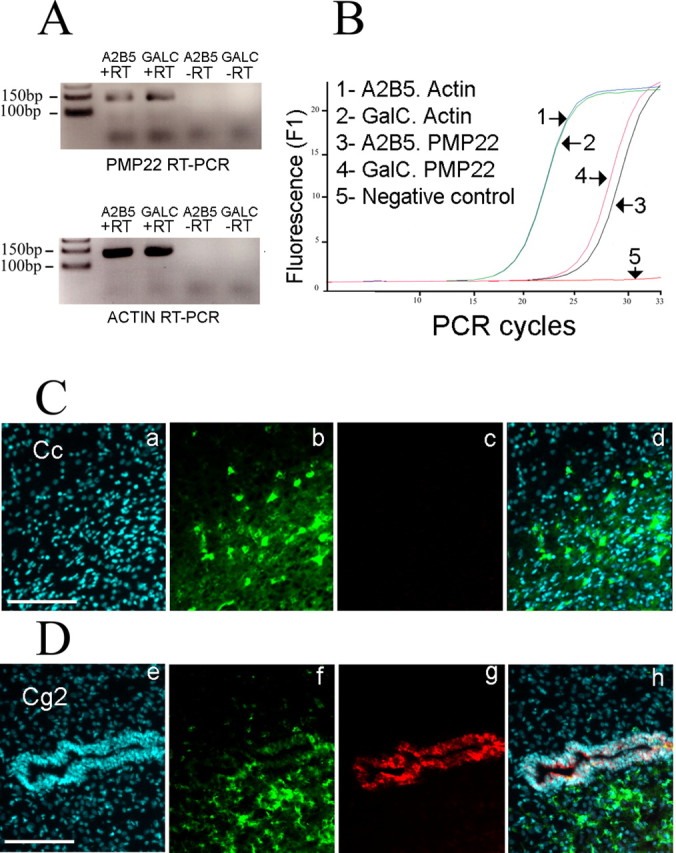
PMP22 is not translated in oligodendrocytes. A, PMP22 mRNA expression in oligodendrocytes. The RT-PCR shows the presence of PMP22 in A2B5+ GalC− cells and A2B5− GalC+ cells. The −RT lanes (without reverse transcriptase) are negative controls, and β-actin PCR is used as positive control. B, Quantification of PMP22 mRNA level. The PCR curves obtained with A2B5− GalC+ cDNA and A2B5+ GalC− cDNA show an increase of PMP22 mRNA level during differentiation. The overlapping curves for β-actin confirm the equivalent levels of mRNA in both samples. C, The CC1+ oligodendrocytes in the corpus callosum (Cc) are not immunoreactive for PMP22. Sagittal sections of postnatal rat brains are processed with a rabbit anti-PMP22 antibody (c) and the CC1 mouse antibody is used to label oligodendrocytes (b). Nuclei are visualized with DAPI (a). d, Merge picture. Scale bar, 100 μm. D, PMP22 protein is present in neuroepithelial cells. The CC1+ oligodendrocytes (f) in the cingulate cortex (Cg2 area) do not express PMP22 (g). A clear signal for PMP22 is obtained in neuroepithelial cells surrounding the ventricle. Nuclei are visualized with DAPI (e). h, Merge picture. Scale bar, 100 μm.
miR-9 downregulates PMP22 protein expression
A direct interaction between miR-9 and the 3′UTR of PMP22 was revealed using in vitro binding assays (supplemental Fig. 4, available at www.jneurosci.org as supplemental material). To further demonstrate a functional interaction, miR-9 was cotransfected in HeLa cells with a luciferase reporter construct containing the 3′UTR of PMP22 (r3′UTR), and an ∼50% repression of the luciferase activity was obtained (p < 0.01, Student's t test, compared with the cotransfection with a scramble miRNA) (Fig. 4B). To delineate the positions of the binding sites of miR-9 in the 3′UTR of PMP22, we used three luciferase constructs that contain fragments of the 3′UTR (Fig. 4A). Only fragment 1 (positions 1–157 relative to the stop codon) and fragment 2 (positions 158–498) support the downregulation (p < 0.01 for fragments 1 and 2, Student's t test), whereas fragment 3 (positions 499–1127) does not. The predicted binding site (BS) of miR-9 is located in fragment 2 (positions 421–443) and may explain the response obtained with this fragment. Notably, this predicted binding site contains the (AACCAAA) sequence that corresponds to the nucleotides pairing with the seed sequence of miR-9 (underlined in Fig. 4A). We deleted the predicted binding site (del. BS) and found that this deletion did not relieve the inhibition (Fig. 4B). A closer examination of the 3′UTR reveals that a repeat of the (AACCAAA) sequence is also located in fragment 1 between positions 73 and 134. We found that the deletion of the (AACCAAA) repeat (del. repeat) was sufficient to inhibit the miR-9 mediated downregulation (Fig. 4B) of the 3′UTR.
Figure 4.

miR-9 interacts in vitro with the 3′UTR of PMP22. A, Luciferase constructs containing fragments of the 3′UTR. Nonoverlapping segments of the 3′UTR are used to delineate the binding sites of miR-9. The r3′UTR construct contains the full-length 3′UTR. The remaining constructs fragment 1 (nts 1–157), fragment 2 (nts 158–498), and fragment 3 (nts 499–1127) are segments of the full-length 3′UTR. The predicted binding site (BS) is located in Fragment 2 and the predicted base pairing is shown. The (AACCAAA) sequence is underlined. Two additional (AACCAAA) sequences are found in Fragment 1. B, Activity of miR-9 on luciferase constructs. The plasmids are cotransfected with either miR-9 or miR-Neg, a scramble miRNA (negative control). miR-9 has no effect on the empty vector or the plasmid containing fragment 3 (Frag. 3). However, miR-9 does significantly reduce luciferase activity of constructs containing either the full-length 3′UTR of PMP22 (r3′UTR), fragment 1 (Frag. 1) or fragment 2 (Frag. 2) (**p < 0.01, Student's t test, compared with Neg). miR-9 also downregulates luciferase activity of PMP del. BS [corresponding to the 3′UTR of PMP22 with a deletion of the predicted binding site (BS)] (**p < 0.01, Student's t test, compared with Neg), whereas no difference is observed with the PMP del. repeat plasmid [3′UTR with a deletion of the (AACCAAA) repeat]. Error bars represent SD. n = 6.
We also analyzed the downregulation of PMP22 after transfection of miR-9 in Schwann cells. The Northern blot analysis shows the absence of miR-9 in Schwann cells although the miR-9 precursor form is detected, in agreement with the specific expression of miR-9 in the brain (supplemental Fig. 5A,B, available at www.jneurosci.org as supplemental material). The Northern blot analysis of PMP22 expression reveals a reduction in PMP22 mRNA levels after transfection of miR-9 (Fig. 5A) and the quantification from three independent experiments, after normalization with 18S ribosomal RNA, shows an ∼30% reduction in steady-state PMP22 mRNA level (p < 0.05, Student's t test, compared with the cotransfection with the empty vector). The reduction of PMP22 mRNA level is accompanied by a comparable reduction at the protein level as determined by Western blot (p < 0.05, Student's t test) (Fig. 5B). The downregulation of PMP22 was also demonstrated by immunofluorescence. The Schwann cells were transfected with the miR-9 expression plasmid and showed weaker PMP22-like pattern of immunoreactivity, compared with the cells transfected with the miR-Neg plasmid (Fig. 5C). Altogether, these results show that miR-9 downregulates PMP22 in vitro by binding to its 3′UTR.
Figure 5.

miR-9 downregulates PMP22 in Schwann cells. A, miR-9 reduces PMP22 levels in Schwann cells. The Schwann cells transiently transfected with miR-9 contain reduced steady-state levels of PMP22 mRNA (*p < 0.05, Student's t test, versus miR-Neg, transfection with the empty plasmid, n = 3). Lipo, Lipofectamine negative control. The 18S ribosomal RNA is used for normalization. Error bars represent SD. B, Western blot analysis of Schwann cells after miR-9 transfection. The quantification of the downregulation of PMP22 protein after transfection with miR-9 is obtained from three independent experiments (*p < 0.05, Student's t test, versus miR-Neg, n = 3). GAPDH is used for normalization and N-glycosidase (PNGase) treated cell lysate is shown as a control for PMP22. The PMP22 specific bands are shown by arrows. NS, Nonspecific band; Lipo, lipofectamine negative control. Error bars represent SD. C, Immunofluorescence analysis of Schwann cells after miR-9 transfection. A reduction of PMP22 immunoreactivity is seen after transfection of Schwann cells with the pcDNA6.2-GW/EmGFP-miR-9 plasmid (e, shown by arrow), compared with the cells transiently transfected with the miR-Neg plasmid (b, shown by arrow). The transfected Schwann cells are detected by EmGFP autofluorescence (a–f, arrows). Nuclei are visualized by Hoechst staining. Scale bar, 10 μm.
Discussion
Profiling miRNAs in oligodendrocyte lineage cells
Although the spatiotemporal miRNA expression pattern is proposed to be dynamically regulated during brain development (Krichevsky et al., 2003), the miRNA expression profiles of specific neural populations (neurons, oligodendrocytes, and astrocytes) have not been fully addressed. Mammalian neurons are by far the best-characterized in vitro model (Kim et al., 2004; Kye et al., 2007). We report in this study the presence of 98 miRNAs in oligodendrocyte lineage cells. The expression level of 43 miRNAs is dynamically regulated during differentiation, consistent with the actual spatiotemporal model of miRNA expression in the brain. A comparison with miRNAs found in cortical neuronal cells shows an overlap with 58 of 98 miRNAs (supplemental Fig. 6 and supplemental Table 7, available at www.jneurosci.org as supplemental material). In this comparison, we also included 18 miRNAs that were reported to be enriched in the brain. The Venn diagram confirms the preferential expression of miR-128 in mature neurons and reveals two additional neuronal markers: miR-129 and miR-298. The comparison also supports the main expression of miR-124a in proliferating neural cells because miR-124a is shut down during oligodendrocyte lineage progression, mirroring its downregulation when neuronal cells differentiate. The analysis also shows that miR-338, another brain-enriched miRNA (data not shown), may be preferentially expressed in differentiating OLs. However, the comparison is preliminary, because other neural cells such as neuronal precursors and astrocytes should be included to obtain a more accurate picture. Notably, three miRNAs (miR-23, miR-26, and miR-29) that are found in oligodendrocyte lineage cells were previously described as enriched in astrocytes (Smirnova et al., 2005). Overall, the data thus suggest that neural cells may have in common a large number of miRNAs.
The modulation of the expression level of individual miRNAs may be crucial for their proper functions in the appropriate cellular context. For example, neurons and oligodendrocytes share several miRNAs such as miR-34c, miR-137, miR-146, miR-186, miR-218, and miR-449. Interestingly, these six miRNAs have negative target bias in the oligodendrocyte lineage but possess significant positive correlation signatures in neuronal cells. The contrast between neuronal and glial bias suggests that miRNAs have diverse roles that are cell-type dependent. We speculate that the primary function of these six miRNAs might be to buffer noise in gene expression, or to regulate local translation in neurons. In comparison, the prevalence of negative correlation signatures in oligodendrocytes supports a modulatory role in the reinforcement of preexisting transcriptional silencing mechanisms.
miRNAs and the control of myelin gene expression
Aside from regulating gene expression in physiological conditions, miRNAs have been implicated in pathological conditions such as Alzheimer's disease, schizophrenia, and glioblastoma (Chan et al., 2005; Perkins et al., 2007; Wang et al., 2008). Of note, miR-21 was strongly expressed in glioblastoma cell lines and knock-down of miR-21 led to increased apoptosis. The anti-apoptotic effect of miR-21 was counteracted by miR-335 in a model of neural survival after ethanol exposure (Sathyan et al., 2007). During oligodendrocyte differentiation, miR-335 was downregulated, whereas miR-21 was strongly upregulated, in line with the antagonistic action of miR-335 on miR-21. miR-9 is another miRNA whose expression has been well characterized in oligodendroglioma and in human brain (Nelson et al., 2006). In oligodendroglioma, miR-9 expression is increased when compared with normal adult brain, suggesting a potential role in neoplasia. miR-9 is enriched in the brain and is conserved during evolution, suggesting some important functions in neural cells. Interestingly, the precursor form of miR-9 is found in Schwann cells, whereas the mature form is not detected, in agreement with the specific expression of miR-9 in the brain. This observation suggests the existence of a posttranscriptional mechanism that controls the maturation of the precursor form inside or outside the CNS. A similar posttranscriptional event may also explain the expression pattern of other brain-enriched miRNAs such as miR-138 (Obernosterer et al., 2006). In human and rodents, there are three copies of mir-9 and only two are functional (Krichevsky et al., 2003). The expression of miR-9 is very high in neuroblasts and glioblasts of fetal brain. Furthermore, the maturation of neuroblasts is associated with a decrease in the expression level of miR-9, and its downregulation during the course of oligodendrocyte development is consistent with a role in the proliferating neural cells of the brain.
Our study shows that miR-9 interacts with PMP22. Notably, we found that PMP22 mRNA is detected in oligodendrocytes and that the protein is not expressed. Of note, three recent studies also support the active transcription of PMP22 in oligodendrocytes (Dugas et al., 2006; Nielsen et al., 2006; Sohn et al., 2006). Interestingly, the CNP-EGFP+ mouse cells showed variable levels of PMP22 mRNA between P2 and P30 (Sohn et al., 2006). Similarly, we observed an ∼2-fold increase of PMP22 mRNA level during differentiation, supporting a dynamic regulation of PMP22. Moreover, we also found by RT-PCR the presence of PMP22 mRNAs in premyelinating O4+ cells (supplemental Fig. 7A, available at www.jneurosci.org as supplemental material) and the rat Affymetrix microarray analysis confirmed an ∼2-fold increase during the transition from A2B5+ to O4+ cells (supplemental Fig. 7B, available at www.jneurosci.org as supplemental material). The presence of PMP22 mRNA in oligodendrocytes is also supported by in situ hybridization studies showing PMP22 transcripts in the CNS (Parmantier et al., 1995). The absence of PMP22 protein in oligodendrocytes is consistent with a previous proteomic study that extensively characterized proteins of CNS myelin and did not reveal PMP22 (Taylor et al., 2004). More globally, the restricted expression of PMP22 protein compared with the broad distribution of its message further supports a posttranscriptional control (Amici et al., 2006). Our results now point to a role for miRNAs in the regulation of PMP22 expression.
The oligodendrocytes and the Schwann cells synthesize myelin in the CNS and in the peripheral nervous system (PNS) respectively. Although the protein composition of their myelin sheaths is widely divergent, both cell types exert tight control over the relative abundance of the specific myelin proteins. Myelin gene dosage is primordial, as an increase of PLP in the CNS causes Pelizaeus-Merzbacher disease (Hudson, 2003). Similarly, the PMP22 gene is sensitive to copy number because duplication is found in the autosomal dominant Charcot-Marie Tooth type I disease and deletion is linked to autosomal dominant hereditary neuropathy with liability to pressure palsies (Patel et al., 1992; Chance et al., 1993). It is thus tempting to speculate that miRNAs reinforce the control of genes subjected to gene dosage by fine-tuning the transcript levels.
Overall, this work provides an important step toward the functional identification of miRNAs and how they interact with their targets to control the oligodendrocyte identity. The significance of this work is illustrated here by attributing a role for miRNAs in the posttranscriptional regulation of PMP22. Future functional studies aimed at understanding how individual miRNAs such as miR-9 and miR-338 contribute to the differences in protein composition will underscore the critical importance of these small noncoding RNAs as guardians of the glial transcriptome.
Footnotes
This work was supported by intramural funds from National Institute of Neurological Disorders and Stroke (NINDS) (L.D.H.), the Muscular Dystrophy Association (L.N.), the McKnight Brain Institute (L.N.), and the Joshua Benjamin Weitzel Fund for Developmental Neurobiology (L.N.). We thank Naser Muja (Johns Hopkins University, Baltimore, MD) for preliminary experiments and Jo Ann Berndt (NINDS) and Elena Romm (NINDS) for expert technical assistance. We are indebted to Dragan Maric (NINDS) for purification of oligodendrocytes and Abdel Elkahloun (National Human Genome Research Institute) for Affymetrix microarray processing. We are grateful to Jim Nagle (NINDS) and Deborah Kauffman (NINDS) for their support in DNA sequencing. We thank Christopher Brown (Applied Biosystems) and David Armistead (Applied Biosystems) for their expertise in real-time PCR. We thank Monique Dubois-Dalcq (NINDS) for critical reading of this manuscript. The miRNA microarray data reported in this study is deposited in the European Molecular Biology Laboratory/European Bioinformatics Institute ArrayExpress database (accession E-MEXP-1589) and the DNA microarray data in the Gene Expression Omnibus database (accession GSE11218).
References
- Ambros V. The functions of animal microRNAs. Nature. 2004;431:350–355. doi: 10.1038/nature02871. [DOI] [PubMed] [Google Scholar]
- Amici SA, Dunn WA, Jr, Murphy AJ, Adams NC, Gale NW, Valenzuela DM, Yancopoulos GD, Notterpek L. Peripheral myelin protein 22 is in complex with α6β4 integrin, and its absence alters the Schwann cell basal lamina. J Neurosci. 2006;26:1179–1189. doi: 10.1523/JNEUROSCI.2618-05.2006. [DOI] [PMC free article] [PubMed] [Google Scholar]
- Chan JA, Krichevsky AM, Kosik KS. MicroRNA-21 is an antiapoptotic factor in human glioblastoma cells. Cancer Res. 2005;65:6029–6033. doi: 10.1158/0008-5472.CAN-05-0137. [DOI] [PubMed] [Google Scholar]
- Chance PF, Alderson MK, Leppig KA, Lensch MW, Matsunami N, Smith B, Swanson PD, Odelberg SJ, Disteche CM, Bird TD. DNA deletion associated with hereditary neuropathy with liability to pressure palsies. Cell. 1993;72:143–151. doi: 10.1016/0092-8674(93)90058-x. [DOI] [PubMed] [Google Scholar]
- Chen Y, Balasubramaniyan V, Peng J, Hurlock EC, Tallquist M, Li J, Lu QR. Isolation and culture of rat and mouse oligodendrocyte precursor cells. Nat Protoc. 2007;2:1044–1051. doi: 10.1038/nprot.2007.149. [DOI] [PubMed] [Google Scholar]
- Cohen RI, Rottkamp DM, Maric D, Barker JL, Hudson LD. A role for semaphorins and neuropilins in oligodendrocyte guidance. J Neurochem. 2003;85:1262–1278. doi: 10.1046/j.1471-4159.2003.01722.x. [DOI] [PubMed] [Google Scholar]
- Dugas JC, Tai YC, Speed TP, Ngai J, Barres BA. Functional genomic analysis of oligodendrocyte differentiation. J Neurosci. 2006;26:10967–10983. doi: 10.1523/JNEUROSCI.2572-06.2006. [DOI] [PMC free article] [PubMed] [Google Scholar]
- Farh KK, Grimson A, Jan C, Lewis BP, Johnston WK, Lim LP, Burge CB, Bartel DP. The widespread impact of mammalian MicroRNAs on mRNA repression and evolution. Science. 2005;310:1817–1821. doi: 10.1126/science.1121158. [DOI] [PubMed] [Google Scholar]
- Grimson A, Farh KK, Johnston WK, Garrett-Engele P, Lim LP, Bartel DP. MicroRNA targeting specificity in mammals: determinants beyond seed pairing. Mol Cell. 2007;27:91–105. doi: 10.1016/j.molcel.2007.06.017. [DOI] [PMC free article] [PubMed] [Google Scholar]
- Hornstein E, Shomron N. Canalization of development by microRNAs. Nat Genet. 2006;38(Suppl 1):S20–S24. doi: 10.1038/ng1803. [DOI] [PubMed] [Google Scholar]
- Hudson LD. Pelizaeus-Merzbacher disease and spastic paraplegia type 2: two faces of myelin loss from mutations in the same gene. J Child Neurol. 2003;18:616–624. doi: 10.1177/08830738030180090801. [DOI] [PubMed] [Google Scholar]
- Kapsimali M, Kloosterman WP, de Bruijn E, Rosa F, Plasterk RH, Wilson SW. MicroRNAs show a wide diversity of expression profiles in the developing and mature central nervous system. Genome Biol. 2007;8:R173. doi: 10.1186/gb-2007-8-8-r173. [DOI] [PMC free article] [PubMed] [Google Scholar]
- Kessaris N, Fogarty M, Iannarelli P, Grist M, Wegner M, Richardson WD. Competing waves of oligodendrocytes in the forebrain and postnatal elimination of an embryonic lineage. Nat Neurosci. 2006;9:173–179. doi: 10.1038/nn1620. [DOI] [PMC free article] [PubMed] [Google Scholar]
- Kim J, Krichevsky A, Grad Y, Hayes GD, Kosik KS, Church GM, Ruvkun G. Identification of many microRNAs that copurify with polyribosomes in mammalian neurons. Proc Natl Acad Sci U S A. 2004;101:360–365. doi: 10.1073/pnas.2333854100. [DOI] [PMC free article] [PubMed] [Google Scholar]
- Krichevsky AM, King KS, Donahue CP, Khrapko K, Kosik KS. A microRNA array reveals extensive regulation of microRNAs during brain development. RNA. 2003;9:1274–1281. doi: 10.1261/rna.5980303. [DOI] [PMC free article] [PubMed] [Google Scholar]
- Kye MJ, Liu T, Levy SF, Xu NL, Groves BB, Bonneau R, Lao K, Kosik KS. Somatodendritic microRNAs identified by laser capture and multiplex RT-PCR. RNA. 2007;13:1224–1234. doi: 10.1261/rna.480407. [DOI] [PMC free article] [PubMed] [Google Scholar]
- Lai EC, Tam B, Rubin GM. Pervasive regulation of Drosophila Notch target genes by GY-box-, Brd-box-, and K-box-class microRNAs. Genes Dev. 2005;19:1067–1080. doi: 10.1101/gad.1291905. [DOI] [PMC free article] [PubMed] [Google Scholar]
- Landgraf P, Rusu M, Sheridan R, Sewer A, Iovino N, Aravin A, Pfeffer S, Rice A, Kamphorst AO, Landthaler M, Lin C, Socci ND, Hermida L, Fulci V, Chiaretti S, Foà R, Schliwka J, Fuchs U, Novosel A, Müller RU, et al. A mammalian microRNA expression atlas based on small RNA library sequencing. Cell. 2007;129:1401–1414. doi: 10.1016/j.cell.2007.04.040. [DOI] [PMC free article] [PubMed] [Google Scholar]
- Lee RC, Feinbaum RL, Ambros V. The C. elegans heterochronic gene lin-4 encodes small RNAs with antisense complementarity to lin-14. Cell. 1993;75:843–854. doi: 10.1016/0092-8674(93)90529-y. [DOI] [PubMed] [Google Scholar]
- Li Y, Wang F, Lee JA, Gao FB. MicroRNA-9a ensures the precise specification of sensory organ precursors in Drosophila. Genes Dev. 2006;20:2793–2805. doi: 10.1101/gad.1466306. [DOI] [PMC free article] [PubMed] [Google Scholar]
- Miska EA, Alvarez-Saavedra E, Townsend M, Yoshii A, Sestan N, Rakic P, Constantine-Paton M, Horvitz HR. Microarray analysis of microRNA expression in the developing mammalian brain. Genome Biol. 2004;5:R68. doi: 10.1186/gb-2004-5-9-r68. [DOI] [PMC free article] [PubMed] [Google Scholar]
- Nelson PT, Baldwin DA, Kloosterman WP, Kauppinen S, Plasterk RH, Mourelatos Z. RAKE and LNA-ISH reveal microRNA expression and localization in archival human brain. RNA. 2006;12:187–191. doi: 10.1261/rna.2258506. [DOI] [PMC free article] [PubMed] [Google Scholar]
- Nielsen JA, Maric D, Lau P, Barker JL, Hudson LD. Identification of a novel oligodendrocyte cell adhesion protein using gene expression profiling. J Neurosci. 2006;26:9881–9891. doi: 10.1523/JNEUROSCI.2246-06.2006. [DOI] [PMC free article] [PubMed] [Google Scholar]
- Notterpek L, Snipes GJ, Shooter EM. Temporal expression pattern of peripheral myelin protein 22 during in vivo and in vitro myelination. Glia. 1999;25:358–369. [PubMed] [Google Scholar]
- Obernosterer G, Leuschner PJ, Alenius M, Martinez J. Post-transcriptional regulation of microRNA expression. RNA. 2006;12:1161–1167. doi: 10.1261/rna.2322506. [DOI] [PMC free article] [PubMed] [Google Scholar]
- Parmantier E, Cabon F, Braun C, D'Urso D, Müller HW, Zalc B. Peripheral myelin protein-22 is expressed in rat and mouse brain and spinal cord motoneurons. Eur J Neurosci. 1995;7:1080–1088. doi: 10.1111/j.1460-9568.1995.tb01095.x. [DOI] [PubMed] [Google Scholar]
- Patel PI, Roa BB, Welcher AA, Schoener-Scott R, Trask BJ, Pentao L, Snipes GJ, Garcia CA, Francke U, Shooter EM, Lupski JR, Suter U. The gene for the peripheral myelin protein PMP-22 is a candidate for Charcot-Marie-Tooth disease type 1A. Nat Genet. 1992;1:159–165. doi: 10.1038/ng0692-159. [DOI] [PubMed] [Google Scholar]
- Perkins DO, Jeffries CD, Jarskog LF, Thomson JM, Woods K, Newman MA, Parker JS, Jin J, Hammond SM. microRNA expression in the prefrontal cortex of individuals with schizophrenia and schizoaffective disorder. Genome Biol. 2007;8:R27. doi: 10.1186/gb-2007-8-2-r27. [DOI] [PMC free article] [PubMed] [Google Scholar]
- Reich M, Liefeld T, Gould J, Lerner J, Tamayo P, Mesirov JP. GenePattern 2.0. Nat Genet. 2006;38:500–501. doi: 10.1038/ng0506-500. [DOI] [PubMed] [Google Scholar]
- Roux KJ, Amici SA, Notterpek L. The temporospatial expression of peripheral myelin protein 22 at the developing blood-nerve and blood-brain barriers. J Comp Neurol. 2004;474:578–588. doi: 10.1002/cne.20154. [DOI] [PubMed] [Google Scholar]
- Saini HK, Griffiths-Jones S, Enright AJ. Genomic analysis of human microRNA transcripts. Proc Natl Acad Sci U S A. 2007;104:17719–17724. doi: 10.1073/pnas.0703890104. [DOI] [PMC free article] [PubMed] [Google Scholar]
- Sathyan P, Golden HB, Miranda RC. Competing interactions between micro-RNAs determine neural progenitor survival and proliferation after ethanol exposure: evidence from an ex vivo model of the fetal cerebral cortical neuroepithelium. J Neurosci. 2007;27:8546–8557. doi: 10.1523/JNEUROSCI.1269-07.2007. [DOI] [PMC free article] [PubMed] [Google Scholar]
- Schaefer A, O'Carroll D, Tan CL, Hillman D, Sugimori M, Llinas R, Greengard P. Cerebellar neurodegeneration in the absence of microRNAs. J Exp Med. 2007;204:1553–1558. doi: 10.1084/jem.20070823. [DOI] [PMC free article] [PubMed] [Google Scholar]
- Sempere LF, Freemantle S, Pitha-Rowe I, Moss E, Dmitrovsky E, Ambros V. Expression profiling of mammalian microRNAs uncovers a subset of brain-expressed microRNAs with possible roles in murine and human neuronal differentiation. Genome Biol. 2004;5:R13. doi: 10.1186/gb-2004-5-3-r13. [DOI] [PMC free article] [PubMed] [Google Scholar]
- Smirnova L, Gräfe A, Seiler A, Schumacher S, Nitsch R, Wulczyn FG. Regulation of miRNA expression during neural cell specification. Eur J Neurosci. 2005;21:1469–1477. doi: 10.1111/j.1460-9568.2005.03978.x. [DOI] [PubMed] [Google Scholar]
- Sohn J, Natale J, Chew LJ, Belachew S, Cheng Y, Aguirre A, Lytle J, Nait-Oumesmar B, Kerninon C, Kanai-Azuma M, Kanai Y, Gallo V. Identification of Sox17 as a transcription factor that regulates oligodendrocyte development. J Neurosci. 2006;26:9722–9735. doi: 10.1523/JNEUROSCI.1716-06.2006. [DOI] [PMC free article] [PubMed] [Google Scholar]
- Stark A, Brennecke J, Bushati N, Russell RB, Cohen SM. Animal MicroRNAs confer robustness to gene expression and have a significant impact on 3′UTR evolution. Cell. 2005;123:1133–1146. doi: 10.1016/j.cell.2005.11.023. [DOI] [PubMed] [Google Scholar]
- Stefani G, Slack FJ. Small non-coding RNAs in animal development. Nat Rev Mol Cell Biol. 2008;9:219–230. doi: 10.1038/nrm2347. [DOI] [PubMed] [Google Scholar]
- Taylor CM, Marta CB, Claycomb RJ, Han DK, Rasband MN, Coetzee T, Pfeiffer SE. Proteomic mapping provides powerful insights into functional myelin biology. Proc Natl Acad Sci U S A. 2004;101:4643–4648. doi: 10.1073/pnas.0400922101. [DOI] [PMC free article] [PubMed] [Google Scholar]
- Tsang J, Zhu J, van Oudenaarden A. MicroRNA-mediated feedback and feedforward loops are recurrent network motifs in mammals. Mol Cell. 2007;26:753–767. doi: 10.1016/j.molcel.2007.05.018. [DOI] [PMC free article] [PubMed] [Google Scholar]
- Valencia-Sanchez MA, Liu J, Hannon GJ, Parker R. Control of translation and mRNA degradation by miRNAs and siRNAs. Genes Dev. 2006;20:515–524. doi: 10.1101/gad.1399806. [DOI] [PubMed] [Google Scholar]
- Wang WX, Rajeev BW, Stromberg AJ, Ren N, Tang G, Huang Q, Rigoutsos I, Nelson PT. The expression of microRNA miR-107 decreases early in Alzheimer's disease and may accelerate disease progression through regulation of β-site amyloid precursor protein-cleaving enzyme 1. J Neurosci. 2008;28:1213–1223. doi: 10.1523/JNEUROSCI.5065-07.2008. [DOI] [PMC free article] [PubMed] [Google Scholar]
- Weinmaster G, Lemke G. Cell-specific cyclic AMP-mediated induction of the PDGF receptor. EMBO J. 1990;9:915–920. doi: 10.1002/j.1460-2075.1990.tb08189.x. [DOI] [PMC free article] [PubMed] [Google Scholar]