Abstract
Visual experience during early life is important for the development of neural organizations that support visual function. Closing one eye (monocular deprivation) during this sensitive period can cause a reorganization of neural connections within the visual system that leaves the deprived eye functionally disconnected. We have assessed the pattern of neurofilament labeling in monocularly deprived macaque monkeys to examine the possibility that a cytoskeleton change contributes to deprivation-induced reorganization of neural connections within the primary visual cortex (V-1). Monocular deprivation for three months starting around the time of birth caused a significant loss of neurofilament labeling within deprived-eye ocular dominance columns. Three months of monocular deprivation initiated in adulthood did not produce a loss of neurofilament labeling. The evidence that neurofilament loss was found only when deprivation occurred during the sensitive period supports the notion that the loss permits restructuring of deprived-eye neural connections within the visual system. These results provide evidence that, in addition to reorganization of LGN inputs, the intrinsic circuitry of V-1 neurons is altered when monocular deprivation occurs early in development.
Keywords: Labeling, monocular deprivation, neural connections, neurofilament, reorganization, ocular dominance, V-1
Introduction
Neurons within the mammalian primary visual cortex (V-1) are spatially organized according to their distinct physiological properties. In cats and some primates, neurons that connect preferentially to the right eye are grouped within regions of V-1 that are separate from neurons that connect preferentially to the left eye (Hubel and Wiesel, 1959, 1962, 1968). This feature of ocular dominance segregation is most obvious in layer IV where it is anatomically represented by alternating bands of neurons that receive input primarily from the right or left eye (Hubel and Wiesel, 1972; LeVay et al., 1975). These cortical bands of eye preference, called ocular dominance columns, are organized parallel to the surface of V-1 and span its full extent. The development of ocular dominance columns occurs early in life and is strongly influenced by visual experience. When vision is disrupted by closing one eye (monocular deprivation) early in postnatal life, there is significant reorganization of connections so that most V-1 neurons respond primarily or exclusively to stimulation of the open eye (Wiesel and Hubel, 1963a; Hubel et al., 1977). These changes are accompanied by a vision impairment that is thought to result from deprivation-induced reorganization of neural connections serving the deprived eye (Wiesel and Hubel, 1963a; Von Noorden, 1973; Giffin and Mitchell, 1978). The mechanisms that permit restructuring of neural connections after visual deprivation are at present poorly understood. We have begun to examine features of the cytoskeleton within neurons of the primary visual cortex to evaluate the possibility that cytoskeletal changes are involved in the neuronal reorganization that occurs with monocular deprivation.
Neurofilament protein is an element of the cytoskeleton that contributes to the structure and function of a neuron (Lasek, 1981). The precisely structured network of neuronal connections within the visual system is made possible because of neurofilaments and other cytoskeleton elements. A change in neurofilament expression could alter the system of functionally important connections within the visual cortex, precluding the normal processing of visually driven neural signals. In the lateral geniculate nucleus (LGN) of monocularly deprived cats, neurons located in deprived layers show significant morphological changes (Wiesel and Hubel, 1963b) and a substantial loss of neurofilament labeling (Bickford et al., 1998). The coincidence of morphological changes and neurofilament loss within deprived-eye LGN neurons raises the possibility that the two events are causally related: the loss of neurofilament protein may permit structural changes. In this paper we explore the notion that, in addition to changes in LGN input to V-1, monocular deprivation produces reorganization of neural connections intrinsic to V-1.
Materials and Methods
Animals and Rearing Conditions
The patterns of cytochrome oxidase (CO), non-phosphorylated neurofilament and phosphorylated neurofilament were examined in six hemispheres from three normal rhesus macaque monkeys (one at 4 months of age and two adults), and ten hemispheres from five monocularly deprived rhesus macaque monkeys (three at 3 months of age and two adults) (see Table 1). Animals were monocularly deprived by eyelid suture either 1 week after birth or in adulthood, and all were euthanized after 3 months of monocular deprivation. Details of the eyelid suture were as described previously (Raviola and Wiesel, 1985). Immediately prior to euthanasia, all deprived monkeys underwent an ophthalmological examination (performed by Dr Elio Raviola) to ensure that there were no obvious retinal abnormalities. All procedures were approved by the Harvard Medical Area Standing Committee on Animals.
Table 1.
Experimental Animals
| Monkey name | Sex | Stains and labels | Condition |
|---|---|---|---|
| Mac 12 | Male | CO, SMI-32, SMI-34 | 4 month normal |
| Mac 3 | Male | CO, SMI-32, SMI-34 | Adult normal |
| Mac 4 | Male | CO, SMI-32, SMI-34 | Adult normal |
| Mac 1 | Male | CO, SMI-32 | 3 month MD |
| Mac 2 | Male | CO, SMI-32, SMI-34 | 3 month MD |
| Mac 7 | Male | CO, SMI-32, SMI-34, Nissl | 3 month MD |
| Mac 6 | Female | CO, SMI-32, SMI-34, Nissl | Adult MD |
| Mac 10 | Male | CO, SMI-34, SMI-34, Nissl | Adult MD |
Histology
Animals were euthanized with a lethal dose of Nembutal (150 mg/kg) and perfused transcardially with cold 0.9% saline (4°C, 200-500 ml) until circulating fluid was clear, followed by cold (4°C) 4% formalin in phosphate buffered saline, pH 7.4 (200-500 ml). The brain was then removed from the skull and V-1 was gently flattened between glass slides and post-fixed in 4% formalin with 30% sucrose for 30 min. The flattened cortex was then transferred to phosphate buffered saline with 30% sucrose and allowed to free float overnight. Tissue was cut tangentially into 50 μm sections using a freezing microtome. All hemispheres followed this procedure with the exception of three that were cut in the coronal plane.
Sections were reacted for either CO, non-phosphorylated neurofilament protein, or phosphorylated neurofilament protein. Non-phosphorylated and phosphorylated neurofilament protein were labeled using the monoclonal antibodies SMI-32 and SMI-34, respectively (Sternberger Monoclonals, Lutherville, MD). These antibodies recognize non-phosphorylated (SMI-32; Lee et al., 1988) and phosphorylated (SMI-34; Sternberger et al., 1985) epitopes on heavy and medium molecular weight subunits of neurofilament protein. Free floating tissue sections cut for SMI-32 or SMI-34 immunoreactivity were preincubated for 1 h in Tris-buffered saline (TBS) containing 0.1% Triton X-100 and 5% normal goat serum. Sections were then incubated overnight in TBS containing 0.1% Triton X-100, 5% normal goat serum and primary monoclonal antibody (1:2000). On the following day, immunoreactivity was revealed using a Vectastain ABC kit (Vector Laboratories, Burlingame, CA) and chromogen 3,3′-diaminobensidine (DAB) with peroxide.
CO staining followed procedures outlined previously (Wong-Riley, 1979; Horton, 1984; Murphy et al., 1995). Sections cut for CO reactivity were mounted on gelatin coated glass slides and air dried overnight. The next day, sections were incubated in phosphate buffer (0.1 M, pH 7.4) that contained a mixture of cytochrome C oxidase, catalase, and DAB. Sections were reacted at 40°C in an incubator for ∼8 h. The tissue was then dehydrated in a series of graded alcohols, defatted in xylenes, and coverslipped with DPX mounting medium (BDH Labs, Poole, England).
Quantification
The patterns of CO staining and neurofilament labeling were compared by aligning adjacent sections using the nearly identical pattern of radial blood vessels between sections. Measurements of optical intensity were taken from digital images of tissue that were scanned with a high resolution professional flatbed scanner (PowerLook III, UMAX, Dallas, TX). Ocular dominance column borders were determined in an automated fashion using a Matlab routine that plotted a contour based on the contrast in CO staining between dark and light bands through layer IV of V-1 (Duffy and Livingstone, 2003). The Matlab routine was configured to draw a contour at half the maximum to minimum optical staining intensity calculated from the digitized tissue section. These values were recalculated for each section examined to account for global differences in staining intensity. Measurements of optical intensity were then recorded from the program-defined deprived (light bands) and non-deprived (dark bands) areas of V-1. For each of the four hemispheres quantified, 25-50 optical intensity measurements from deprived and non-deprived regions were taken from the parafoveal region, with the analysis window for each being ∼20 mm2 in area.
Quantification of cell density was performed for non-phosphorylated neurofilament labeling (SMI-32). A computer application (Neurolucida, MicroBrightField, Inc., Williston, UT) was used to plot labeled cell bodies under high magnification. Only neurons with obvious labeling were counted. Cell plots were taken from the parafoveal regions of V-1 that represented an area of cortex that was ∼20 mm2. Using the nearly identical radial blood vessel pattern between sections, cell plots were spatially aligned with sections stained for CO and the density of neurons in deprived versus non-deprived areas of V-1 was calculated. Neurons that were not clearly within deprived or non-deprived regions were not included in our analysis. For both optical and numeric density analyses, statistical comparisons between deprived and non-deprived areas were made using a t-test.
Results
Normal Monkeys
The antibodies we used in this study (SMI-32 and SMI-34) were targeted against non-phosphorylated or phosphorylated epitopes on medium and heavy subunits of the neurofilament triplet protein. Neurofilaments that are located within somata and dendrites are generally non-phosphorylated while neurofilaments located within axons are phosphorylated (Sternberger and Sternberger, 1983). In the present study we examined the expression of both non-phosphorylated and phosphorylated neurofilaments in V-1.
The results from our examination of non-phosphorylated neurofilament labeling in normal adult monkeys were consistent with that of previous studies (Hof and Morrison, 1995; Chaudhuri et al., 1996; Kogan et al., 2000; Fenstemaker et al., 2001; Duffy and Livingstone, 2003). Sections from a normal adult monkey primary visual cortex cut in the coronal plane (Fig. 1E) showed strong labeling within the somata and dendrites of neurons (mostly pyramidal) within layers II/III, IVB, V and VI. The results from a 4 month old normal monkey were similar to the adult except that layers II/III showed relatively weak labeling indicating that a mature level of non-phosphorylated neurofilament labeling had not occurred by this age (Fig. 1B). In both infants and adults, coronal sections of V-1 that were labeled for phosphorylated neurofilament (Fig. 1C,F) showed the expected strong reactivity within axons, and the dense labeling was isolated to layer IVCα. In both infants and adults, phosphorylated neurofilament labeling was comparatively weak in the layers outside of IVCα. Layer IVCα receives strong input from magnocellular neurons of the LGN (Hendrickson et al., 1978) that are known to be rich with this type of neurofilament (Chaudhuri et al., 1996), thus the strong phosphorylated neurofilament reactivity observed in layer IVCα is likely the result of axonal input from the magnocellular LGN layers. Therefore, while non-phosphorylated neurofilament labeling targets neurons intrinsic to V-1, phosphorylated neurofilament labeling in V-1 mainly targets axonal inputs that likely originate from LGN neurons.
Figure 1.
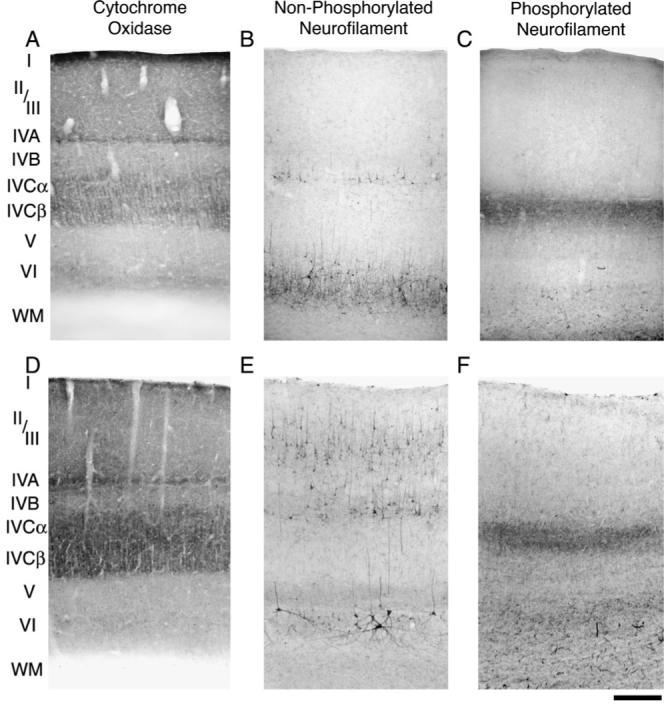
Coronal sections of monkey V-1 reacted for CO, non-phosphorylated, and phosphorylated neurofilament from a normal 4 month old infant (A, B and C) and a normal adult (D, E and F). Non-phosphorylated neurofilament labeling in the infant (B) and adult (E) was strong in layers VI, V and IVB. Although there was heavy layer II/III reactivity in the adult, the infant showed light labeling. Phosphorylated neurofilament labeling was strong within layer IVCα in the infant (C) and adult (F) but comparatively weak in all other layers. Scale bar = 250 μm.
Infant Monocular Deprivation
The primary visual cortex after monocular deprivation from near birth to 3 months of age was significantly different from normal: deprivation produced a substantial change in CO staining within V-1 that, in tangential sections, appeared as a pattern of alternating light and dark bands (Fig. 2A,C). The regularity and combined width of adjacent light and dark bands assessed in this study (mean ± SD = 781± 78 μm) were consistent with previous assessments of ocular dominance columns (Hubel et al., 1977; Horton and Hocking, 1996). We made the assumption that our observed loss of CO occurred within the deprived eye’s ocular dominance columns because light bands of CO staining after monocular deprivation have previously been used to identify regions of V-1 that receive input from deprived-eye neurons (Wong-Riley, 1979; Horton, 1984; Hendry and Jones, 1986; Hendry and Bhandari, 1992; Chaudhuri et al., 1995; Horton and Hocking, 1997). The banded CO pattern was obvious throughout layer IVB and layer IVCα, but the remaining layers (including IVCβ) were not obviously different from normal. These results indicate that monocular lid suture beginning near the time of birth can have a dramatic impact on the expression of CO within V-1.
Figure 2.
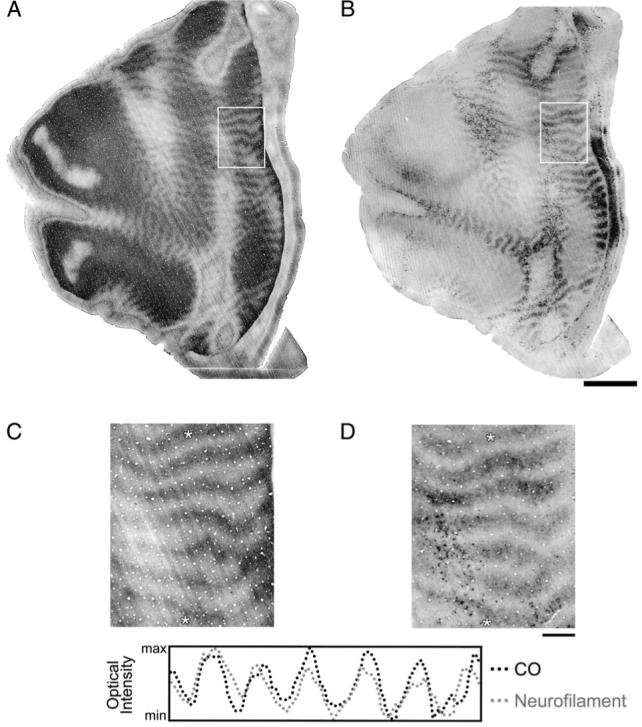
Adjacent sections of V-1 from a 3-month-old monocularly deprived monkey (Mac 1) that were cut tangential to the cortical surface and reacted for CO (A) or non-phosphorylated neurofilament (B). Both reactions revealed a banded pattern of alternating dark and light stripes that was found within layer IVB and IVCα (for CO) and layer IVB (for non-phosphorylated neurofilament). Higher magnification views of the patterns boxed with white borders are shown in (C) and (D). Aligning the two sections using the nearly identical pattern of radial blood vessels revealed that the two patterns were coincident: the light bands of CO overlapped with the light bands of non-phosphorylated neurofilament. The dark dots obvious throughout the neurofilament labeled section (D) are large layer IVB multipolar neurons that expressed dense labeling. A profile of optical intensity was plotted along the same region of the two sections (between the white asterisks in C and D). The patterns of the two profiles overlapped and were strongly correlated (r = 0.8). Therefore, monocular deprivation for 3 months shortly after birth resulted in a substantial loss of both CO and non-phosphorylated neurofilament. Scale bars = 5 mm (A and B) and 1 mm (C and D).
The pattern of non-phosphorylated neurofilament labeling after monocular deprivation was similar to that of CO: alternating dark and light bands of labeled somata and dendrites were obvious throughout layer IVB (Fig. 2B,D). None of the normal animals we examined showed a banded pattern. The bands of neurofilament labeling were clearest within layer IVB, but were also evident, albeit less distinctly, within layer VI (Fig. 3). Using the nearly identical pattern of radial blood vessels between tangentially cut sections, we aligned the bands of CO staining and non-phosphorylated neurofilament labeling in layer IV (Fig. 2C,D) and determined that the two patterns were coincident: the light bands of CO staining overlapped with the light bands of neurofilament labeling. Thus, the loss of neurofilament occurred within deprived-eye ocular dominance columns. Because non-phosphorylated neurofilament labeling is immature in the superficial layers at 3 months of age, we were unable to assess the effect of monocular deprivation on neurofilament labeling in these layers.
Figure 3.
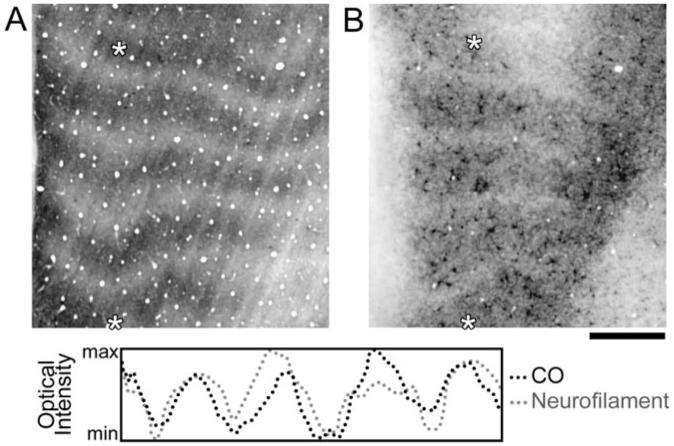
Sections of V-1 cut parallel to the cortical surface from a 3 month old monocularly deprived monkey (Mac 1). This figure shows the banded patterns of CO staining in layer IVCα (A) as well as non-phosphorylated neurofilament labeling in layer VI (B). Optical profiles that were plotted from the same regions of both sections (highlighted with white asterisks) showed that the two patterns overlapped (C) and were strongly correlated (r = 0.64). This figure demonstrates that, like layer IVB, layer VI also lost non-phosphorylated neurofilament labeling within regions that are radially aligned with deprived areas in layer IV. Note also that the peaks for the neurofilament profile (gray dots) are broader, and the troughs more narrow, compared with the CO profile (black dots). This result is consistent with the qualitative observation that the neurofilament loss in layer VI is less pronounced than that in layer IVB. Scale bar = 1 mm.
Neurofilaments come in two phosphorylation states: non-phosphorylated, found mainly in somata and dendrites, and phosphorylated, found mainly in axons. In a separate monkey we examined whether phosphorylated neurofilament labeling was impacted by monocular deprivation in the same way as was non-phosphorylated neurofilament labeling. The pattern of phosphorylated neurofilament labeling within layer IVCα was arranged into alternating light and dark bands after monocular deprivation (Fig. 4). By aligning the non-phosphorylated and phosphorylated neurofilament sections we determined that the two patterns were coincident (Fig. 4C,D).
Figure 4.
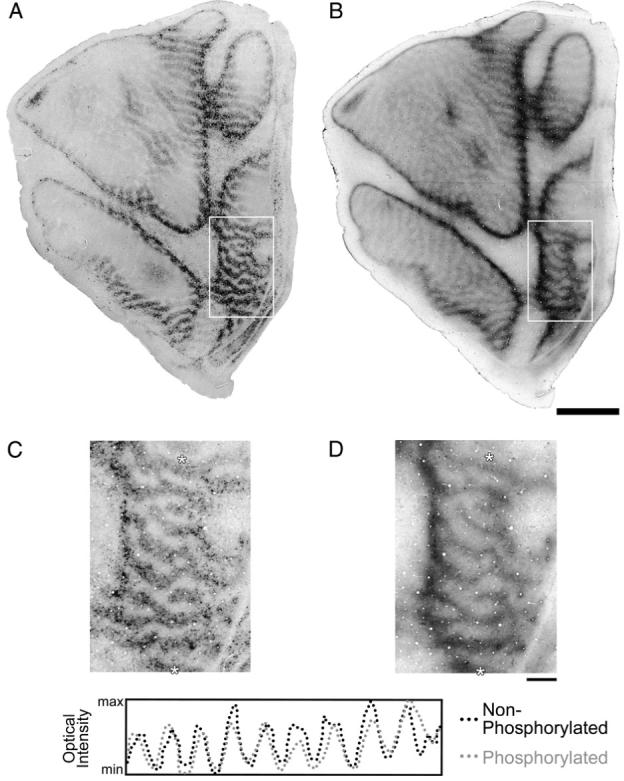
This figure shows two sections from a 3-month-old monocularly deprived monkey (Mac 2) that were cut tangential to the surface of V-1 and labeled for non-phosphorylated neurofilament (A) or phosphorylated neurofilament (B). These sections were taken from different parts of layer IV: the non-phosphorylated pattern from layer IVB, and the phosphorylated pattern from layer IVCα. The outlined areas (white boxes) in each section are shown at higher magnification in (C) and (D) to facilitate comparison of the two patterns. The two sections showed a similar pattern of alternating dark and light bands (C and D). These sections were precisely aligned using the pattern of blood vessels and an optical intensity profile from the same region of each section (between the white asterisks in C and D) was plotted. The two intensity profiles overlapped and were strongly correlated (r = 0.76), demonstrating that there was a loss of both non-phosphorylated and phosphorylated neurofilament after infant monocular deprivation. Scale bars = 5 mm (A and B) and 1 mm (C and D).
Figure 5 demonstrates the coincident patterns of CO, non-phosphorylated neurofilament, and phosphorylated neurofilament in the same hemisphere of a 3-month-old monocularly deprived monkey. Therefore, infant monocular deprivation led to a loss of both non-phosphorylated neurofilament and phosphorylated neurofilament in deprived-eye ocular dominance columns. To more thoroughly characterize the loss of neurofilament labeling, non-phosphorylated neurofilament labeled cell bodies were plotted and aligned with the patterns of CO staining and phosphorylated neurofilament labeling (Fig. 5D- F). Numeric density measurements were then taken for deprived and non-deprived ocular dominance columns (see methods). There were significantly fewer heavily labeled neurons (P < 0.05) within deprived-eye columns (37 neurons/mm2; SD = 14 neurons/mm2) compared with non-deprived columns (137 neurons/mm2;SD = 22 neurons/mm2).
Figure 5.
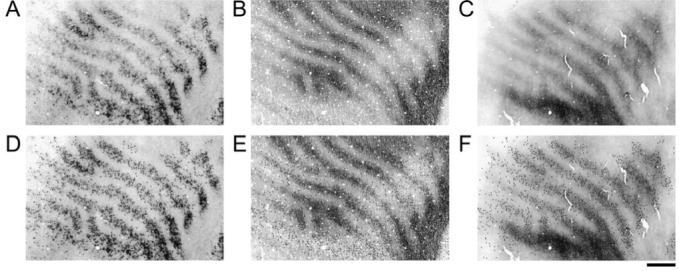
This figure demonstrates the patterns of non-phosphorylated neurofilament (A), CO (B) and phosphorylated neurofilament (C) within V-1 from the same hemisphere of a 3-month-old monocularly deprived monkey (Mac 7). Non-phosphorylated neurofilament labeled cell bodies were plotted (dots in D) and then superimposed on the patterns of CO staining (E) and phosphorylated neurofilament labeling (F). There were significantly fewer non-phosphorylated labeled neurons within deprived as compared with non-deprived regions of V-1 (P < 0.05).
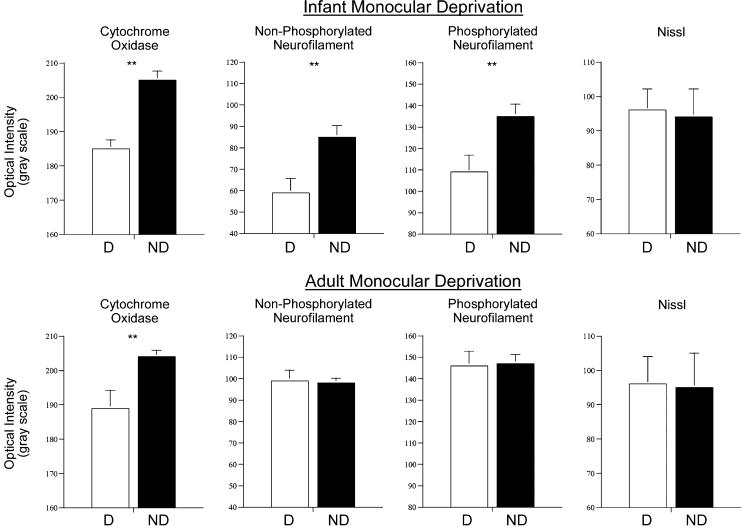
The distribution of nissl staining throughout V-1 was examined to determine if the loss of neurofilament labeling was due to a reduction in the number of neurons within deprived regions of V-1. A reduced number of neurons could explain the significant decrease in neurofilament expression. Adjacent nissl stained sections cut above and below the striped layer IVB neurofilament pattern showed uniform nissl staining with no evident differences between deprived and non-deprived ocular dominance columns (quantification in Fig. 7). These results indicate that the loss of neurofilament labeling in V-1 cannot simply be explained by a loss of V-1 neurons.
Figure 7.
Optical intensity measurements from deprived (D) and non-deprived (ND) regions of V-1 are graphed for CO, non-phosphorylated neurofilament, phosphorylated neurofilament, and nissl after 3 months of infant or adult monocular deprivation. After infant deprivation, all markers except nissl staining showed a significant decrease in deprived regions of V-1. Results from adult deprivation showed a similar loss of CO staining compared with infant deprivation but no loss of either neurofilament labeling within deprived regions of V-1. These results indicate that the loss of neurofilament labeling as a result of monocular deprivation occurred only when deprivation began within the highly plastic sensitive period early in life. Double asterisks indicate significant difference (P < 0.05).
Adult Monocular Deprivation
Monocular deprivation initiated in adulthood does not have the same effect that it does in infants. Adult deprivation does not cause rearrangement of ocular dominance in V-1 (Hubel and Wiesel, 1970; LeVay et al., 1980; Horton and Hocking, 1997), and there are no associated vision impairments when deprivation is started in adulthood (von Noorden, 1973). If neurofilament loss after infant monocular deprivation contributes to the reorganization of connections that favors the open eye, the loss should not be present in monkeys deprived in adulthood.
Monocular deprivation for 3 months initiated in adult monkeys led to a small change in CO staining compared with 3 months of deprivation within infancy. Faint bands of dark and light CO staining were found within layer IV (Fig. 6A). These results resembled those found after infant deprivation with the exception that the reduction of CO staining in deprived regions of V-1 was not as great in the adult and thus revealed a lower contrast pattern of ocular dominance columns. Monocular deprivation in the adult did not lead to a loss of either non-phosphorylated or phosphorylated neurofilament protein within V-1. The monocularly deprived adults showed dense neurofilament labeling throughout V-1 that was comparable to normal animals (Fig. 6B,D). These findings indicate that the loss of neurofilament occurs only when deprivation is started during the highly plastic sensitive period early in life when columnar organizations remain susceptible to changes in visual input. We believe these results strengthen the notion that deprivation-induced neurofilament loss in infancy is involved in the reorganization of neural connections that occurs with monocular deprivation.
Figure 6.
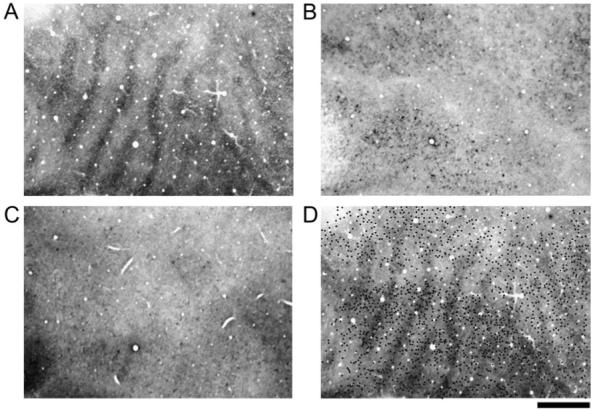
The patterns of CO (A), non-phosphorylated neurofilament (B) and phosphorylated neurofilament (C) in V-1 of a monocularly deprived adult monkey (Mac 6). This monkey was deprived for 3 months at 7 years of age. The deprivation produced a low contrast pattern of dark and light CO bands throughout V-1 (A). Non-phosphorylated (B) and phosphorylated (C) neurofilament labeling was not banded after adult monocular deprivation. Non-phosphorylated labeled cell bodies were plotted and then superimposed onto the aligned pattern of CO (dots in D). Labeled neurons were roughly evenly distributed within both deprived and non-deprived regions of V-1. Adult monocular deprivation did not result in a loss of neurofilament labeling within V-1. Scale bar = 1 mm.
To quantify our result in infants and adults, we measured optical labeling intensity in layer IV from deprived and non-deprived regions of V-1 (see methods). After 3 months of infant monocular deprivation, optical intensity measurements for CO, non-phosphorylated neurofilament, and phosphorylated neurofilament were significantly lower (P < 0.05) in deprived compared with non-deprived ocular dominance columns (Fig. 7). The optical intensity measurements for Nissl were not different between deprived and non-deprived areas, supporting the argument that the loss of CO and neurofilament protein was not due to a reduction in the number of neurons. Optical intensity measured from V-1 after 3 months of adult monocular deprivation showed a decrease in CO staining within deprived ocular dominance columns (P < 0.05), but neurofilament labeling intensity in deprived and non-deprived areas were not statistically different. We were also able to quantify the density of non-phosphorylated neurofilament labeled neurons in deprived and non-deprived regions of V-1 because the antibody distinctly reveals neuronal cell bodies. Infant deprivation led to significantly fewer non-phosphorylated neurofilament labeled neurons in deprived ocular dominance columns (P < 0.05), however, adult deprivation produced no significant density difference between columns.
Discussion
In this paper we have examined the pattern of neurofilament labeling in the primary visual cortex of monocularly deprived macaque monkeys. There was a significant reduction of both non-phosphorylated and phosphorylated neurofilament labeling within the deprived-eye’s ocular dominance columns when monocular deprivation was initiated near the time of birth and lasted 3 months, but not when deprivation was started in adulthood. These results raise the possibility that monocular deprivation started early in development causes morphological restructuring of deprived-eye V-1 neural connections that requires deconstruction of the cytoskeleton.
Monocular deprivation in early infancy can produce dramatic morphological changes of neurons in the visual system. Neuronal cell bodies in the deprived layers of the LGN show significant atrophy after monocular deprivation (Wiesel and Hubel, 1963b), and the dendrites of some of these cells exhibit morphological changes (Friedlander et al., 1982). The termination fields of deprived-eye LGN axons within V-1 also show substantial atrophy after monocular deprivation (Antonini and Stryker, 1993). Although the neural mechanisms that permit these dramatic morphological changes are largely unknown, examination of cytoskeleton proteins in the LGN has provided some insight. A study examining the effect of monocular deprivation on neurofilament labeling in the LGN has demonstrated a significant loss in neurons that receive input from the deprived eye (Bickford et al., 1998). Neurofilaments help to maintain the architecture of neural networks, a change in neural connectivity may require a breakdown of the cytoskeleton elements that endow structure. Thus, the loss of neurofilament in deprived-eye neurons of the LGN may permit morphological changes to occur during monocular deprivation. Similarly, the loss of neurofilament labeling we have observed in deprived-eye V-1 neurons may be necessary for remodeling of neural processes after deprivation.
In cat visual cortex, monocular deprivation early in life causes rapid structural remodeling of geniculocortical afferents within the first week of monocular deprivation (Antonini and Stryker, 1993). Our results raise the possibility that neurons within V-1 also remodel but likely over a longer time frame compared with the LGN. Morphological changes of V-1 neurons could be expected to occur over a longer time frame because this process would not only involve elimination of existing connections, but also the formation of new connections; a process that is molecularly different than elimination of synapses alone (Muller and Griesinger, 1998). In contrast, the deprivation-induced remodeling of LGN afferents involves either disconnection (deprived eye), or elaboration that increases the breadth of connections (non-deprived eye). The remodeling of V-1 neurons after monocular deprivation may occur over a longer period of time because the process of morphological change is mechanistically different from that which occurs for LGN afferents.
The loss of phosphorylated neurofilament-H (SMI-34) within layer IVCα after infant monocular deprivation could be caused by morphological changes to axons originating from the deprived-eye magnocellular layers in the LGN. Cells in these LGN layers are heavily labeled for neurofilament-H (Chaudhuri et al., 1996), and are known to preferentially innervate layer IVCα of V-1 (Hendrickson et al., 1978). Furthermore, monocular deprivation causes a substantial loss of neurofilament-H labeling in LGN cells connected to the deprived eye (Bickford et al., 1998). Therefore, the deprivation-induced loss of phosphorylated neurofilament in the axons of layer IVCα is likely due a reduction of neurofilament in magnocellular LGN neurons. The loss of non-phosphorylated neurofilament (SMI-32) is most obvious in layer IVB somata and dendrites. Layer IVB does not receive direct input from the LGN (Hendrickson et al., 1978) thus we assume that our observed loss of non-phosphorylated neurofilament labeling reflects a change to the intrinsic circuitry of V-1.
Cytochome oxidase histochemistry in monocularly lid sutured monkeys has been reported not to reveal ocular dominance columns with deprivation from birth to one year (Horton and Stryker, 1993; Horton and Hocking, 1997). Our results from layer IVCβ are consistent with this: CO staining was uniform in layer IVCβ in the three monkeys deprived near the time of birth. The results from layers IVB and IVCα, however, were different. A clear pattern of ocular dominance columns was found throughout IVB and IVCα when V-1 was stained for CO after 3 months of monocular deprivation. The main difference between the studies is that our monkeys were euthanized at 3 months of age, while those of Horton and Stryker (1993) and Horton and Hocking (1997) were euthanized between 11 to 21 months of age. Thus it appears that extending deprivation beyond 3 months of age abolishes the effect of deprivation on CO staining. This suggests that the eye-specific loss of both CO and neurofilaments may be transient. It will be interesting to examine various deprivation durations to determine if the neurofilament loss is transient and to better characterize the temporal dynamics of CO and neurofilament change.
It is unlikely that the loss of neurofilament labeling in deprived eye ocular dominance columns was caused by the spatially coincident loss of CO staining. Several studies have shown that there is not a simple relationship between these two anatomical features. First, adjacent sections of V-1 processed for either CO or neurofilament (SMI-32) from monkeys that are rendered strabismic exhibit alternating light and dark stripes that are spatially complementary: the pale neurofilament stripes aligned with dark CO stripes (Fenstemaker et al., 2001). Secondly, within the superficial layers of monkey V-1, the CO rich blobs are weakly labeled for neurofilament (SMI-32) compared with the CO poor inter-blobs (Duffy and Livingstone, 2003). Lastly, our results from adult monocular deprivation demonstrate a loss of CO without a change in neurofilament labeling (Fig. 7). Therefore, we believe that the loss of neurofilament labeling after infant monocular deprivation is not caused simply by a reduction of CO staining.
The eye-specific reduction of CO staining after 3 months of monocular deprivation was isolated to layers IVB and IVCα of V-1; the layers that also showed a substantial decrease in neurofilament labeling: non-phosphorylated and phosphorylated, respectively. Although it is unlikely that the deprivation-induced reduction of neurofilament labeling was due to reduced CO staining, the loss of neurofilament labeling in deprived ocular dominance columns may indirectly contribute to metabolic levels and thus CO staining in these regions. Synaptic connections and transmission are dramatically altered after monocular deprivation so that few neurons respond to stimulation of the deprived eye (Wiesel and Hubel, 1963a) and physiological activity in deprived regions is reduced (Kennedy et al., 1976). The loss of neurofilament in layers IVB and IVCα may contribute to the functional disconnection of the deprived eye that leads to a decrease in neural activity and thus CO levels.
The present result is not the first to demonstrate cytoskeleton changes in V-1 as a consequence of monocular deprivation. There is a significant loss of microtubule-associated protein 2 (MAP 2) in layer IV that occurs with deprivation via monocular injections of tetrodotoxin (TTX) in adult monkeys (Hendry and Bhandari, 1992). Even though the loss of MAP 2 labeling was restricted to the deprived eye’s ocular dominance columns, these results seem somewhat contradictory to our present findings because we demonstrate that neurofilament labeling shows no obvious change in adult animals subject to monocular deprivation. The main difference between these two studies is the method used for deprivation: suture vs. TTX injections. Tetrodotoxin injection in adult monkeys eliminates retinal ganglion cell activity and consequently causes substantial reduction in activity markers within the injected eye’s ocular dominance columns (Hendry and Bhandari, 1992; Dyck et al., 2003). These dramatic anatomical changes could initiate transneuronal degeneration in the brain regions that connect to the injected eye and thus explain the loss of MAP 2 in deprived eye’s ocular dominance columns. Unlike TTX injections, monocular deprivation by lid suture does not eliminate retinal activity and has only a mild impact on activity markers in V-1 (Horton, 1984; Horton and Hocking, 1998). Furthermore, complete elimination of retinal activity in one eye of adult monkeys has been shown to induce ocular dominance plasticity, something that does not occur with adult lid suture (LeVay et al., 1980). Thus, the loss of MAP 2 in the adult visual cortex after monocular TTX injections may be due to degeneration and/or morphological changes. It is also worth mentioning the possibility that MAP 2 and neurofilament protein are influenced differently by monocular deprivation. Determining whether there is a loss of MAP 2 labeling after adult monocular lid suture could help to reconcile these results.
Our findings demonstrate that monocular deprivation started near birth causes an eye-specific loss of neurofilament protein within the monkey primary visual cortex. The loss of neurofilament may be the consequence of restructuring neural connections within V-1 as a result of abnormal sensory input caused by monocular deprivation. The prominent belief is that deprivation-induced ocular dominance shifts occur mainly as a consequence of input changes from neurons within the LGN. Our present results support the notion that intrinsic V-1 neural connections, in addition to LGN changes, are modified and may contribute to the neural abnormalities found after monocular deprivation. These results also provide insight toward understanding the neural mechanisms that mediate the neural and behavioural changes that accompany visual deprivation.
Acknowledgments
This work was supported by NEI grant EY13135 to M.S.L., NSERC grant RGPIN298167 to K.R.D. and a grant from the Lefler Center to M.S.L. The authors thank Dr Elio Raviola for his help with this research. We also thank Dr Vladimir Berezovskii, Dr Donald Mitchell, and Matthew Kutcher for their helpful comments on the manuscript.
References
- Antonini A, Stryker MP. Rapid remodeling of axons in the visual cortex. Science. 1993;260:1819–1821. doi: 10.1126/science.8511592. [DOI] [PubMed] [Google Scholar]
- Bickford ME, Guido W, Godwin DW. Neurofilament proteins in Y-cells of the cat lateral geniculate nucleus: normal expression and alteration with visual deprivation. J Neurosci. 1998;18:6549–6557. doi: 10.1523/JNEUROSCI.18-16-06549.1998. [DOI] [PMC free article] [PubMed] [Google Scholar]
- Chaudhuri A, Matsubara JA, Cynader MS. Neuronal activity in primate visual cortex assessed by immunostaining for the transcription factor Zif268. Vis Neurosci. 1995;12:35–50. doi: 10.1017/s095252380000729x. [DOI] [PubMed] [Google Scholar]
- Chaudhuri A, Zangenehpour S, Matsubara JA, Cynader MS. Differential expression of neurofilament protein in the visual system of the vervet monkey. Brain Res. 1996;709:17–26. doi: 10.1016/0006-8993(95)01217-6. [DOI] [PubMed] [Google Scholar]
- Duffy KR, Livingstone MS. Distribution of non-phosphorylated neurofilament in squirrel monkey V1 is complementary to the pattern of cytochrome-oxidase blobs. Cereb Cortex. 2003;13:722–727. doi: 10.1093/cercor/13.7.722. [DOI] [PMC free article] [PubMed] [Google Scholar]
- Dyck RH, Chaudhuri A, Cynader MS. Experience-dependent regulation of the zincergic innervation of visual cortex in adult monkeys. Cereb Cortex. 2003;13:1094–1109. doi: 10.1093/cercor/13.10.1094. [DOI] [PubMed] [Google Scholar]
- Fenstemaker SB, Kiorpes L, Movshon JA. Effects of experimental strabismus on the architecture of macaque monkey striate cortex. J Comp Neurol. 2001;438:300–317. doi: 10.1002/cne.1317. [DOI] [PubMed] [Google Scholar]
- Friedlander MJ, Stanford LR, Sherman SM. Effects of monocular deprivation on the structure-function relationship of individual neurons in the cat’s lateral geniculate nucleus. J Neurosci. 1982;2:321–330. doi: 10.1523/JNEUROSCI.02-03-00321.1982. [DOI] [PMC free article] [PubMed] [Google Scholar]
- Giffin F, Mitchell DE. The rate of recovery of vision after early monocular deprivation in kittens. J Physiol. 1978;274:511–537. doi: 10.1113/jphysiol.1978.sp012164. [DOI] [PMC free article] [PubMed] [Google Scholar]
- Hendrickson AE, Wilson JR, Ogren MP. The Neuroanatomical Organization Of Pathways Between The Dorsal Geniculate Nucleus And Visual Cortex In Old World And New World Primates. J Comp Neurol. 1978;182:123–136. doi: 10.1002/cne.901820108. [DOI] [PubMed] [Google Scholar]
- Hendry SH, Bhandari MA. Neuronal organization and plasticity in adult monkey visual cortex: immunoreactivity for microtubule-associated protein 2. Vis Neurosci. 1992;9:445–459. doi: 10.1017/s0952523800011251. [DOI] [PubMed] [Google Scholar]
- Hendry SH, Jones EG. Reduction in number of immunostained GABAergic neurons in deprived-eye dominance columns of monkey area 17. Nature. 1986;320:750–752. doi: 10.1038/320750a0. [DOI] [PubMed] [Google Scholar]
- Hof PR, Morrison JH. Neurofilament protein defines regional patterns of cortical organization in the macaque monkey visual system: a quantitative immunohistochemical analysis. J Comp Neurol. 1995;352:161–186. doi: 10.1002/cne.903520202. [DOI] [PubMed] [Google Scholar]
- Horton JC. Cytochrome oxidase patches: a new cytoarchitectonic feature of monkey visual cortex. Phil Trans R Soc Lond B Biol Sci. 1984;304:199–253. doi: 10.1098/rstb.1984.0021. [DOI] [PubMed] [Google Scholar]
- Horton JC, Hocking DR. Intrinsic variability of ocular dominance column periodicity in normal macaque monkeys. J Neurosci. 1996;16:7228–7239. doi: 10.1523/JNEUROSCI.16-22-07228.1996. [DOI] [PMC free article] [PubMed] [Google Scholar]
- Horton JC, Hocking DR. Timing of the critical period for plasticity of ocular dominance columns in macaque striate cortex. J Neurosci. 1997;17:3684–3709. doi: 10.1523/JNEUROSCI.17-10-03684.1997. [DOI] [PMC free article] [PubMed] [Google Scholar]
- Horton JC, Hocking DR. Monocular core zones and binocular border strips in primate striate cortex revealed by the contrasting effects of enucleation, eyelid suture, and retinal laser lesions on cytochrome oxidase activity. J Neurosci. 1998;18:5433–5455. doi: 10.1523/JNEUROSCI.18-14-05433.1998. [DOI] [PMC free article] [PubMed] [Google Scholar]
- Horton JC, Stryker MP. Amblyopia induced by anisometropia without shrinkage of ocular dominance columns in human striate cortex. Proc Natl Acad Sci USA. 1993;90:5494–5498. doi: 10.1073/pnas.90.12.5494. [DOI] [PMC free article] [PubMed] [Google Scholar]
- Hubel DH, Wiesel TN. Single unit activity in striate cortex of unrestrained cats. J Physiol. 1959;147:226–238. doi: 10.1113/jphysiol.1959.sp006238. [DOI] [PMC free article] [PubMed] [Google Scholar]
- Hubel DH, Wiesel TN. Receptive fields, binocular interaction and functional architecture in the cat’s visual cortex. J Physiol. 1962;160:106–154. doi: 10.1113/jphysiol.1962.sp006837. [DOI] [PMC free article] [PubMed] [Google Scholar]
- Hubel DH, Wiesel TN. Receptive fields and functional architecture of monkey striate cortex. J Physiol. 1968;195:215–243. doi: 10.1113/jphysiol.1968.sp008455. [DOI] [PMC free article] [PubMed] [Google Scholar]
- Hubel DH, Wiesel TN. The period of susceptibility to the physiological effects of unilateral eye closure in kittens. J Physiol. 1970;206:419–436. doi: 10.1113/jphysiol.1970.sp009022. [DOI] [PMC free article] [PubMed] [Google Scholar]
- Hubel DH, Wiesel TN. Laminar and columnar distribution of geniculo-cortical fibers in the macaque monkey. J Comp Neurol. 1972;146:421–450. doi: 10.1002/cne.901460402. [DOI] [PubMed] [Google Scholar]
- Hubel DH, Wiesel TN, LeVay S. Plasticity of ocular dominance columns in monkey striate cortex. Phil Trans R Soc Lond B. 1977;278:377–409. doi: 10.1098/rstb.1977.0050. [DOI] [PubMed] [Google Scholar]
- Kennedy C, Des Rosiers MH, Sakurada O, Shinohara M, Reivich M, Jehle JW, Sokooff L. Metabolic mapping of the primary visual system of the monkey by means of the autoradiographic [14C] deoxyglucose technique. Proc Natl Acad Sci USA. 1976;73:4230–4234. doi: 10.1073/pnas.73.11.4230. [DOI] [PMC free article] [PubMed] [Google Scholar]
- Kogan CS, Zangenehpour S, Chaudhuri A. Developmental profiles of SMI-32 immunoreactivity in monkey striate cortex. Brain Res Dev Brain Res. 2000;119:85–95. doi: 10.1016/s0165-3806(99)00162-5. [DOI] [PubMed] [Google Scholar]
- Lasek RJ. The dynamic ordering of neuronal cytoskeletons. Neurosci Res Program Bull. 1981;19:7–31. [PubMed] [Google Scholar]
- Lee VM, Otvos YL, Carden MJ, Hollosi M, Dietzschold B, Lazzarini RA. Identification of the major multiphosphorylation site in mammalian neurofilaments. Proc Natl Acad Sci USA. 1988;85:1998–2002. doi: 10.1073/pnas.85.6.1998. [DOI] [PMC free article] [PubMed] [Google Scholar]
- LeVay S, Hubel DH, Wiesel TN. The pattern of ocular dominance columns in macaque visual cortex revealed by a reduced silver stain. J Comp Neurol. 1975;159:559–576. doi: 10.1002/cne.901590408. [DOI] [PubMed] [Google Scholar]
- LeVay S, Wiesel TN, Hubel DH. The development of ocular dominance columns in normal and visually deprived monkeys. J Comp Neurol. 1980;191:1–51. doi: 10.1002/cne.901910102. [DOI] [PubMed] [Google Scholar]
- Muller CM, Griesinger CB. Tissue plasminogen activator mediates reverse occlusion plasticity in visual cortex. Nat Neurosci. 1998;1:47–53. doi: 10.1038/248. [DOI] [PubMed] [Google Scholar]
- Murphy KM, Jones DG, Van Sluyters RC. Cytochrome-oxidase blobs in cat primary visual cortex. J Neurosci. 1995;15:4196–4208. doi: 10.1523/JNEUROSCI.15-06-04196.1995. [DOI] [PMC free article] [PubMed] [Google Scholar]
- Raviola E, Wiesel TN. An animal model of myopia. N Engl J Med. 1985;312:1609–1615. doi: 10.1056/NEJM198506203122505. [DOI] [PubMed] [Google Scholar]
- Sternberger LA, Sternberger LA. Monoclonal antibodies distinguish phosphorylated and non-phosphorylated forms of neurofilament in situ. Proc Natl Acad Sci. 1983;80:6126–6130. doi: 10.1073/pnas.80.19.6126. [DOI] [PMC free article] [PubMed] [Google Scholar]
- Sternberger NH, Sternberger LA, Ulrich J. Aberrant neurofilament phosphorylation in Alzheimer disease. Proc Natl Acad Sci USA. 1985;82:4274–4276. doi: 10.1073/pnas.82.12.4274. [DOI] [PMC free article] [PubMed] [Google Scholar]
- Von Noorden GK. Experimental amblyopia in monkeys. Further behavioral observations and clinical correlations. Invest Ophthalmol Vis Sci. 1973;12:721–726. [PubMed] [Google Scholar]
- Wiesel TN, Hubel DH. Single-cell responses in striate cortex of kittens deprived of vision in one eye. J Neurophysiol. 1963a;26:1003–1017. doi: 10.1152/jn.1963.26.6.1003. [DOI] [PubMed] [Google Scholar]
- Wiesel TN, Hubel DH. Effects of visual deprivation on morphology and physiology of cells in the cats lateral geniculate body. J Neurophysiol. 1963b;26:978–993. doi: 10.1152/jn.1963.26.6.978. [DOI] [PubMed] [Google Scholar]
- Wong-Riley MTT. Changes in the visual system of monocularly sutured or enucleated cat demonstrable with cytochrome oxidase histochemistry. Brain Res. 1979;171:11–28. doi: 10.1016/0006-8993(79)90728-5. [DOI] [PubMed] [Google Scholar]


