

Abstract
Objective
The purpose of this study was to compare the surface areas of 12 atlanto-occipital joints from 6 cadavers to determine how well their ipsilateral and contralateral surface areas matched.
Methods
Three methods were used. Method 1 consisted of digitized photographs downloaded to the Able Image Analyser software program (Ljubljana, Slovenia; http://able.mulabs.com). The perimeters were measured and expressed as square millimeters. Method 2 consisted of a point count method using moulds of the joint surfaces produced by pressing aluminum paper, leaving a clear imprint for analysis. Method 3 consisted of drawing outlines of the molds from method 2 onto transparencies and assessing overlap.
Results
Method 1 showed a moderate correlation of matched articular surfaces between the left C1 superior articulating surface and the left condyle (r = 0.573, P = .01). Method 2 showed moderate correlations between all surface areas that were analyzed. The matched pairs compared were left C1 superior articulating surface and left condyle (r = 0.588, P = .01) and right C1 and right condyle (r = 0.730, P = .001). The contralateral surfaces correlated were left C1 and right C1 (r = 0.596, P = .009) and right condyle and left condyle (r = 0.769, P = .000). Method 3 showed no statistically significant differences between surface areas.
Conclusions
All 3 methods revealed that the articular surfaces of the atlas and corresponding or contralateral condyle for specimens used in this study were not an exact match.
Introduction
Theories regarding the exactness of fit between the superior articulating facet of atlas and its matching occipital surface (A/O) have been proposed,1-4 yet definitive information has not yet been presented. This is an issue of importance because several radiographic techniques base their listing systems on an assumption of symmetry of like body structures or an assumption that the A/O surfaces are exact matches.5,6 Listings are shorthand notations derived from radiographic line drawings that describe the direction of spinal misalignment on a radiograph. Information gathered to date has been based on empirical observations, often of unmatched A/O sets, or dogma based on no observations. Therefore, it is important to investigate the true relationship between these articulating surfaces because such information impacts on the criteria used to determine if an osseous misalignment is actually present. For example, in the 1950s, a distinctive radiographic method of analysis to produce vertebral listings for C1 through C4 was developed.5,6 The developer visually observed cadaver bone specimens of the occipito-atlanto-axial region. His observational studies appear to have been done on both matched and unmatched specimens, leading to a questionable sense of accuracy of the conclusions drawn. His conclusions were as follows: (1) Architectural asymmetry and malformations of the condyles existed in 77% of the cases comparing the length of the condyles with the orbital floor and 66% comparing the condyle with the skull base line.5,6 (2) Individuals with asymmetry and malformations apparently respond by invoking developmental adaptive changes in other bony structures such as increased lateral mass thickness on the side of the short condyle, elevation of the superior articulating surface (SAS) on the malformed condyle side, increased head tilt away from the malformation, and scoliosis convexing toward the side of the short condyle. (3) Articular surfaces tend to match precisely at their margins.5,6 The developer also empirically concluded that the then prevailing view of misalignment of the atlas in relation to the occiput was incorrect because the spinographic analysis used was based on the premise of symmetry from one side of the body to the other.5,6 As well, this type of analysis is important because other methods of radiographic analysis also incorporate the overlap/underlap of adjacent articulations, such as the anteroposterior open mouth and nasium radiographic views.7,8
A literature search did not reveal any studies on matched sets of atlas and occiput joint surfaces. However, a study by Panjabi et al9 reported that pairs of articular facets in the spine below the atlas do not precisely match. Another study published by Mysorekar et al10 measured unmatched articular surface areas of the atlas and occiput and found that the atlas and condyles tended to be larger on the right side. Although that study demonstrated anomalies in the surface areas, no data were presented with regard to the preciseness of fit between the articulating surfaces.10 Based on the information provided above, the objective of this study was to assess matched A/O ipsilateral and contralateral joint articular surfaces in human cadavers in regard to symmetry between opposing joint surfaces.
Methods
Six matched sets of cadaver A/O joints were taken from 3 male and 3 female subjects ranging in age from 56 to 88 years. Because of the advanced ages of the subjects, an analysis of the amount of degenerative joint disease present was completed. Severe degeneration of the A/O joints was rare, which is in agreement with the findings of Konig et al.11 Grade 0 (no sign of degeneration) and grade I (superficial degeneration) were observed in all 12 A/O joint surfaces. No grade II (cartilaginous disintegration) or grade III degeneration (appearance of subchondral bone in 50% of the articular surface) was observed using the Petersson classification.11,12 This study was reviewed by the Sherman College institutional review board and was found to be exempt from regulations mandated by US Federal guidelines relative to the use of live human subjects.
Method 1
Method 1 is a photometric method of analysis that generated digital photographs (Sony Digital MVC-FD7, 1997, China) that were downloaded and analyzed using the Able Image Analyser software (Ljubljana, Slovenia; http://able.mulabs.com). Photographs of the joint surfaces were measured to obtain data in regard to their surface areas and how precisely they fit with one another. Measurement features of the Able program included (a) point-to-point linear measurement, (b) area of circles, (c) area of ellipses or rectangles, and (d) areas of polygons and irregular shapes. This method assessed the pixels in the perimeter of the articular surfaces and converted them to area in square millimeters (15 pixels equaling 1 mm). Image resolution is 640 pixels in width and 480 pixels in height. A millimeter rule was placed in each photograph to normalize differences in focal distances, thereby minimizing magnification distortion errors. All data were analyzed from each cadaver except body 999 (right condyle), in which the surface was accidentally damaged during dissection so that only methods 2 and 3 were completed.
Method 2
Method 2, described by Mysorekar and Nandedkar (1986),10 was also used to determine surface areas. This method consisted of producing moulds of the articular surfaces of the atlas and its respective condyle by pressing a thin strip of aluminum foil, which precisely fitted each bony projection and depression, onto the articular surface of the atlas and the condyle. The margins of the facet of the atlas or condyle left a clear imprint on the aluminum paper, which was then cut out along the margins. The moulds were then mounted beneath a transparent grid, and 1-mm intersecting points were counted. The total count represents the surface area of the facet in square millimeters.
Method 3
Method 3 consisted of using the aluminum moulds from method 2 and then tracing the outlines with a thin point marker onto transparencies. This allowed opposing A/O joint surfaces to be superimposed and viewed to determine if there was exactness of fit. To test repeatability of this method, tracings, using the inside of the marker line, were repeated 3 consecutive times to compare for statistical difference.
Results
The data were analyzed for correlation and significant differences. Because the data were not normally distributed, the Spearman correlation and Wilcoxon test for differences were used to assess the data. The P value (<.05) associated with the Spearman correlation coefficient indicates that the correlation was significant. Correlations with P values > .05 indicate that the results should be confined to the present study (Tables 1 and 2).
Table 1.
Surfaces compared by photometric analysis (method 1)a
| Structures Compared | Agreement Spearman/Pb | Difference Wilcoxonc | n |
|---|---|---|---|
| Left C1 SAS vs Left Condyle | .573/.01d | .7 | 18 |
| Right C1 SAS vs Right Condyle | .090/.7 | .2 | 15 |
| Left Condyle vs Right Condyle | .235/.06 | .1 | 15 |
| Left C1 SAS vs Right C1 SAS | .452/.06 | .2 | 18 |
C1, First cervical vertebra (atlas); n, sample size.
Method 1 involved downloading digital photographs to the Able Image Analyser.
Agreement is represented by a Spearman correlation coefficient, followed by P < .05.
P < .05 for Wilcoxon test for significant differences.
P values (<.05) associated with Spearman correlation coefficient indicated that the left C1 SAS vs left condyle may be extrapolated to the general population of A/O surface matches; all other correlation values (those >.05) are confined to this study, with a necessity to further study a larger population of matched surfaces to ascertain the general nature of the findings. Weak correlation = 0.100 to 0.449; moderate correlation = 0.450 to 0.849; strong correlation = >0.850.
Table 2.
Articular surfaces compared by method 2, point counting technique
| Structures Compared | Agreementa Spearman/P | Pb | n |
|---|---|---|---|
| Left C1 SAS vs Left Condyle | .588/.01c | .2 | 18 |
| Right C1 SAS vs Right Condyle | .730/.00 | .5 | 18 |
| Left Condyle vs Right Condyle | .596/.00 | .6 | 18 |
| Left C1 SAS vs Right C1 SAS | .769/.00 | .1 | 18 |
Agreement is represented by a Spearman correlation coefficient, followed by P < .05.
P < .05 for Wilcoxon test for significant differences.
P values associated with Spearman correlation coefficient (<.05) indicated all 4 correlation values were significant, suggesting that the results may be extrapolated to the general population of matched A/O surfaces. Further study with a larger population will be required to substantiate these findings. Weak correlation = 0.100 to 0.449; moderate correlation = 0.450 to 0.849; strong correlation = > 0.850.
The reliability of methods 1 and 2 are shown in Tables 3 and 4. The data represent 3 measurements each of 4 articular surfaces. Repeated t tests revealed no significant differences in areas between the 3 trials for any of the articulations, thus demonstrating repeatability over a course of 72 trials for method 2 and 60 trials for method 1. Although not recorded, method 3 drawing overlaps were also repeated with no statistical differences (P < .05 using a t test for repeated samples).
Table 3.
Method 1 raw surface area data in square millimeters
| Specimen Number | Trials | Left Atlas | Right Atlas | Left Condyle | Right Condyle |
|---|---|---|---|---|---|
| 999 | 1 | 29.5 | 26.67 | 25.67 | – |
| 2 | 29.0 | 26.70 | 30.64 | – | |
| 3 | 26.97 | 27.77 | 29.33 | – | |
| 1035 | 1 | 23.77 | 21.36 | 21.30 | 29.77 |
| 2 | 23.55 | 21.34 | 21.07 | 30.20 | |
| 3 | 26.34 | 22.94 | 21.27 | 29.94 | |
| 1081 | 1 | 22.84 | 27.70 | 24.84 | 25.34 |
| 2 | 22.94 | 27.60 | 25.2 | 26.54 | |
| 3 | 22.74 | 27.34 | 24.27 | 27.04 | |
| 1019 | 1 | 22.64 | 25.00 | 19.34 | 26.57 |
| 2 | 23.17 | 25.67 | 19.00 | 26.20 | |
| 3 | 23.37 | 25.10 | 19.07 | 27.40 | |
| 1046 | 1 | 29.0 | 30.60 | 29.50 | 29.77 |
| 2 | 29.5 | 30.50 | 28.00 | 30.20 | |
| 3 | 30.97 | 30.2 | 30.54 | 29.94 | |
| 1037 | 1 | 24.64 | 28.27 | 32.97 | 28.77 |
| 2 | 24.37 | 28.57 | 33.24 | 28.54 | |
| 3 | 24.34 | 28.53 | 33.21 | 28.40 | |
| Sum | 1 | 459.65 | 481.86 | 468.46 | 424.62 |
| Avg | 2 | 25.54 | 26.77 | 26.03 | 28.31 |
| SD | 3 | 2.86 | 2.79 | 5.07 | 1.67 |
Table 4.
Method 2 raw surface area data in square millimeters
| Specimen Number | Trials | Left Atlas | Right Atlas | Left Condyle | Right Condyle |
|---|---|---|---|---|---|
| 999 | 1 | 37.70 | 32.30 | 35.70 | 34.00 |
| 2 | 34.70 | 33.30 | 35.30 | 33.30 | |
| 3 | 33.30 | 31.30 | 35.00 | 34.30 | |
| 1035 | 1 | 26.70 | 21.30 | 25.30 | 25.00 |
| 2 | 25.30 | 21.30 | 25.30 | 25.00 | |
| 3 | 25.70 | 21.30 | 25.30 | 25.00 | |
| 1081 | 1 | 29.70 | 29.30 | 30.30 | 31.30 |
| 2 | 28.00 | 29.00 | 30.30 | 30.70 | |
| 3 | 29.70 | 31.00 | 29.70 | 30.70 | |
| 1019 | 1 | 24.00 | 27.00 | 23.30 | 26.00 |
| 2 | 24.00 | 27.00 | 23.30 | 26.70 | |
| 3 | 24.30 | 27.70 | 23.30 | 26.00 | |
| 1046 | 1 | 23.00 | 16.70 | 24.30 | 28.30 |
| 2 | 21.30 | 16.30 | 23.70 | 26.70 | |
| 3 | 21.00 | 17.30 | 23.70 | 26.70 | |
| 1037 | 1 | 18.00 | 28.70 | 26.00 | 26.70 |
| 2 | 17.00 | 28.00 | 27.30 | 28.00 | |
| 3 | 17.30 | 28.70 | 27.70 | 27.70 | |
| Sum | 1 | 457.70 | 467.50 | 494.50 | 512.10 |
| Avg | 2 | 25.42 | 25.97 | 27.47 | 28.45 |
| SD | 3 | 5.52 | 5.49 | 4.31 | 3.14 |
Method 1
There were moderate correlations of surface areas between opposing joint surfaces of the left C1 SAS and matching left condyle (r = 0.573, P = .01) (Table 1). There were no other significant surface agreements seen for the matching set or bilateral comparisons (Table 1). In addition, there were no statistically significant differences found between any articular structures compared in method 1 (Tables 1 and 3).
Method 2
Moderate correlations were found between joint surfaces (Table 2) for the left ipsilateral C1 SAS and left condyle (r = 0.588, P = .010) as well as the right ipsilateral C1 SAS and right condyle (r = 0.730, P = .001). In addition, significant agreement between contralateral parameters, left condyle and right condyle (r = 0.596, P = .009) and left SAS and right SAS (r = 0.769, P = .000, Table 2), were evident. There were no significant differences between the surfaces when either ipsilateral or contralateral sides were compared (Tables 2 and 4).
Method 3
All 12 corresponding A/O surfaces studied had at least 1 mm of overlap (transparency outline of the molds from method 2). Table 5 and Fig 1 represent the numerical values in millimeters of the maximum and minimum overlap of each of the 12 A/O joints that were measured. The measurements were taken after a visual determination of best fit following overlay of transparencies of the condylar outline placed over a transparency outline of the corresponding atlas (Fig 2).
Table 5.
Minimum and maximum overlap measurements between articulations (method 3)a
| Specimen Number | Side | Overlap A/O Joint |
|
|---|---|---|---|
| Min Value (mm) | Max Value (mm) | ||
| 999 | Left | 1 | 4 |
| 999 | Right | 1 | 2 |
| 1081 | Left | 1 | 2 |
| 1081 | Right | 2 | 5 |
| 1035 | Left | 2 | 4 |
| 1035 | Right | 1 | 3 |
| 1046 | Left | 1 | 3 |
| 1046 | Right | 2 | 4 |
| 1019 | Left | 1 | 3 |
| 1019 | Right | 3 | 5 |
| 1037 | Left | 1 | 6 |
| 1037 | Right | 1 | 4 |
Shows minimum and maximum difference in millimeters between the condyle and the SAS following best fit overlay. Ten of the 12 measurements had a 3-mm or greater difference, and 12 of 12 had differences of at least 1 mm.
Fig 1.

A graph of maximum and minimum overlap after the occipital condyle transparency is placed over the corresponding atlas and a determination of difference to exactness of fit in millimeters is assessed. A total of 12 paired measurements were completed. The white bars represent the minimum difference measurements, and the dark bars represent the maximum difference to best fit measurement.
Fig 2.
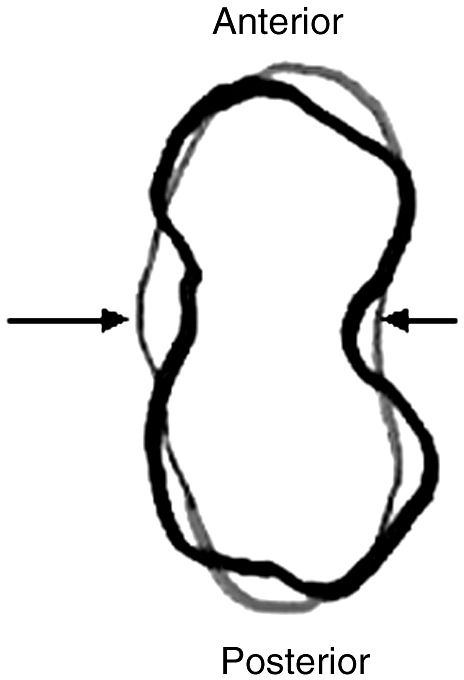
An enlarged illustration of a transparency overlay of the left condyle from cadaver 1046 (black outline) onto the left atlas from cadaver 1046 (red outline), following a determination of best fit. Multiple areas of overlap/under lap are evident. The right arrow points to an area in which there is 1 mm of overlap, and the left arrow is pointing to an area of 3 mm of underlap.
Discussion
There are a number of publications pertaining to upper cervical chiropractic radiographic analysis (“hole in one").13-15 Some chiropractic colleges have adopted aspects of the traditional teachings of BJ Palmer and thus teach radiographic techniques that have roots with the Palmer radiographic analysis. These techniques are currently used to assign direction to various vertebral segments. Other practitioners have modified the Palmer upper cervical analytic techniques; and at least one additional technique (Blair) has added other presumptions relative to symmetry, for example, the presumption of exactness of fit of the atlas and occipital condyle at their margins5,6 These modifications and presumptions require further clarification to ensure that proper alignments are derived from the analysis to ensure the correct vertebral adjustment is delivered to the patient. If the radiographic analysis is not correct, the patients' health and safety could be affected in 2 ways. First, adjustments performed in the wrong direction, as reported by some authors,16-20 may be harmful to the patients and complicate their progress. Second, it is important to avoid errors that result in patients being exposed to radiation without receiving full benefit of improvement of their health condition.21 This lack of clinical improvement leads to more radiographs being taken. One problem is the radiographic analytical systems not accounting for the lack of symmetry. The data from this study and others suggest that the underlying premise of symmetry in radiographic analysis needs to be reexamined.22
Some authors have also challenged the validity of vertebral joint assessment using diagnostic techniques, such as motion palpation, that also rely on symmetry as being normal in the analysis of joint position and motion.23,24 Little attention has been given to the craniovertebral articulations, specifically gross observations of variants of the superior articular facet of the atlas and the occipital condyle.24 However, the reliability of radiograph line drawing analyses of static cervical radiographs used to quantitatively assess alignment relative to skeletal structures has been established.25 Harrison et al (2003)25 found that 48 of 50 measurements have differences between initial and follow-up radiographic analysis of less than 1.5° or 2 mm when Chiropractic Biophysics radiographic procedures are used. This amount of variation may allow analysis of positional changes of radiographic images on the order of those observed to have clinical manifestations.25
In the present study, tracings of moulds from the atlas and matching condyle (method 3) are used to access misalignment. Ten of the 12 (83%) joints measured had overlap >2 mm. A hypothetical model for evaluating these findings and extrapolating them, relative to radiograph line drawing analysis, was completed; and the data from the study were analyzed. The A/O joint overlap in this study falls well beyond normal variation estimates with regard to the amount of error that allows objective analysis of upper cervical radiographs. The prevalence of misalignment (those with overlap >3 mm) is 0.58. Misalignment is defined as those joints with overlap greater than 2 mm. True positives are those misalignments that are greater than 3 mm. True negatives are those misalignments of 2 mm or less. False positives are those misalignments with overlap of 3 mm. False negatives were not detected, so an estimate from the findings of Harrison et al of 48 of 50 with no difference in alignment between initial and follow-up was completed. This estimate was based on the observation that 2 of the 50 fall outside the amount of error that allows objective analysis (2/50). The data from the study were placed into the following categories: 7 true positives, 2 true negatives, 3 false positive, and a false negative rate of 0.04. Three estimates are required to compute positive predictive value (PPV). They are prevalence, sensitivity, and specificity and are noted below with calculated values. Sensitivity was 0.994, specificity was 0.40, and PPV (prevalence × sensitivity/[prevalence][sensitivity] + [1 − prevalence][1 − specificity]) was 0.70. A PPV indicates that of the individuals that were positive for misalignment, there is a 70% probability that those classified as positives are actually positives. Thus, based upon these theories and assumptions, 5 of the 7 positive joints detected using this method may be truly misaligned.
The present study extrapolates clinical misalignment relative to the use of radiographic analysis only. It is important to note that although radiographs provide important information concerning vertebral misalignment, it should not be the sole basis for a clinical decision. Vertebral misalignment is a dynamic process, so a number of other analytic procedures should be used to provide a complete clinical picture.26,27 Furthermore, we must not lose sight that chiropractic vertebral subluxation is a complex of functional and/or structural and/or pathological articular changes that compromise neural integrity.26,27 The chiropractic vertebral subluxation may be present when the combination of neural involvement and vertebral misalignment is found.26-28 In the present study, we assessed only the vertebral misalignment aspect of the A/O joint and did not include assessment of neural involvement.
The fact that Palmer-rooted techniques rely heavily on presumptions of bilateral and ipsilateral symmetry creates a conundrum. Differences in symmetry have been reported to exist in bony structures, such as the atlas and occipital condyles.22,29 Asymmetry, therefore, is not an unusual finding. Panjabi et al9 studied all spinal vertebral levels except the atlanto-occipital joint and concluded that there was not an exact fit between opposing articular surfaces. The present study, in regard to the A/O articulation, is in agreement with that study. Moreover, the existence of bilateral asymmetry, particularly in the upper cervical spine, has been recognized as far back as the 1950s.5,6 The risk is that presuming symmetry or exactness of fit when it does not exist could lead to incorrect radiographic line drawings and hence could result in an incorrect line of adjustment, which may cause more harm than good. That is, such an event could have physical and/or physiological effects on the patient, leading to an adverse affect on patient outcome and overall health.16,20 This view is not universal. Not all doctors of chiropractic concern themselves with determining specific lines of drive before selecting a spinal adjustment.
Limitations to the present study
It is noted that the present study does not directly address the atlanto-occipital anatomical relationship as it exists in vivo. However, the study does provide pertinent information concerning the similarities between corresponding articulating surfaces. In addition, samples taken from structures that are concave (atlas) and convex (condyle) that are superimposed and measured on a flat surface may present minor measurement flaws not detected in this study. To examine this possibility, a best fit analysis was performed on convex/concave surfaces known to match exactly at their edges. The analysis revealed a 1-mm or less exactness of fit for structures double the size and depth of the samples used in this study. It is also important to note that 10 of the 12 A/O joints studied had a maximum difference of exactness of fit of 3 mm or more (Table 5). Consequently, the differences observed in this study exceeded human error when overlaying perfect matches of concave to convex surfaces.
This study demonstrates that differences in the shape of the facet of atlas or occipital condyles relative to their ipsilateral or contralateral surfaces may not routinely result in significant differences between the 2 surface areas. This study reports (Tables 3 and 4) that there were visible differences in the size and shape of opposing vertebral surfaces, although no statistically significant differences were observed. The samples used in the study were kept in submerged and diluted formaldehyde solution (wet samples) to maintain fixation and to prevent dehydration, which includes tissue shrinkage. The factors listed here would make it difficult to take accurate measurements from dry samples, so dry preparations were ruled out. In addition, the fact that the cartilage on the joint surfaces was not cleared and most measurements were completed by the researcher may introduce a selection bias. This study was conducted with a limited budget; thus, low-cost methods were used that were congruent with methods used in previous studies. Based on the findings of this investigation, however, it will be desirable in future studies to use more sophisticated technology.
Conclusions
The present study suggests asymmetry and absence of exactness of fit between articulating surfaces for corresponding articulating joint surfaces of the atlas and condyle. Method 3 appears to be the most relevant because it mimics what is seen at the edges of a given radiograph (ie, anteroposterior open mouth, nasium, and protracto views). In this study, regardless of how well the joint surface outlines were lined up with transparencies, there was at least a 1-mm overlap (or underlap) with a 3- to 6-mm maximum difference in 10 of 12 joints studied. Consequently, any radiographic imaging that analyzes overlap/underlap at the lateral or medial edges of the A/O joint (anteroposterior open mouth, nasium, or Blair protracto view) may require consideration of the impact of these findings in regard to listings determined via those imaging views. Additional studies with more matched cadaver specimens and use of more sophisticated technologies for determining surface areas of the articulations in question are suggested.
References
- 1.Addington E.A. Overview of Blair cervical technique. Prepared for the Council on Chiropractic Practice. Chandler, Arizona. http://www.chiro.org/LINKS/blair.html October 1995 [cited 2005 Aug 5]. Available from:
- 2.Addington E.A.Blair cervical spinographic analysisProceedings from the Conference on Research and Education; 1991 June: Monterey, CA. Foundation for Chiropractic Education and Research1991 [Google Scholar]
- 3.Remier P.A. Modern X-ray practice and spinography. The Palmer School of Chiropractic; Davenport (Iowa): 1957. pp. 312–378. [Google Scholar]
- 4.Addington E.A. Blair Chiropractic Society. The Blair technique [homepage on the Internet]. X-rays explained. http://blairchiropractic.com/xrays_explained.htm June 1991[cited 2007 Jun 18] Available from:
- 5.Blair W.G. Research; for evaluation; for progress. Intl Rev Chiropr. 1968;22(8):8–11. [Google Scholar]
- 6.Blair W.G. Research: for evaluation; for progress. Intl Rev Chiropr. 1968;22(9):8–11. [Google Scholar]
- 7.Hart J.F. Comparison of x-ray and palpation for upper cervical listings. J Vertebral Subluxation Res. 2006 http://www.jvsr.com/abstracts/index.asp?id=275 [cited 2007 Jul 18]. Available from: [Google Scholar]
- 8.Kuhta P. Radiographic analysis: Sherman Chiropractic College class notes. 2007. pp. 38–50. [Spartanburg (SC)] [Google Scholar]
- 9.Panjabi M.H., Oxland T., Takata K., Goel V., Duranceau J., Krag M. Articular facets of the human spine. Spine. 1993;18:1298–1310. doi: 10.1097/00007632-199308000-00009. [DOI] [PubMed] [Google Scholar]
- 10.Mysorekar V.R., Nandedkar A.N. Surface area of the atlanto-occipital articulations. Acta Anat (Basel) 1986;126:223–225. doi: 10.1159/000146221. [DOI] [PubMed] [Google Scholar]
- 11.Konig S.A., Goldammer A., Vitzthum H.E. Anatomical data on the craniocervical junction and their correlation with degenerative changes in 30 cadaveric specimens. J Neurosurg Spine. 2005;3(5):379–385. doi: 10.3171/spi.2005.3.5.0379. [DOI] [PubMed] [Google Scholar]
- 12.Petersson I.F., Jacobsson L.T. Osteoarthritis of the peripheral joint. Best practice and research. Best Pract Res Clin Rheumatol. 2002;16(5):741–760. doi: 10.1053/berh.2002.0266. [DOI] [PubMed] [Google Scholar]
- 13.Palmer B.J. Palmer School of Chiropractic; Davenport (Iowa): 1934. The subluxation specific, the adjustment specific. [Google Scholar]
- 14.Remier P.A. Palmer College of Chiropractic; Davenport (Iowa): 1938. Modern chiropractic spinography. [Google Scholar]
- 15.Remier P.A. X-ray analysis and interpretation. Sci Rev Chiropr. 1965;2(1):29–43. [Google Scholar]
- 16.Elster E.L. Sixty patients with chronic vertigo undergoing upper cervical chiropractic care to correct vertebral subluxation: a retrospective analysis. J Vertebral Subluxation Res. 2006:1–9. [Google Scholar]
- 17.Genther G.C., Friedman H.L., Studley C.F. Improvement in depression following reduction of upper cervical vertebral subluxation using orthospinology technique. J Vertebral Subluxation Res. 2005:1–4. [Google Scholar]
- 18.Elster E.L. Upper cervical chiropractic management of a patient with Parkinson's disease: a case report. J Manipulative Physiol Ther. 2000;23(8):573–577. doi: 10.1067/mmt.2000.109673. [DOI] [PubMed] [Google Scholar]
- 19.Schwartzbauer J., Kolber J., Schwartzbauer M., Hart J.F., Zhang J. Athletic performance and physiological measures in baseball players following upper cervical chiropractic care: a pilot study. J Vertebral Subluxation Res. 1997;1(4):33–39. [Google Scholar]
- 20.Hart J. Manipulation-induced subluxation and associated cardiac arrhythmia. Dig Chiropr Econ. 1991;33(1):68–69. [Google Scholar]
- 21.Radiological Society of North America Inc Radiation exposure in x-ray examinations: safety. RSNA. 2007 http://www.radiologyinfo.org Available from. [Google Scholar]
- 22.Febbo T.A., Morrison R., Valente R. Asymmetry of the occipital condyles: a computer-assisted analysis. J Manipulative Physiol Ther. 1992;15(9):565–569. [PubMed] [Google Scholar]
- 23.Ross J.K., Bereznick D.E., McGill S.M. Atlas-axis facet asymmetry. Implications in manual palpation. Spine. 1999;24(12):1203–1209. doi: 10.1097/00007632-199906150-00006. [DOI] [PubMed] [Google Scholar]
- 24.Gottlieb M.S. Absence of symmetry in superior articular facets on the first cervical vertebra in humans: implications for diagnosis and treatment. J Manipulative Physiol Ther. 1994;17(5):314–320. [PubMed] [Google Scholar]
- 25.Harrison D.E., Harrison D.D., Colloca C.J., Betz J., Janik T.J., Holland B. Repeatability over time of posture, radiograph positioning, and radiograph line drawing: an analysis of 6 control groups. J Manipulative Physiol Ther. 2003;26(2):87–98. doi: 10.1067/mmt.2003.15. [DOI] [PubMed] [Google Scholar]
- 26.Owens E.F. Operational definitions of vertebral subluxation: a case study. Top Clin Chiropr. 2001;8(1):40–48. [Google Scholar]
- 27.Association of Chiropractic Colleges, position paper Number 1. July 1996. Available from: http://www.chiro.org/chimages/chiropage/acc.html/#coll.
- 28.Briggs L., Boone W.R. Effects of a chiropractic adjustment on changes in pupillary diameter: a model for evaluating somatovisceral response. J Manipulative Physiol Ther. 1988;11(3):181–189. [PubMed] [Google Scholar]
- 29.Sutherland J.P., Yaszemski M.J., White A.A. Radiographic appearance of the odontoid lateral mass interspace in the occipitoatlantoaxial complex. Spine. 1995;20:2221–2225. doi: 10.1097/00007632-199510001-00008. [DOI] [PubMed] [Google Scholar]