Abstract
Complexes of cationic liposomes with DNA are promising tools to deliver genetic information into cells for gene therapy and vaccines. Electrostatic interaction is thought to be the major force in lipid–DNA interaction, while lipid-base binding and the stability of cationic lipid–DNA complexes have been the subject of more debate in recent years. The aim of this study was to examine the complexation of calf-thymus DNA with cholesterol (Chol), 1,2-dioleoyl-3-trimethylammonium-propane (DOTAP), dioctadecyldimethylammoniumbromide (DDAB) and dioleoylphosphatidylethanolamine (DOPE), at physiological condition, using constant DNA concentration and various lipid contents. Fourier transform infrared (FTIR), UV-visible, circular dichroism spectroscopic methods and atomic force microscopy were used to analyse lipid-binding site, the binding constant and the effects of lipid interaction on DNA stability and conformation. Structural analysis showed a strong lipid–DNA interaction via major and minor grooves and the backbone phosphate group with overall binding constants of KChol = 1.4 (±0.5) × 104 M−1, KDDAB = 2.4 (±0.80) × 104 M−1, KDOTAP = 3.1 (±0.90) × 104 M−1 and KDOPE = 1.45 (± 0.60) × 104 M−1. The order of stability of lipid–DNA complexation is DOTAP>DDAB>DOPE>Chol. Hydrophobic interactions between lipid aliphatic tails and DNA were observed. Chol and DOPE induced a partial B to A-DNA conformational transition, while a partial B to C-DNA alteration occurred for DDAB and DOTAP at high lipid concentrations. DNA aggregation was observed at high lipid content.
INTRODUCTION
Gene therapy using viral or synthetic vectors is currently one of the most promising strategies for developing cures for many diseases (1). Cationic lipid–DNA complexes have emerged as one of the major non-viral DNA delivery tools (2–5) and have been used to transfect various cell types and deliver cancer vaccines (8–10). The application of improved liposome formulations for delivery in vivo is valuable for gene therapy and would avoid several problems associated with viral delivery. Delivery of nucleic acids using liposomes is promising as a safe and non-immunogenic approach to gene therapy (1). It is well known that complexes of cationic lipids and plasmid DNA can deliver genes to cells both in vitro and in vivo (1,2). Despite the success of this approach, which has reached the stage of extensive human clinical trials, the relationship between the structure of such complexes and their ability to produce appropriate gene expression remains relatively undefined. In fact, the structure of the DNA itself within cationic lipid–DNA is still a matter of controversy (3). Cationic lipid–DNA interaction has been studied by various analytical methods using different DNAs and lipids. Potentiometric titration (4), isothermal titration calorimetry (5,6), IR (7,8), circular dichroism (CD) (9,10) fluorescence (11) and UV-visible spectroscopic methods (12) were used for structural characterization of lipid–DNA complexes. Similarly, theoretical calculations (13), modelling of electrostatic, hydrophobic and hydration forces were applied (14) to analyse the nature of the lipid–DNA interaction. Even though these studies focus on DNA–lipid interaction and structural changes upon cationic lipid complexation (3), the binding site, the stability and conformation of DNA in lipid–DNA complexes need further characterization. What separates our present study from those investigations is determination of the cationic liposome-binding sites, binding constants, hydrophilic and hydrophobic interactions as well as the effects of lipid complexation on DNA conformation and aggregation.
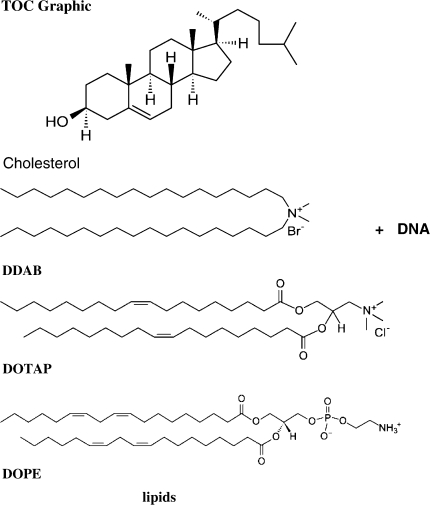
In this article, we report the interaction of calf-thymus DNA with cholesterol (Chol), dioleoylphosphatidylethanolamine (DOPE) (helper) and cationic lipid dioctadecyldimethylammoniumbromide (DDAB) and 1,2-dioleoyl-3-trimethylammonium-propane (DOTAP) (Scheme 1) in aqueous solution at physiological conditions using different lipid/DNA molar ratios and constant DNA concentration. Fourier transform infrared (FTIR), CD, UV-visible spectroscopic methods and atomic force microscopy (AFM) were used to measure the lipid-binding site, the overall binding constant and the DNA secondary structure in the lipid–DNA adducts. Our spectroscopic results provide a major structural analysis of lipid–DNA interaction, which helps elucidating the nature of this biologically important complexation in vitro.
Scheme 1.
Structures of lipids.
MATERIALS AND METHODS
Materials
Highly polymerised type I calf-thymus DNA sodium salt (7% Na content) was purchased from Sigma Chemical Co., and was deproteinated by the addition of CHCl3 and isoamyl alcohol in NaCl solution. In order to check the protein content of DNA solution, the absorbance at 260 and 280 nm was recorded. The A260/A280 ratio was 1.85, showing that the DNA was sufficiently free from protein. Chol, DOTAP, DDAB and DOPE were from Avanti Polar Lipid Inc., and used as supplied. Other chemicals were of reagent grade and used without further purification.
Preparation of stock solution
Sodium–DNA was dissolved to 1% w/w (10 mg/ml) in 10 ml Tris–HCl (pH 7.3) at 5°C for 24 h with occasional stirring to ensure the formation of a homogeneous solution. The final concentration of the stock calf-thymus DNA solution was determined spectrophotometrically at 260 nm by using molar extinction coefficient of 6600 cm−1 M−1 (expressed as molarity of phosphate groups) (15,16). The UV absorbance at 260 nm of a diluted solution (40 μM) of calf-thymus DNA used in our experiments was measured to be 0.25 (path length was 1 cm) and the final concentration of the stock DNA solution was calculated to be 25 mM in DNA phosphate. The average length of the DNA molecules, estimated by gel electrophoresis was 9000 base pairs (molecular weight ∼6 × 10⁶ Da). The appropriate amount of lipid (0.08–0.6 mM) was prepared in ethanol/water solution (50/50%). The lipid solution was then added dropwise to DNA solution to attain desired lipid/DNA(phosphate) molar ratios of 1/80, 1/40, 1/20, 1/10 and 1/4 with a final DNA concentration of 12.5 mM (P) in ethanol/water 25/75% for IR spectroscopic measurements. It is worth noting that ethanol content 25% (final) in the mixture of lipid–DNA solution does not affect the conformation of DNA. Ethanol induces DNA conformational changes (B to A-form) only when the alcohol concentration exceeds 70% (17,18).
FTIR spectroscopy
IR spectra were recorded on a FTIR spectrometer (Impact 420 model), equipped with DTGS (deuterated triglycine sulphate) detector and KBr beam splitter, using AgBr windows. Spectra were collected after 2 h incubation of lipid with DNA solution and measured in triplicate. Interferograms were accumulated over the spectral range 4000 to 400 cm−1 with a nominal resolution of 2 cm−1 and a minimum of 100 scans. The water subtraction was carried out with 0.1 mM NaCl solution used as a reference at pH 7.3 (19). A good water subtraction was achieved as shown by a flat baseline around 2200 cm−1 where the water combination mode is located. This method is a rough estimate, but removes the water content in a satisfactory way. The difference spectra [(DNA solution + lipid) − (DNA solution)] were obtained, using the sharp DNA band at 968 cm−1 as internal reference. This band, which is due to deoxyribose C–C stretching vibration, exhibits no spectral changes (shifting or intensity variation) upon lipid–DNA complexation, and cancelled out upon spectral subtraction. The spectra are smoothed with Savitzky-Golay procedure (19).
The plots of the relative intensity (Ri) of several peaks of DNA in-plane vibrations related to A–T, G–C base pairs and the PO−2 stretching vibrations, such as 1717 (guanine), 1663 (thymine), 1609 (adenine), 1492 (cytosine), 1222 (PO−2 asymmetric) and 1088 cm−1 (PO−2 symmetric) versus lipid concentrations were obtained after peak normalization (against DNA band at 968 cm−1) using:
| 1 |
Where Ii is the intensity of absorption peak for pure DNA and DNA in the complex with i concentration of lipid and I968 is the intensity of the 968 cm−1 peak (internal reference) (20).
CD spectroscopy
Spectra of DNA and liposome–DNA adducts were recorded at pH 7.3 with a Jasco J-720 spectropolarimeter. For measurements in the Far-UV region (200–320 nm), a quartz cell with a path length of 0.01 cm was used. Six scans were accumulated at a scan speed of 50 nm per min, with data being collected at every nanometre from 200 to 320 nm. Sample temperature was maintained at 25°C using a Neslab RTE-111 circulating water bath connected to the water-jacketed quartz cuvette. Spectra were corrected for buffer signal and conversion to the Mol CD (Δɛ) was performed with the Jasco Standard Analysis software. The lipid concentrations used in our experiment were 0.125, 0.25, 0.5 and 1 mM with final DNA content of 2.5 mM.
Absorption spectroscopy
The absorption spectra were recorded on a Perkin Elmer Lambda 40 Spectrophotometer, with a slit of 2 nm and scan speed of 240 nm min−1. Quartz cuvettes of 1 cm were used. The absorbance assessments were performed at pH 7.3 by keeping the concentration of DNA constant (125 μM), while varying the concentration of liposome (5–40 μM).
To calculate the lipid–DNA binding constant, the data are treated according to the following equations:
| 2 |
| 3 |
The values of the binding constants K were obtained from the DNA absorption at 260 nm according to the methods published in the literature (21,22), where the bindings of various ligands to haemoglobin were described. For weak binding affinities, the data were treated using linear reciprocal plots based on the following equation:
| 4 |
Where, A0 is the absorbance of DNA at 260 nm in the absence of ligand, A∞ is the final absorbance of the ligated-DNA and A is the recorded absorbance at different ligand concentrations. The double reciprocal plot of 1/(A – A0) versus 1/Cligand is linear and the binding constant (K) can be estimated from the ratio of the intercept to the slope (21).
Atomic force microscopy
Lipid–DNA complexes at a ratio of 1:1 and final DNA concentration of 0.1 mM were prepared in 5 ml Tris–HCl (pH 7.4) and 5% (v/v) ethanol. The solutions were either used undiluted or diluted further in ultrapure water. For each sample, 30 μl aliquot was adsorbed for 2 min on freshly cleaved muscovite mica. The surface was rinsed thoroughly with 10 ml of ultrapure water and dried with Argon. AFM imaging was performed in acoustic mode at a scanning speed of 1 Hz with an Agilent 5500 (Agilent, Santa Barbara, CA, USA) using high frequency (300 kHz) silicon cantilevers with a tip radius of 2–5 nm (TESP-SS, Veeco, Santa Barbara, CA, USA). Images were treated using the software Gwyddion (http://gwyddion.net/).
RESULTS
FTIR spectra of lipid–DNA adducts
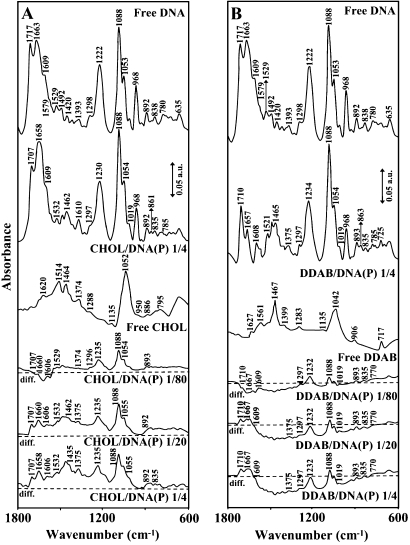
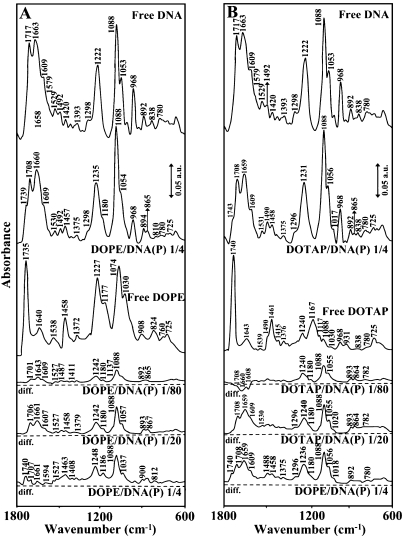
The IR spectral features for lipid–DNA interaction are presented in Figures 1–4. The assignments of DNA vibrational frequencies are given in Table 1.
Figure 1.
FTIR spectra and difference spectra [(DNA solution + lipid solution) − (DNA solution)] in the region of 1800–600 cm−1 for the free calf-thymus DNA and free Chol (A) and DDAB (B) and their complexes in aqueous solution at pH 7.3 with various lipid/DNA(P) ratios (1/80 to 1/4) and constant DNA concentration (12.5 mM).
Figure 2.
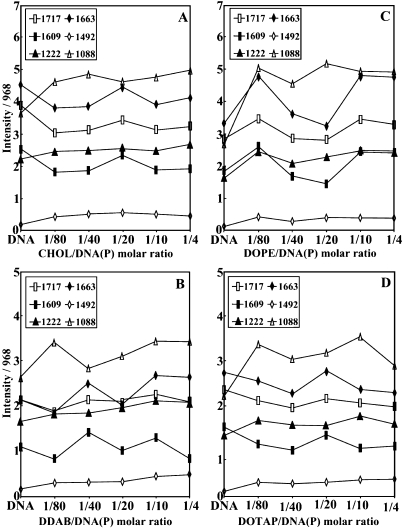
Intensity ratio variations for several DNA in-plane vibrations at 1717 (G), 1663 (T), 1609 (A), 1492 (C and G), 1222 cm−1 (PO2 asymmetric stretch) and 1088 (PO2 symmetric stretch) as a function of lipid concentrations for Chol (A), DDAB (B), DOPE (C) and DOTAP (D).
Figure 3.
FTIR spectra and difference spectra [(DNA solution + lipid solution) − (DNA solution)] in the region of 1800 − 600 cm−1 for the free calf-thymus DNA and free DOPE (A) and DOTAP (B) and their complexes in aqueous solution at pH 7.3 with various lipid/DNA(P) ratios (1/80 to 1/4) and constant DNA concentration (12.5 mM).
Figure 4.
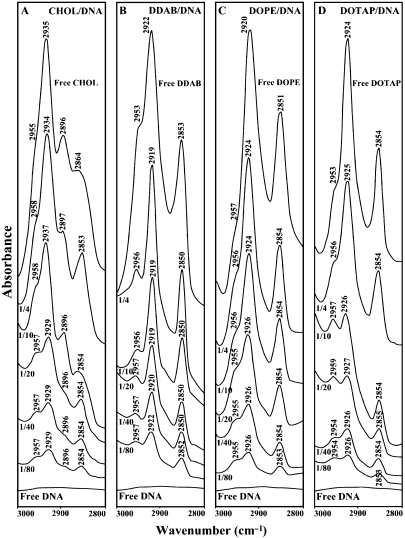
Free lipid CH2 antisymmetric and symmetric stretching vibrations with DNA complexes in the region of 3000–2800 cm−1 for Chol (A), DDAB (B), DOPE (C) and DOTAP (D).
Table 1.
Principal infrared absorption bands, relative intensities and assignments for calf-thymus dna in aqueous solution at pH 7 ± 0.2
| Wavenumber (cm−1) | Intensitya | Assignment (19,20,26) |
|---|---|---|
| 1717 | vs | Guanine (C=O stretching) |
| 1663 | vs | Thymine (C2=O stretching) |
| 1609 | s | Adenine (C7=N stretching) |
| 1579 | sh | Purine stretching (N7) |
| 1529 | w | In-plane vibration of cytosine and guanine |
| 1492 | m | In-plane vibration of cytosine |
| 1222 | vs | Asymmetric PO−2 stretch |
| 1088 | vs | Symmetric PO−2 stretch |
| 1053 | s | C–O deoxyribose stretch |
| 968 | s | C–C deoxyribose stretch |
| 892 | m | Deoxyribose, B-marker |
| 836 | m | Deoxyribose, B-marker |
aRelative intensities: s, strong; sh, shoulder; vs, very strong; m, medium; w, weak.
Lipid–phosphate binding
Strong lipid–PO2 interaction is evident from increase in intensity and shifting of the PO2 asymmetric band at 1222 cm−1 and symmetric band at 1088 cm−1, in the spectra of the lipid–DNA complexes (Figures 1–3). The PO2 band at 1222 cm−1 gained intensity and shifted towards a higher frequencies at 1230 (Chol), 1234 (DDAB), 1235 (DOPE) and 1231 (DOTAP), while the band at 1088 gained intensity with no shifting (Figures 1–3). The positive features at 1248–1232 (asymmetric) and 1088 cm−1 (symmetric) in the difference spectra of lipid–DNA complexes are due to increase in intensity of the phosphate vibrational frequencies upon lipid interaction (Figures 1–3 diffs). Further evidence regarding lipid–PO2 interaction is also coming from the intensity ratio variations of symmetric and asymmetric PO2 bands at 1088/1222 (19). The ratio of νs/νas was changed from 1.70 (free DNA) to 2 (Chol–DNA), 2.1 (DDAB–DNA), 2 (DOPE–DNA) and 1.9 (DOTAP), upon lipid complexation (Figure 2). It should be noted that lipid–phosphate binding start at very low concentration and reaches a plateau where lipid-base binding begins. This is evident by gradual increase in intensity of the phosphate bands at 1222 and 1088 cm−1 at low lipid contents and exhibit less intensity variations at higher lipid concentrations, where lipid-base binding occurs (Figure 2).
Lipid-base binding
Evidence for lipid-base binding comes from spectral changes observed for both free DNA and free lipid upon complexation. At low lipid concentration r = 1/80, reduction of intensity for the bands at 1717 (guanine), 1663 (thymine) and 1609 cm−1 (23–26) (adenine) were observed except for DOPE–DNA complexes, where minor increase in intensity of these bands was observed, (Figure 2). The reduction of intensity of these vibrations was characterized by the presence of several negative features at 1710–1707 (guanine), 1667–1660 (thymine) and 1609–1606 cm−1 (adenine) in the difference spectra of Chol–, DDAB–, DOTAP–DNA complexes (Figures 1 and 3 diff., r = 1/80).The observed spectral changes are due to no major lipid–DNA interaction for Chol. DDAB and DOTAP, with some degree of DOPE–DNA complexation at low lipid concentration (positive features at 1701, 1643 and 1609 cm−1 for DOPE–DNA). However, at low lipid content r = 1/80, major increase in intensity of the PO2 bands at 1222 and 1088 was observed (Figure 2) due to lipid–phosphate interaction (discussed above). At higher lipid concentrations, the guanine band at 1717 cm−1 gained intensity and shifted to 1710–1707 cm−1, thymine band at 1663 cm−1 gained intensity and shifted to 1660–1657 cm−1 and adenine band at 1609 gained intensity and appeared at 1608–1606 cm−1 upon lipid interaction (Figures 1–3, complexes r = 1/4). The increase in intensity of these vibrations is evident by major positive features observed at 1710–1707 (guanine), 1667–1658 (thymine) and 1609–1606 cm−1 (adenine) in the difference spectra of lipid–DNA complexes (Figures 1 and 3, diffs r = 1/20 and r = 1/4). The shifting and intensity increases observed for the guanine, thymine and adenine vibrations are due to major lipid-base bindings via guanine and adenine N7 atoms and thymine O2 in the major and minor grooves of DNA duplex. However, at high lipid concentration (r = 1/4), the decrease of intensity observed for most of DNA vibrations (Figure 2) are due to DNA aggregation and condensation, which will be discussed in CD spectra further on.
Hydrophobic interactions
A possible impact of DNA complexation on lipid antisymmetric and symmetric CH2 stretching vibration in the region of 3000–2800 cm−1 was investigated by IR spectroscopy. Free Chol CH2 bands at 2955, 2935, 2896 and 2864 cm−1 shifted to 2958, 2934, 2897 and 2853 cm−1 upon DNA complexation (Figure 4A, r = 1/4); free DDAB at 2953, 2922 and 2853 cm−1 shifted to 2956, 2919 and 2850 cm−1 (Figure 4B, r = 1/4); free DOPE at 2957, 2920 and 2851 cm−1 shifted to 2956, 2924 and 2854 cm−1 (Figure 4C, r = 1/4) and free DOTAP at 2953, 2924 and 2854 cm−1 shifted to 2956, 2925 and 2854 cm−1 (Figure 4D, r = 1/4), in the lipid–DNA complexes. The shifting of lipid antisymmetric and symmetric CH2 stretching vibrations suggest the presence of hydrophobic interactions via lipid aliphatic tails and hydrophobic region in DNA. On the other hand, evidence for hydrophilic interaction can be seen from shifting of the lipid C=O stretching vibrations at 1739 (free DOPE) to 1735 cm−1 (DOPE–DNA) and at 1743 (free DOTAP) to 1740 cm−1 (DOTAP–DNA) upon lipid–DNA complexation (Figure 3).
CD spectra and DNA conformation
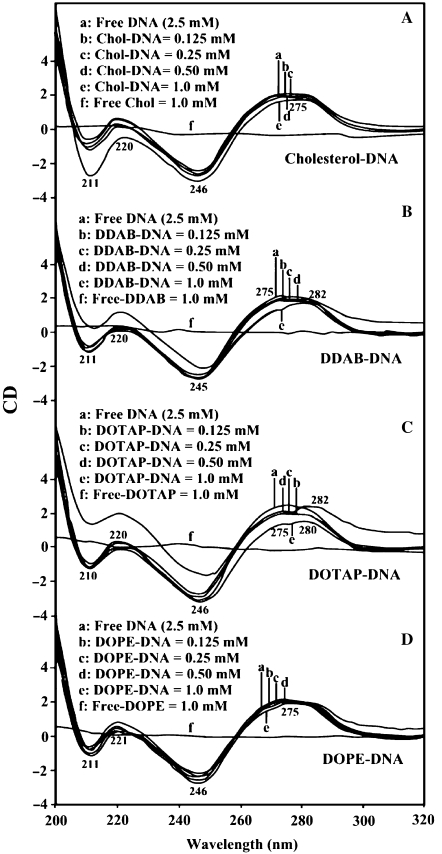
The CD spectra of the free calf-thymus DNA and its complexes with different lipid concentrations are shown in Figure 5. The CD of the free DNA composed of four major peaks at 211 (negative), 220 (positive), 246 (negative) and 275 nm (positive) (Figure 5). This is consistent with CD spectra of double helical DNA in B conformation (17, 27–29). At low lipid, concentration (0.1 and 0.25 mM), no major shifting of CD bands were observed (Figure 2). However, as lipid concentration increased (0.5 and 1 mM), major increase in molar ellipticity of the band at 211 nm and the positivity of the band at 246 was reduced, while the intensity of the band at 275 decreased at high lipid concentration (Figure 5). No major shifting was observed for the band at 275 nm in the spectra of Chol–DNA and DOPE–DNA complexes (Figure 5A and D), while it partially shifted to 282 nm upon DDAB and DOTAP upon DNA complex formation (Figure 5B and C). A partial shifting of the band at 275 nm to 282 nm with major increase in negativity of the band at 211 and 246 nm are due to a partial B to C-DNA conformational transition for DDAB–DNA and DOTAP–DNA complexes (Figure 5B and C). Similar CD spectral changes were observed for DDAB–DNA complexes, where B to C-DNA transition was observed (12). Major support for a partial C-DNA formation also comes from our IR spectroscopic results for DDAB upon DNA binding. The B-DNA marker bands at 1717 (G), 1222 (PO2), 838 cm−1 (phosphodiester mode) in free DNA were observed at 1710, 1234 and 835 cm−1 (DDAB–DNA) and at 1708, 1231 and 838 cm−1 (DOTAP–DNA) in the spectra of lipid–DNA complexes (Figure 1B and Figure 2B, lipid–DNA complexes r = 1/4). The observed spectral shifting for B-DNA marker bands are due to a partial-B to C-DNA transition consistent with our CD spectroscopic results (Figures 1, 2 and 5). Similar IR spectral changes were observed for lipid–DNA complexes, where B to C-DNA alteration was observed (8,30,31). Similarly, a partial B to A-DNA conformational changes were observed for Chol–DNA and DOPE–DNA complexes. The shift of B-DNA markers bands 1717–1707, 1222–1230 and 838–835 cm−1 are indicative of a partial B to A-DNA formation in the spectra of Chol–DNA and DOPE–DNA complexes (Figures 1A and 3A). However, the emergence of a new band at about 865–861 cm−1 in the spectra of the lipid–DNA complexes is characteristic for A-DNA formation (25,26) upon lipid interaction (Figures 1 and 3, complexes r = 1/4). This may indicate that a partial transition of B-DNA to C-DNA or A-DNA can be in co-existence (30,31). It is worth mentioning that the reduction of intensity of CD band at 275 nm observed can be due to DNA aggregation at high lipid contents (Figure 5).
Figure 5.
CD spectra of calf-thymus DNA in Tris–HCl (pH ∼7) at 25°C (2.5 mM) and Chol: (A) and DDAB (B), DOPE (C) and DOTAP (D) with 125, 250, 500 and 1 μM lipid concentrations.
Stability of lipid–DNA complexes
The lipid–DNA binding constant was determined as described in Materials and methods section (UV-visible spectroscopy). As can be observed, increasing lipid concentration resulted into an increase in UV light absorption. This is consistent with reduction of base stacking interaction due to lipid complexation (Figure 6A–D).
Figure 6.
UV-visible results of calf-thymus DNA and its Chol (A), DDAB (B), DOPE (C) and DOTAP (D) complexes: spectra of (a) free DNA (125 μM); (b) free lipid (40 μM); (1–8) lipid–DNA complexes 1 (5 μM), 2 (10 μM), 3 (15 μM), 4 (20 μM), 5 (25 μM), 6 (30 μM), 7 (35 μM) and 8 (40 μM). Plot of 1/(A – A0) versus (1/drug concentration) for lipid and calf-thymus DNA complexes, where A0 is the initial absorbance of DNA (260 nm) and A is the recorded absorbance (260 nm) at different lipid concentrations (5–40 μM) with constant DNA concentration of 125 μM at pH 7.4 for Chol (A′), DDAB (B′), DOPE (C′) and DOTAP(D′).
The double reciprocal plot of 1/(A − A0) versus 1/(lipid concentration) is linear and the binding constant (K) can be estimated from the ratio of the intercept to the slope (Figure 6A′, 6B, 6C′ and 6D′). A0 is the initial absorbance of the free DNA at 260 nm and A is the recorded absorbance of complexes at different lipid concentrations. The overall binding constant for lipid–DNA complexes is estimated to be KChol = 1.4 (±0.5) × 104 M−1, KDDAB = 2.4 (±0.80) × 104 M−1, KDOTAP = 3.1 (±0.90) × 104 M−1 and KDOPE = 1.45 (±0.60) × 104 M−1 with the order of stability of lipid–DNA complexes DOTAP> DDAB >DOPE>Chol (Figure 6) The moderate binding constants estimated are mainly due to the lipid-base bindng and not related to the lipid–PO2 interaction, which is largely ionic and can be dissociated easily in aqueous solution.
Ultrastructure of lipid–DNA complexes
AFM imaging of the different lipid–DNA complexes did not reveal any presence of free DNA molecules. Large complexes were observed for DOTAP and DOPE (Figure 7A and B). We did not observe large complexes for Chol and DDAB. Instead, we imaged a variety of lipid structures ranging from rafts of different shapes, granules and filaments (Figure 7C and D). Some of these may in fact be DNA molecules coated with lipids (Figure 7C, arrowheads). It is fair to say that only the DOTAP/DNA mixture yielded a significant population of ‘fried egg’ looking complexes with an average height of 3.3 ± 0.5 nm (n = 85) adsorbed to mica (Figure 7A). The core of the complex, that should contained the DNA chains, had an average volume of 80 000 nm3 (n = 105). In contrast, very few DOPE/DNA complexes were observed on mica but their height was in the 20 nm range and their shape was irregular (Figure 7B). As far as we can see large DDAB/DNA and Chol/DNA complexes either do not exist in solution or did not attach well to the mica and got washed away. Another possibility is that a thin layer of lipid and DNA coats the mica surface (see background in Figure 7C and D).
Figure 7.
AC mode AFM images of dried lipid/DNA complexes (A), DOTAP (B), DOPE (C), Chol and (D), DDAB. Filamentous structures were observed in the case of Chol/DNA complexes (arrowheads).
DISCUSSION
Cationic lipid–DNA binding is of great importance for basic science and applications in biotechnology. However, the structure and stability of the lipid–DNA complexes are not well understood. Several models have been developed to describe the nature of lipid–DNA complexation (3–5). These models include electrostatic interaction between lipid head group and DNA backbone phosphate by displacing the sodium cation, base binding via lipid polar group and the bases donor atoms and finally, cooperative hydrophobic interaction between aliphatic tails, which can bring several DNA molecules together. Cationic lipids are widely used to transfect DNA in the cell for gene therapy applications. However, the process of gene delivery is poorly understood and much work is needed to clarify the nature of DNA transfection across the membrane (1,2). More than 100 cationic lipids have been produced so far and most are for in vitro use with few used in vivo (1). Many physical and biological studies of cationic lipid–DNA formulations have been reported in the past with the aim to improve our understanding of the lipofection process and its mechanisms. Despite these extensive research, little is known about structural changes of DNA upon lipid complexation. The cationic lipid–DNA binding is the first step in gene delivery and DNA condensation, which requires further investigations.
Based on IR spectroscopic studies, cationic lipid bind DNA duplex via backbone phosphate group and guanine bases inducing a mixture of B to C and B to A-DNA conformational changes (7,8,12,30,31). However, CD spectroscopic data showed a complete B to C-DNA transition induced by DDAB (12). Similarly, CD spectroscopic method and transmission electron microscopy were used to characterize DNA ordering in cationic lipoplexes in which large heterogeneity in size and structure of lipoplexes was observed with DNA aggregation (32). Isothermal titration calorimetry was used to analyse lipid–DNA binding and DNA condensation (5). In this study, the stability of lipid–DNA complexation and the hydrophobic interaction with lipid aliphatic tails leading to DNA condensation were reported (5). Fluorescence spectroscopy was also used to obtain high resolution details about cationic lipid–DNA association, using distances between DNA bound donor fluorophore and acceptor group in the polar regions of lipid bilayer (11).
Our FTIR spectroscopic results clearly showed that at low lipid concentration PO2 binding is predominant, while at higher lipid content lipid binding to guanine N7, adenine N7 and thymine O2 occurred in the major and minor grooves of DNA duplex. Evidence for lipid–phosphate binding comes from major shifting and intenity variations of the PO2 bands at 1222 and 1088 cm−1, while base binding was evident from the shifting and intensity changes of the guanine band at 1717, thymine band at 1663 and adenine band at 1609 cm−1. These IR spectroscopic results located clearly the binding sites of lipid on DNA duplex. Our IR data also showed a partial B to C and B to A-DNA conformational transition, using DNA marker bands for B, A and C-DNA conformations. CD spectroscopic data also supported a partial B to C-DNA transition consistent with infrared results presented here. Both CD and IR data showed evidence for DNA aggregation and condensation. In addition, hydrophobic and hydrophilic interactions are well demonstrated via our infrared dada. Further evidence for lipid–DNA interaction also comes from AFM images in which the association of cationic lipid–DNA with DNA condensation are observed. In the case of the DOTAP/DNA complexes, we can propose a simple structural model based on the AFM images (Figure 7A) where a dense DNA core is surrounded by a more deformable lipid shell as already observed for DNA/DOPE DNA lipoplexes imaged by cryo-electron microscopy (10). Stability of lipid–DNA complexes showed more stable DNA adducts formed with cationic lipids than neutral lipids with the order of stability DOTAP> DDAB>DOPE>Chol, indicating the stabilization of lipid–DNA complexation by charge neutralization. In summary, our spectroscopic results in combination with AFM images provide major structural information regarding cationic lipid–DNA formulation, which is important in gene delivery and DNA transfection.
FUNDING
Natural Sciences and Engineering Research Council of Canada (NSERC). Funding for open access charge has been waived by Oxford University Press.
Conflict of interest statement. None declared.
REFERENCES
- 1.Templeton NS. Gene Therapy: Therapeutic Mechanisms and Strategies. 2nd edn. New York: Dekker; 2004. [Google Scholar]
- 2.Pitard B, Aguerre O, Airivu M, Lachanges AM, Boukhnikachvili T, Byk G, Dubertret C, Scherman D, Mayaux JF, Crouzet J. Virus-sized self-assembling lamellar complexes between plasmid DNA and cationic micelles promote gene transfer. Proc. Natl Acad. Sci. USA. 1997;94:14412–14417. doi: 10.1073/pnas.94.26.14412. [DOI] [PMC free article] [PubMed] [Google Scholar]
- 3.Middaugh CR, Ramsey JD. Analysis of cationic-lipid-plasmid-DNA complexes. Anal. Chem. 2007;79:7240–7248. doi: 10.1021/ac0719711. [DOI] [PubMed] [Google Scholar]
- 4.Melinkov M, Sergeyev VS, Yoshikawa K. Transition of double-stranded DNA chains between random coil and compact globule states induced by cooperative binding of cationic surfactant. J. Am. Chem. Soc. 1995;117:9951–9956. [Google Scholar]
- 5.Matulis D, Rouzina I, Bloomfield VA. Thermodynamics of cationic-lipid binding to DNA and DNA condensation::Roles of electrostatic and hydrophobicity. J. Am. Chem. Soc. 2002;124:7331–7342. doi: 10.1021/ja0124055. [DOI] [PubMed] [Google Scholar]
- 6.Tarahovsky YS, Rakhmanova VA, Epand RM, MacDonald RC. High temperature stabilization of DNA in complexes with cationic lipids. Biophys. J. 2002;82:264–273. doi: 10.1016/S0006-3495(02)75392-7. [DOI] [PMC free article] [PubMed] [Google Scholar]
- 7.Choosakookriang S, Wiethoff CM, Anchordoquy TJ, Koe GS, Smith JG, Middaugh CR. Infrared spectroscopic characterization of the interaction of cationic lipids with plasmid DNA. J. Biol. Chem. 2001;276:8037–8043. doi: 10.1074/jbc.M010592200. [DOI] [PubMed] [Google Scholar]
- 8.Choosakookriang S, Wiethoff CM, Koe GS, Koe JG, Anchordoquy TJ, Middaugh CR. An infrared spectroscopic study of the effect of hydration on cationic lipid/DNA complexes. J. Pharm. Sci. 2003;92:115–130. doi: 10.1002/jps.10279. [DOI] [PubMed] [Google Scholar]
- 9.Braun CS, Jas GS, Choosakoonkriang S, Koe GS, Smith JG, Middaugh CR. The structure of DNA within cationic/DNA complexes. Biophys. J. 2003;84:1114–1123. doi: 10.1016/S0006-3495(03)74927-3. [DOI] [PMC free article] [PubMed] [Google Scholar]
- 10.Simberg D, Danino D, Talmon Y, Minsky A, Ferrari ME, Wheeler CJ, Barenholz Y. Phase behaviour, DNA ordering, and size instability of cationic lipoplexes. J. Biol. Chem. 2001;276:47453–47459. doi: 10.1074/jbc.M105588200. [DOI] [PubMed] [Google Scholar]
- 11.Weithoff CM, Gill ML, Koe GS, Koe JG, Middaugh CR. The structural organization of cationic lipid-DNA complexes. J. Biol. Chem. 2002;277:44980–44987. doi: 10.1074/jbc.M207758200. [DOI] [PubMed] [Google Scholar]
- 12.Zhang Z, Huang W, Tang J, Wang E, Dong S. Conformational transition of DNA induced by cationic lipid vesicle in acidic solution:spectroscopy investigation. Biophys. Chem. 2002;97:7–16. doi: 10.1016/s0301-4622(02)00006-6. [DOI] [PubMed] [Google Scholar]
- 13.May S, Harries D, Ben-Shaul A. The phase behavior of cationic lipid-DNA complexes. Biophys. J. 2000;78:1681–1697. doi: 10.1016/S0006-3495(00)76720-8. [DOI] [PMC free article] [PubMed] [Google Scholar]
- 14.Meidan VM, Cohen JS, Amariglio N, Hirsch-Lerner D, Barenholz Y. Interaction of oligonucleotides with cationic lipids:the relationship between electrostatics, hydration and state of aggregation. Biochim. Biophys. Acta. 2000;1464:251–261. doi: 10.1016/s0005-2736(00)00151-6. [DOI] [PubMed] [Google Scholar]
- 15.Reichmann ME, Rice SA, Thomas CA, Doty P. A further examination of the molecular weight and size of desoxypentose nucleic acid. J. Am. Chem. Soc. 1954;76:3047–3053. [Google Scholar]
- 16.Vijayalakshmi R, Kanthimathi M, Subramanian V. DNA cleavage by a chromium (III) complex. Biochem. Biophys. Res. Commun. 2000;271:731–734. doi: 10.1006/bbrc.2000.2707. [DOI] [PubMed] [Google Scholar]
- 17.Nejedly K, Chladkova J, Vorlickova M, Hrabcova I, Kypr J. Mapping the B-A conformational transition along plasmid DNA. Nucleic Acids Res. 2005;33(e5):1–8. doi: 10.1093/nar/gni008. [DOI] [PMC free article] [PubMed] [Google Scholar]
- 18.Potaman VN, Bannikov YA, Shlyachtenko LS. Sedimentation of DNA in ethanol-water solution within the interval of B to A transition. Nucleic Acids Res. 1980;8:635–642. doi: 10.1093/nar/8.3.635. [DOI] [PMC free article] [PubMed] [Google Scholar]
- 19.Alex S, Dupuis P. FTIR and Raman investigation of cadmium binding by DNA. Inorg. Chim. Acta. 1989;157:271–281. [Google Scholar]
- 20.Ahmed Ouameur A, Tajmir-Riahi HA. Structural analysis of DNA interactions with biogenic polyamines and cobalt (III) hexamine studied by Fourier transform infrared and capillary electrophoresis. J. Biol. Chem. 2004;279:42041–42054. doi: 10.1074/jbc.M406053200. [DOI] [PubMed] [Google Scholar]
- 21.Stephanos JJ. Drug-protein interactions:two-site binding of heterocylclic ligands to a monomeric hemogolobin. J. Inorg. Biochem. 1996;62:155–169. doi: 10.1016/0162-0134(95)00144-1. [DOI] [PubMed] [Google Scholar]
- 22.Stephanos JJ, Farina SA, Addison AW. Iron ligand recognition by monomeric hemoglobins. Biochim. Biophy. Acta. 1996;1295:209–221. doi: 10.1016/0167-4838(96)00041-6. [DOI] [PubMed] [Google Scholar]
- 23.Andrushchenko VV, Leonenko Z, van de Sande H, Wieser H. Vibrational CD (VCD) and atomic force microscopy (AMF) study of DNA interactions with Cr3+: VCD and AFM evidence of DNA condensation. Biopolymers. 2002;61:243–260. doi: 10.1002/bip.10159. [DOI] [PubMed] [Google Scholar]
- 24.Dovbeshko GI, Chegel VI, Gridina NY, Shishov OP, Tryndiak YM, Todor VP, Solyanik GI. Surface enhanced IR absorption of nucleic acids from tumor cells: FTIR reflectance study. Biospectroscopy. 2002;67:470–486. doi: 10.1002/bip.10165. [DOI] [PubMed] [Google Scholar]
- 25.Taillandier E, Liquier J. Infrared spectroscopy of DNA. Methods Enzymol. 1992;211:307–335. doi: 10.1016/0076-6879(92)11018-e. [DOI] [PubMed] [Google Scholar]
- 26.Loprete DM, Hartman KA. Conditions for the stability of the B,C, and Z structural forms of poly(dG-dC) in the presence of lithium, potassium, magnesium, calcium and zinc cations. Biochemistry. 1993;32:4077–4082. doi: 10.1021/bi00066a032. [DOI] [PubMed] [Google Scholar]
- 27.Vorlickova M. Conformational transitions of alternating purin-pyrimidine DNAs in the perchlorate ethanol solutions. Biophys. J. 1995;69:2033–2043. doi: 10.1016/S0006-3495(95)80073-1. [DOI] [PMC free article] [PubMed] [Google Scholar]
- 28.Kypr J, Vorlickova M. Circular dichroism spectroscopy reveals invariant conformation of guanine runs in DNA. Biopolymers. 2002;67:275–277. doi: 10.1002/bip.10112. [DOI] [PubMed] [Google Scholar]
- 29.Kankia BI, Bukin V, Bloomfiled VA. Hexamine cobalt(III)- induced condensation of calf-thymus DNA: circular dichroism and hydration measurements. Nucleic Acids Res. 2001;29:2795–2801. doi: 10.1093/nar/29.13.2795. [DOI] [PMC free article] [PubMed] [Google Scholar]
- 30.Pohle W, Selle C, Gauger DR, Zantl R, Artzner F, Radler J. FTIR spectroscopic characterization of a cationic lipid-DANN complex and its components. Phys. Chem. Chem. Phys. 2000;2:4642–4650. [Google Scholar]
- 31.Zuidam NJ, Barenholz Y, Minsky A. Chiral DANN packaging in DANN-cationic liposome assemblies. FEBS Lett. 1999;457:419–422. doi: 10.1016/s0014-5793(99)01053-4. [DOI] [PubMed] [Google Scholar]
- 32.Simberg D, Hirsch-Lerner D, Nissim R, Barenholz Y. Comparison of different commercially available cationic lipid-based transfection kits. J. Liposome Res. 2000;10:1–13. [Google Scholar]


