


Abstract
To represent the sequence specificity of transcription factors, the position weight matrix (PWM) is widely used. In most cases, each element is defined as a log likelihood ratio of a base appearing at a certain position, which is estimated from a finite number of known binding sites. To avoid bias due to this small sample size, a certain numeric value, called a pseudocount, is usually allocated for each position, and its fraction according to the background base composition is added to each element. So far, there has been no consensus on the optimal pseudocount value. In this study, we simulated the sampling process by artificially generating binding sites based on observed nucleotide frequencies in a public PWM database, and then the generated matrix with an added pseudocount value was compared to the original frequency matrix using various measures. Although the results were somewhat different between measures, in many cases, we could find an optimal pseudocount value for each matrix. These optimal values are independent of the sample size and are clearly correlated with the entropy of the original matrices, meaning that larger pseudocount vales are preferable for less conserved binding sites. As a simple representative, we suggest the value of 0.8 for practical uses.
INTRODUCTION
Transcription factors regulate gene expression by binding to cis-regulatory elements in DNA. These binding sites typically exhibit characteristic sequence patterns, called ‘motifs’. Experimental discovery of binding sites, however, remains non-trivial. So, although not all motifs are known and motif models are immature, motif matching is widely used to predict binding sites in DNA sequences.
The position weight matrix (PWM) is a common way of representing a motif (1). A PWM has a numeric score for each of the four nucleotide types (rows) at each position in the motif (columns). It can be scanned across a DNA sequence to predict binding sites, as follows. If the PWM has width w, each w-long window of DNA (w-mer) receives a score obtained by summing the scores of the nucleotides at each position. If the w-mer score exceeds some threshold, it is predicted as a binding site.
A PWM is usually created from a position frequency matrix (PFM) via a position probability matrix (PPM). The PFM is constructed from a sample of binding sites, by counting the number of nucleotides of each type (row) at each position (column). The PPM is just a probabilistically normalized form of the PFM, so that each column sums to 1. Finally, the PWM is obtained by logarithmic transformation of the PPM divided by the nucleotides’ background probabilities. Thus, PWM scores are log likelihood ratios. Motif matrices are often visualized as sequence logos (e.g. Figure 1A) (2).
Figure 1.

Pseudocount evaluations for JASPAR matrix ‘MA0001’ with a sample size of 30. (A) Sequence Logo for MA0001. (B) Normalized values of the matrix based comparison methods: ED = Euclidean Distance; COS = Cosine distance; TVD = Total Variation Distance. Each line represents the average of 100 sampling replicates. Error bars show standard deviations of replicates. The comparison values are normalized to the range 0–1. (C) Normalized values of the sequence-based comparison methods: SRC = Spearman's Rank Correlation.
Starting from a small sample of binding sites, we will often get zeros in the PFM, leading to zeros in the PPM and negative infinities in the PWM: this is frequently regarded as undesirable (3). The reasoning is that nucleotides that can occur in the motif will often be absent from a small sample by chance, and assigning them a probability of zero is too harsh. It is important to distinguish this motivation from the merely technical issue that it can be troublesome to deal with negative infinity using computers. In any case, it is common practice to add so-called pseudocounts to the PFM, in order to avoid zero probabilities. Pseudocounts can also be motivated by a Bayesian approach: if we assume a Dirichlet prior distribution for nucleotide frequencies, then the posterior mean estimator is equivalent to adding pseudocounts to the observed counts (3).
In spite of the ubiquity of pseudocounts, there is no standard way of choosing them. Many types of pseudocounts are used, 0.01 (4), 1 (5), 1.5 (6), 2 (7), 4 (8) and the square root of the number of binding sites in the sample (9). (In this article, when we speak of a pseudocount of, e.g. 1.5, we mean that 1.5/4 is added to each of the four counts in a column.) Frith et al. chose pseudocounts by fitting a Dirichlet prior to motifs in the TRANSFAC database (6). However, the actual effect of changing pseudocount values has not been studied systematically: detailed evaluations have been made only for protein motifs (10–12). Therefore, more practical analysis is required for DNA motifs.
Here, we evaluate pseudocount choices using known transcription factor binding sites. The main approach in this study is comparison between an original PPM, which we regard as representing the real sequence specificity of each transcription factor, and a sampled PPM with pseudocounts. The sampled motif matrix is created by stochastic generation from the original PPM. The results show how different pseudocount choices affect the similarity of the original and sampled PPMs. Our results provide guidance on choosing pseudocounts for motif matching.
MATERIALS AND METHODS
JASPAR dataset
We obtained PFMs from the JASPAR database (13). JASPAR provides non-redundant experimentally defined transcription factor binding site motifs for multicellular eukaryotes. JASPAR CORE 2008 has 138 motifs, and provides the original sample of binding sites for 124 of these. We removed matrices that have no binding sites. Additionally, the samples ‘MA0030.sites’ and ‘MA0031.sites’ are identical. Therefore we removed these two. Finally we obtained 122 PFMs.
Sampled PFM from original PFM
To generate sequences from a JASPAR motif, we made a PPM from the PFM using the formula: pa,i = ca,i/m. pa,i is the probability of nucleotide a in position i; ca,i is the observed count of nucleotide a in position i; and m is the number of sequences. Using these probabilities, we generated sequences randomly as virtual transcription factor binding sites. In this study, we generated sets of 10, 20, 30, 40 and 50 sequences.
Pseudocount addition
For each sampled PFM, we made a sampled PPM by adding pseudocounts:
B is the pseudocount; c’a,i is an element of the sampled PFM; p’a,i is an element of the sampled PPM. We tried exponentially stepped pseudocounts between 0.01 and 10.0 in this study. This range includes most pseudocounts used previously, such as the one derived by Dirichlet fitting (6). The comparison of original PPMs to sampled PPMs indicates which pseudocount is optimal. We tried seven types of comparison function in this study: see below. To obtain more accurate results, we performed 100 replicates for each combination of motif, comparison method, pseudocount and number of generated sequences.
Comparison procedures
For comparing original PPMs and sampled PPMs, we used seven methods, in two categories. One category is matrix-based comparison: comparison of corresponding elements of matrices. The other category is sequence-based comparison, which involves enumeration of all possible w-mers. The probability s that a PPM generates a w-mer is
The probabilities of generating each w-mer from both the original and generated PPMs were used in the comparison function. Thus, matrix-based comparison tests how accurately the original matrix is recovered, whereas sequence-based comparison tests how accurately the matrix's function is recovered.
Enumeration of all w-mers for large motifs requires prohibitive calculation time. Therefore we removed motif positions with higher entropy. The upper limit for motif length is 10. If the original motif was longer than 10, we used only the 10 consecutive positions with minimum entropy. The formula for entropy h is
52 motifs were trimmed in our dataset, for sequence-based comparisons. Omitting high-entropy positions introduces a bias (for sequence-based comparisons only), but the alternative—omitting large motifs—may also introduce a bias, so there is no ideal solution.
Comparison functions
Euclidean distance (ED) was used to compare motifs. The formula for matrix-based comparison is
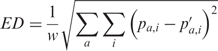 |
The formula for sequence-based comparison is
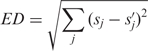 |
sj is the generation probability of sequence j from the original PPM; s’j is generation probability of the same sequence from the sampled PPM.
Cosine distance (COS) was also used to compare motifs. The formula for matrix-based comparison is
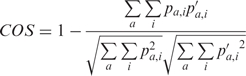 |
The formula for sequence-based comparison is
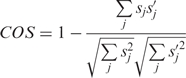 |
Total variation distance (TVD) is another comparison function for probabilities. For matrix-based comparison, we averaged the TVD for each column:
The formula for sequence-based comparison is
Finally, Spearman's Rank Correlation (SRC) was also used for sequence-based comparison of motifs. Thus, the probabilities of each w-mer were converted to ranks. We calculated SRC using R (a free software environment for statistical computing and graphics). In many cases, the original PPMs contain several zero elements, creating many tied ranks corresponding to zero sequence probabilities. In order to break some of these ties, we added a tiny pseudocount of 1.0 × 10⁻¹⁰ to the original PFM. This causes w-mers with one ‘zero’ nucleotide to rank higher than w-mers with two ‘zero’ nucleotides, and gives more sensible results in practice (not shown). The correlation value calculated by R was transformed to 1 – correlation.
We tried 61 pseudocounts for ED, COS and TVD. Due to heavy calculation time, we tried only 10 pseudocount values between 0.01 and 10.0 for SRC.
For ED, COS and TVD, x is {0, 1, 2, … , 60} and y is 20. For SRC, x is {0, 1, 2, … , 9} and y is 3.
RESULTS AND DISCUSSION
Differences between the seven comparison methods
As an example, we show the results for a typical matrix, MA0001 (transcription factor AGL3 in Arabidopsis thaliana), with 30 generated sequences (Figure 1). Interestingly, most of the comparison methods exhibit minimum distances at pseudocount values close to 1. The distances increase rapidly for pseudocounts greater than 1, and only slightly, if at all, for values less than 1. The SRC, however, has a different behavior: it clearly favors pseudocounts much less than 1.
Effect of sample size
Figure 2 indicates the results for matrix MA0001 for various sample sizes, using three comparison methods: matrix-based ED (A), sequence-based ED (B) and SRC (C). Pseudocount values close to 1 tend to minimize ED for all sample sizes, but this effect is more marked for small samples. In particular, pseudocounts much less than 1 give almost equal distances for large samples, but clearly greater distances for small samples. (Sequence-based EDs vary more than matrix-based EDs, because they are distances in a space of much higher dimensionality.) The SRC, however, is always optimized with pseudocount values much below 1, and this effect becomes more marked with larger sample sizes. Similar behavior is observed in results averaged over all motifs (Supplementary Figure 1).
Figure 2.

Pseudocount evaluations for JASPAR matrix ‘MA0001’: all sample sizes. For easier visualization, each line has been shifted vertically by subtracting its minimum value. Sample sizes are indicated on the right of each graph. (A) Matrix-based ED. (B) Sequence-based ED. (C) SRC.
Existence of an optimal pseudocount
Table 1 indicates how often there is an optimal pseudocount value (giving minimum distance) other than 0.01 or 10.0, for each comparison method and sample size. These are pooled results for all 122 JASPAR motifs. When using SRC or TVD, the smallest distance is usually achieved with a pseudocount of 0.01 (the lowest that we tested), so smaller pseudocounts are better, and there is no optimum within the range that we examined. When using ED or COS, on the other hand, there is nearly always an optimal pseudocount within this range.
Table 1.
Percentage of optimal pseudocount existence
| Sample size | Matrix-based |
Sequence-based |
|||||
|---|---|---|---|---|---|---|---|
| ED (%) | COS (%) | TVD (%) | ED (%) | COS (%) | TVD (%) | SRC (%) | |
| 10 | 99.2 | 100.0 | 28.7 | 100.0 | 95.9 | 54.1 | 45.9 |
| 20 | 99.2 | 100.0 | 16.4 | 99.2 | 95.9 | 26.2 | 34.4 |
| 30 | 100.0 | 100.0 | 13.1 | 100.0 | 94.3 | 13.1 | 20.5 |
| 40 | 100.0 | 100.0 | 9.0 | 99.2 | 95.1 | 11.5 | 14.8 |
| 50 | 100.0 | 99.2 | 10.7 | 99.2 | 95.1 | 9.0 | 5.7 |
Dependence of optimal pseudocount on sample size and entropy
Figure 3 shows how the optimal pseudocount values vary with sample size. In panels A and B, each line indicates one motif, and the color represents the average entropy of the original PPM: red indicates higher entropy; blue indicates lower entropy. Perhaps surprisingly, optimal pseudocount values are not strongly influenced by sample size in most cases. Increasing sample size leads to more accurate motifs, so pseudocounts should be less necessary. On the other hand, increasing sample size reduces the impact of pseudocounts. We infer that these two effects cancel each other, when using ED. In any case, the average optimal pseudocount over all motifs lies between 0.8 and 1.3 (Figure 3C). Similar behavior is observed when we use 15 well-characterized motifs, which are derived from at least 50 sequences (Supplementary Figure 2).
Figure 3.

(In)dependence of optimal pseudocounts on sample size. (A) Optimal pseudocounts using matrix-based ED. One line indicates one motif, colored by the column-wise average entropy of the original matrix. (B) Optimal pseudocounts using sequence-based ED. (C) Average optimal pseudocount over all motifs. The comparison methods are noted on the right: Mat ED = Matrix-based ED; Mat COS = Matrix-based COS; Seq ED = Sequence-based ED; Seq COS = Sequence-based COS.
Figure 3A and B also show that motifs with higher entropy have larger optimal pseudocounts, and vice versa. Figure 4 shows this more clearly: the optimal pseudocount is tightly correlated with the average entropy of the original matrix. Unfortunately, in practical applications we only have the sample, and we do not know the entropy of the ‘original’ motif. On the other hand, it is also possible to regard the entropy of the original matrix as that of an observed one and to further optimize the pseudocount value by regression for each matrix or even for each column of the matrix. We confirmed that these methods decreased the average distance but the effect was not drastic (data not shown). For practical use, considering that optimal pseudocounts are usually close to 1 (Supplementary Figure 3) and that too-small pseudocounts are preferable to too-large ones for all our measures, we suggest a uniform value of 0.8, for example.
Figure 4.

Dependence of optimal pseudocounts on average entropy. (A) Optimal pseudocounts using matrix-based ED. The correlation coefficient is 0.93, the correlation P-value is less than 2.2 × 10⁻¹⁶, and the R2 value is 0.95. (B) Optimal pseudocounts using sequence-based ED. The correlation coefficient is 0.93, the correlation P-value is less than 2.2 × 10⁻¹⁶ and the R2 value is 0.85.
Confirmation using real sequences
The results described above were obtained using virtual binding site samples generated from an original PPM. We repeated our tests by, instead, sampling with replacement from the real binding site sequences upon which the JASPAR matrices are based. These results are essentially the same as those above (not shown).
CONCLUSIONS
Although optimal pseudocount values depend on the comparison method, we can draw some general conclusions. First, all comparison methods indicate that pseudocounts much above 1 are a poor choice. This argues against using the square root of the sample size (9). It also argues for using values below 4, corresponding to Dirichlet priors with an anti-peaked shape, as suggested previously (6). (The value 4—more generally, the alphabet size—is special because it corresponds to an uninformed prior.) The results using ED and COS suggest that values close to 1 are optimal, although the optimal pseudocount depends on the entropy of the original motif (which is unknown in practice). This supports the choice of Hughes et al. to use a pseudocount of 1 (5). For large sample sizes, however, pseudocounts much less than one are only marginally worse. Several previous studies have examined methods to compare motif matrices, although not with the aim of optimizing pseudocounts (14–16): they have generally concluded that ED is a good measure for their purposes.
On the other hand, the results using SRC and TVD support the use of pseudocounts much less than 1, e.g. Ref. (4). It could be argued that SRC is the most relevant measure for motif scanning, since one typically makes predictions for all w-mers that score above some threshold, i.e. all w-mers above some rank. To maximize the correlation between the predicted ranks and the true ranks, it seems best to use a very low pseudocount. Thus, the widespread belief that zeros should be avoided in motif matrices may be incorrect, at least for DNA motifs. In summary, depending on the comparison method, optimal pseudocounts for transcription factor binding motifs are either around 1, or very low.
It is noteworthy that our main conclusions (data size independency and correlation with entropy) for the cases when optimal values exist have been obtained by a totally different approach on a different system also (17). This agreement between our relatively empirical and intuitive approach and their theoretical approach should strengthen the validity of our conclusions.
Supplementary Data
Supplementary Data are available at NAR Online.
FUNDING
This work was supported in part by Global COE Program (Center of Education and Research for Advanced Genome-Based Medicine), MEXT, Japan. Funding for open access charge: Japan Science and Technology Agency (JST).
Conflict of interest statement. None declared.
Supplementary Material
ACKNOWLEDGEMENTS
The authors would like to thank Riu Yamashita and Nicolas Sierro for helpful discussion and critical remarks. They also thank Stephen F. Altschul for letting us read their manuscript before submission. Computational time was provided by the Super Computer System, Human Genome Center, Institute of Medical Science, The University of Tokyo.
REFERENCES
- 1.Wasserman WW, Sandelin A. Applied bioinformatics for the identification of regulatory elements. Nat. Rev. Genet. 2004;5:276–287. doi: 10.1038/nrg1315. [DOI] [PubMed] [Google Scholar]
- 2.Schneider TD, Stephens RM. Sequence logos: a new way to display consensus sequences. Nucleic Acids Res. 1990;18:6097–6100. doi: 10.1093/nar/18.20.6097. [DOI] [PMC free article] [PubMed] [Google Scholar]
- 3.Durbin R, Eddy SR, Krogh A, Mitchison G. Biological Sequence Analysis: Probabilistic Models of Proteins and Nucleic Acids. Cambridge, UK: Cambridge University Press; 1998. [Google Scholar]
- 4.Chen QK, Hertz GZ, Stormo GD. MATRIX SEARCH 1.0: a computer program that scans DNA sequences for transcriptional elements using a database of weight matrices. Comput. Appl. Biosci. 1995;11:563–566. doi: 10.1093/bioinformatics/11.5.563. [DOI] [PubMed] [Google Scholar]
- 5.Hughes JD, Estep PW, Tavazoie S, Church GM. Computational identification of cis-regulatory elements associated with groups of functionally related genes in Saccharomyces cerevisiae. J. Mol. Biol. 2000;296:1205–1214. doi: 10.1006/jmbi.2000.3519. [DOI] [PubMed] [Google Scholar]
- 6.Frith MC, Fu Y, Yu L, Chen JF, Hansen U, Weng Z. Detection of functional DNA motifs via statistical over-representation. Nucleic Acids Res. 2004;32:1372–1381. doi: 10.1093/nar/gkh299. [DOI] [PMC free article] [PubMed] [Google Scholar]
- 7.Mironov AA, Koonin EV, Roytberg MA, Gelfand MS. Computer analysis of transcription regulatory patterns in completely sequenced bacterial genomes. Nucleic Acids Res. 1999;27:2981–2989. doi: 10.1093/nar/27.14.2981. [DOI] [PMC free article] [PubMed] [Google Scholar]
- 8.Berg OG, von Hippel PH. Selection of DNA binding sites by regulatory proteins. Statistical-mechanical theory and application to operators and promoters. J. Mol. Biol. 1987;193:723–750. doi: 10.1016/0022-2836(87)90354-8. [DOI] [PubMed] [Google Scholar]
- 9.Lawrence CE, Altschul SF, Boguski MS, Liu JS, Neuwald AF, Wootton JC. Detecting subtle sequence signals: a Gibbs sampling strategy for multiple alignment. Science. 1993;262:208–214. doi: 10.1126/science.8211139. [DOI] [PubMed] [Google Scholar]
- 10.Tatusov RL, Altschul SF, Koonin EV. Detection of conserved segments in proteins: iterative scanning of sequence databases with alignment blocks. Proc. Natl Acad. Sci. USA. 1994;91:12091–12095. doi: 10.1073/pnas.91.25.12091. [DOI] [PMC free article] [PubMed] [Google Scholar]
- 11.Karplus M, Sali A. Theoretical studies of protein folding and unfolding. Curr. Opin. Struct. Biol. 1995;5:58–73. doi: 10.1016/0959-440x(95)80010-x. [DOI] [PubMed] [Google Scholar]
- 12.Henikoff JG, Henikoff S. Using substitution probabilities to improve position-specific scoring matrices. Comput. Appl. Biosci. 1996;12:135–143. doi: 10.1093/bioinformatics/12.2.135. [DOI] [PubMed] [Google Scholar]
- 13.Sandelin A, Alkema W, Engstrom P, Wasserman WW, Lenhard B. JASPAR: an open-access database for eukaryotic transcription factor binding profiles. Nucleic Acids Res. 2004;32:D91–D94. doi: 10.1093/nar/gkh012. [DOI] [PMC free article] [PubMed] [Google Scholar]
- 14.Gupta S, Stamatoyannopoulos JA, Bailey TL, Noble WS. Quantifying similarity between motifs. Genome Biol. 2007;8:R24. doi: 10.1186/gb-2007-8-2-r24. [DOI] [PMC free article] [PubMed] [Google Scholar]
- 15.Mahony S, Auron PE, Benos PV. DNA familial binding profiles made easy: comparison of various motif alignment and clustering strategies. PLoS Comput. Biol. 2007;3:e61. doi: 10.1371/journal.pcbi.0030061. [DOI] [PMC free article] [PubMed] [Google Scholar]
- 16.Pape UJ, Rahmann S, Vingron M. Natural similarity measures between position frequency matrices with an application to clustering. Bioinformatics. 2008;24:350–357. doi: 10.1093/bioinformatics/btm610. [DOI] [PubMed] [Google Scholar]
- 17.Altschul SF, Gertz EM, Agarwala R, Schaffer AA, Yu Yi-K. PSI-BLAST pseudocounts and the minimum description length principle. Nucleic Acids Res. 2009 doi: 10.1093/nar/gkn981. doi:10.1093/nar/gkn981. [DOI] [PMC free article] [PubMed] [Google Scholar]
Associated Data
This section collects any data citations, data availability statements, or supplementary materials included in this article.