


Abstract
Gold standard datasets on protein complexes are key to inferring and validating protein–protein interactions. Despite much progress in characterizing protein complexes in the yeast Saccharomyces cerevisiae, numerous researchers still use as reference the manually curated complexes catalogued by the Munich Information Center of Protein Sequences database. Although this catalogue has served the community extremely well, it no longer reflects the current state of knowledge. Here, we report two catalogues of yeast protein complexes as results of systematic curation efforts. The first one, denoted as CYC2008, is a comprehensive catalogue of 408 manually curated heteromeric protein complexes reliably backed by small-scale experiments reported in the current literature. This catalogue represents an up-to-date reference set for biologists interested in discovering protein interactions and protein complexes. The second catalogue, denoted as YHTP2008, comprises 400 high-throughput complexes annotated with current literature evidence. Among them, 262 correspond, at least partially, to CYC2008 complexes. Evidence for interacting subunits is collected for 68 complexes that have only partial or no overlap with CYC2008 complexes, whereas no literature evidence was found for 100 complexes. Some of these partially supported and as yet unsupported complexes may be interesting candidates for experimental follow up. Both catalogues are freely available at: http://wodaklab.org/cyc2008/.
INTRODUCTION
Extensively validated, highly reliable protein–protein interaction (PPI) sets, the so-called ‘Gold Standards’ play a key role in deriving protein interaction networks using machine learning approaches (1–3). In deriving such networks for the yeast Saccharomyces cerevisiae the most widely used ‘gold standard’ dataset has been the manually curated protein complexes catalogued in the Munich Information Center for Protein Sequences (MIPS) database (4). Although this catalogue has served the community extremely well, it no longer reflects the current state of knowledge in the field (5). Furthermore, it lacks direct links to published evidence and its hierarchical organization is sometimes ad hoc. Thanks to advances in protein purification methods and proteomics techniques (6), many new yeast complexes have been identified in small-scale and large-scale experiments since the MIPS catalogue was compiled. But, information on these newly identified complexes is scattered across numerous publications and several databases, among which the Saccharomyces Genome Database (SGD) (7) certainly offers the most up-to-date information and literature annotations.
In order to produce a new comprehensive list of yeast protein complexes that reflect the current state of the field, we have combined the results from recent high-throughput studies with findings of small-scale experiments by systematically annotating 400 complexes (8) predicted using the Markov Clustering algorithm (9) from one of the highest quality experimentally derived physical interaction networks (1). We annotated these predicted complexes individually by reviewing publications that report complexes sharing subunits with the predicted complex. Under the guidance of the set of 400 complexes identified in the high quality interaction network, we were able to retrieve 408 heteromeric complexes in S. cerevisiae fully backed by small-scale experiments from the literature. The results of this work are two catalogues of annotated yeast protein complexes: The first set, denoted as YHTP2008, comprises 400 complexes derived from genome-wide high-throughput studies (8). Among them, 262 have been annotated with literature citations, and the remaining 138 are putative complexes that have hitherto not been reported. This provides for the first time detailed information on the correspondence between individual protein complexes derived from high-throughput studies and results of small-scale experiments reported in the current literature.
The second catalogue is a set of 408 manually curated yeast complexes derived in small-scale studies, denoted as CYC2008. We believe that this set represents a more complete and up-to-date description of the stable yeast intercatome as currently described in the literature, than the one available previously (215 heteromeric complexes of the MIPS catalogue) and should hence serve as an improved gold standard for groups developing methods for the prediction of protein interactions and complexes. Both catalogues are freely available for download and the CYC2008 catalogue can also be explored interactively at: http://wodaklab.org/cyc2008/.
MATERIALS AND METHODS
Annotation of the YHTP2008 catalogue
The YHTP2008 catalogue comprises the 400 complexes derived as described by Pu et al. (8) from the consolidated S. cerevisiae protein interactions networks built by applying the Purification Enrichment (PE) score (1) to the two most recent genome-wide purification studies in yeast (2,10). These complexes were systematically annotated with literature citations as follows. For each complex, we reviewed publications reporting small-scale studies describing complexes sharing all or part of the subunits and the interactions with those in the YHTP complex. When identical or partially overlapping complexes were reported in the publication, the title, author(s), experimental method(s) and PubMed ID of the original publication were recorded. We also recorded whether the given complex is already annotated in the MIPS database. When no publication referring to co-purified components of the YHTP complex was found, publications reporting evidence for pair-wise interactions between components of the complex were collected. When evidence was found for at least one interacting pair of genes of an YHTP complex, it was labeled as a ‘Candidate complex’; otherwise, it was labeled as ‘to be determined’ (TBD).
Compilation of the CYC2008 catalogue
While annotating the YHTP complexes, every time a literature reference completely recapitulated an YHTP complex, this complex was archived in a separate list, named CYC2008. When an YHTP complex partially overlaps with a complex reported in the literature, only the literature defined complex was archived in the CYC2008. The experimental methods employed for identifying the complex in the publication were obtained from the Materials and methods section of the original paper and were classified using the Experimental Systems Code of The Biological General Repository for Interaction Datasets (BioGrid) database (11). When several papers were found to report the identification of the subunits of a complex, only the PubMed ID of the most recent paper was recorded. The purpose of recording this reference was to provide an entry point for retrieving the most up-to-date information related to complexes, not to archive a comprehensive list of all papers that identify various subunits of a particular complex. In total, 326 complexes backed by evidence from small-scale experiments were collected into the list of curated yeast complexes at the end of this annotation process.
In order to improve the completeness of this list, we supplemented it with complexes mentioned in the Description record of the SGD (7). More specifically, these Description records were text-mined for the words ‘complex’, ‘dimer’, or ‘trimer’. Complexes captured in this way and not yet present in the current list of curated yeast complexes were again verified by reviewing original papers that reported these complexes, using the procedure described above. This resulted in adding 82 additional complexes to the CYC2008 list. Among them, 43 were absent from the SGD complex list downloaded on 21 April 2008 (available at: ftp://genome-ftp.stanford.edu/pub/yeast/data_download/literature_curation/go_protein_complex_slim.tab), and another 19 have different subunit compositions from those in the SGD complex list.
Comparison of CYC2008 with existing sets of yeast protein complexes
The MIPS complexes, SGD complexes and those derived from high-throughput experiments were obtained from the sources listed in Table 1.
Table 1.
Sources of information on yeast protein complexes
| Complexes | Source |
|---|---|
| MIPS | ftp://ftpmips.gsf.de/yeast/catalogues/complexcat/ |
| SGD | ftp://genome-ftp.stanford.edu/pub/yeast/data_download/literature_curation/ |
| BioGrid | Reguly et al. (17) |
| YHTP2008 | Pu et al. (8) |
| Gavin | Gavin et al. (10) |
| Krogan | Krogan et al. (2) |
The MIPS complexes were taken at the leaf level of the hierarchical scheme, excluding homomeric complexes and complexes bearing the Systematic Analysis Code 550. The SGD complexes (file name at the SGD ftp site: go_protein_complex_slim.tab) represents mapping of gene products to the direct children of the ‘Macromolecular complex’ GO term (GOID:32991). BioGrid complexes can be found in the online supplementary materials of Reguly et al. (17): Supplementary Table 2: Co-purified complexes in the literature curated (LC) dataset.
A complex by complex comparison was performed between the CYC2008 complexes and each of the complex sets listed in Table 1. The Jaccard index was used to quantify the overlap between complexes. For a pair of complexes i from CYC2008 and j from one of the other sets of complexes, the Jaccard index Jij = q/(q + r + s) is computed, where q is the number of subunits common to both i and j, while r and s are the number of subunits unique to i and j, respectively. Complex j is considered as the maximal match of i if Jij ⩾ Jix for any complex x ≠ j in the complex set.
To quantify the modularity of the complexes in each set, the overlap among complexes in the same set was calculated as detailed in Pu et al. (8). Briefly, the average overlap per complex, Overlap_C, is computed as (2 × Noc)/Nc, where Noc is the total number of unordered pairs of overlapping complexes in the network and Nc is the total number of complexes. The average number of proteins shared between overlapping complexes was computed as 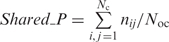 where nij is the number of proteins shared between pairs of complexes i and j, i ≠ j. Nc is the total number of complexes and Noc is the total number of pairs of overlapping complexes as mentioned above.
Evaluating the support by binary interactions
Three datasets of binary PPI were collected in order to assess the extent to which the complexes, annotated here, that are supported by binary interactions between complex components.
The first dataset is the high quality yeast two-hybrid (Y2H) dataset containing 2930 interactions among 2018 proteins (3). This dataset, denoted Y2H-Union, is the union of the high quality portions of the data from three high-throughput Y2H studies (3,12,13) and was downloaded from http://interactome.dfci.harvard.edu/S_cerevisiae/.
The second dataset is derived from a recently published genome-wide screen of yeast PPI using a protein-fragment complementation assay (PCA), which identified 2770 interactions among 1124 proteins (14). The third dataset encompasses 1985 interactions among 536 integral membrane proteins identified with a modified split-ubiquitin technique named Membrane Yeast Two-Hybrid (MYTH) (15). These three datasets taken together contain 7086 unique interactions among 2929 proteins (representing about 50% of the yeast genome). It should be noted, that although the interactions detected in these studies tend to be considered as representing direct physical interactions, this may not necessarily be the case. Indeed, none of the abovementioned detection methods is able to differentiate between a direct physical interaction and one that is mediate by one (or a few) additional partners. However, the fraction of indirect interactions in the dataset would vary with the detection method and the proteins considered.
For the purpose of the present analysis, the interactions from all three datasets are considered as pair-wise ‘direct’ interactions. An interaction is defined as ‘within-complex’ when both interaction partners map into the same complex in our annotated set. An interaction between two proteins that map into different complexes is termed ‘between-complex’.
Coverage of the yeast genome
Gene ontology (GO) (16) slim annotations of yeast genes in the Biological Process and Cellular Component categories were obtained from the SGD ftp site: ftp://genome-ftp.stanford.edu/pub/yeast/data_download/literature_curation/on 4 June 2008. Coverage of the yeast genome by genes in analyzed complexes was computed for each GO term in the above two categories.
Functional annotations of CYC2008 complexes
A complex is annotated with a GO term if all subunits of the complex are annotated with a particular GO term, or the complex is enriched with genes that are annotated with a particular GO term. The enrichment is determined using hypergeometric tests with Bonferroni corrections; the level of significance is set at an E-value = 0.05. Specifically, let N be the total number of genes in the yeast genome, NT be the number of genes annotated with GO term T, NC be the number of subunits in complex C, NCT be the number of subunits in complex C that are annotated with GO term T, to determine if C is enriched with T, the probability of observing at least NCT subunits annotated with GO term T by chance, p(C,T), is computed as follows:
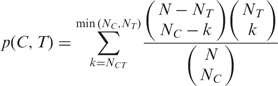 |
The probability p(C,T) is corrected for multi-testing by multiplying it with the product of the number of complexes and the number of GO terms to get final expected value (E-value).
RESULTS
Annotated YHTP2008 catalogue
The complexes in this catalogue are those derived by Pu et al. (8) from the consolidated protein interaction network produced by Collins et al. (1) from the two most recent high-throughput genome-wide purification studies (2,10). These complexes were annotated here with literature references as described in the Materials and methods section, with the results summarized in Supplementary Table S1.
The complexes that are absent from both the MIPS and SGD databases and for which no supporting evidence could be found in publications reporting small-scale studies are considered here as putative complexes. They are annotated as ‘none’ in the ‘Related known complex’ column of the Supplementary Table S1. In the ‘Putative complex’ column of Supplementary Table S1, it is indicated whether a putative complex is likely to be a candidate complex based on the amount of information available on the interactions between its subunits. PPI data derived from both small-scale and high-throughput studies and archived in the SGD database were used to make these judgments (see Materials and methods section). Complexes marked as ‘Candidate complex’ are those where one or more pair-wise interactions are supported by one or more studies, as is the case of Complex 224 (TMA20/TMA22). It is indeed believed that the likelihood that an interaction is genuine increases with the number of different publications that report it (17). Hence, previously unreported complexes that comprise such interactions are good candidates for further experimental validation. When no literature evidence what so ever could be found, the YHTP complex is denoted as TBD.
For complexes for which some literature support was found, the annotations compare the YHTP complexes with those reported in the literature (the column ‘complete known complex’) gene by gene. If the two complexes are identical, the YHTP complex is denoted as a ‘complete complex’ in the column ‘Putative complex’. This complex is then considered as fully supported by the literature (e.g. Complex 211 is the RAVE complex). Otherwise, the predicted complexes may sometimes contain subunits in addition to those of known complexes (e.g. in Complex 55, LHP1 may be a novel subunit of the Signal Recognition Particle and is highlighted in the column ‘genes belonging to no complexes’). Due to limitations of the high-throughput approaches, a predicted complex may be a partial complex (e.g. Complex 219 is annotated as ‘part of a complex’) or contains multiple complexes, which share subunits extensively (e.g. Complex 3 encompassing subunits of all three RNA polymerases is annotated as ‘contains complexes’).
Annotation of YHTP complexes is summarized in the Supplementary Figure S1. Among the 400 YHTP complexes annotated here, 75 are identical to complexes reported in small-scale experiments, 138 have no correspondence at all with those reported in such experiments, and are thus putative complexes that could be examined further. The remaining complexes partially overlap with complexes reported in the literature. By gathering additional evidence from the literature on PPIs in the putative complexes and partially overlapping complexes, we were able to identify 68 candidate complexes (38 and 30 from non-overlapping and partially overlapping complexes, respectively) and marked as such in the ‘Putative complex’ column of the Supplementary Table S1. We suggest that these complexes should be of high priority for further experimental validation.
CYC2008 complexes set
Using a targeted literature search approach, primarily guided by the annotation of the YHTP2008 complexes, we were able to compile a list of 408 heteromeric yeast protein complexes (Supplementary Table S2), each completely backed by small-scale experiments.
These complexes comprise on average 4.7 subunits and their size distribution follows a power law (Supplementary Figure S2). Affinity capture followed by Western blot (e.g. co-immunoprecipitation) remains the most popular technique for yeast protein complex identification in small-scale experiments (Supplementary Figure S3). The results of GO functional categories analysis of the genes belonging to CYC2008 complexes are summarized in Supplementary Figure S4. In the Biological Process category (Supplementary Figure S4a), CYC2008 complexes cover over 70% of the S. cerevisiae genes involved in transcription and translation, while genes involved in metabolisms are poorly represented (less than 20%). In the Cellular Component category (Supplementary Figure S4b), genes localized in the ribosome and chromosomes are well represented (>70%), while those residing in the plasma membrane are poorly covered. The latter finding reflects the fact that complexes involving membrane proteins are difficult to purify using standard protocols (15).
As illustrated in Figure 1, only a limited fraction of the CYC2008 complexes have nearly perfect overlaps (Jaccard index > 0.9) with the complexes in SGD and MIPS (40% and 22%, respectively). On the other end of the spectrum, 23% and 38% of CYC2008 complexes have no counterpart (Jaccard index ⩽ 0.1) in the SGD and MIPS complexes, respectively. These simple statistics clearly indicate that CYC2008 catalogue differs significantly from MIPS and SGD catalogues and is more comprehensive.
Figure 1.

Quantifying the correspondence of CYC2008 complexes with those in other sets of yeast protein complexes. Each complex in the CYC2008 is mapped into complexes in six other sets. These are MIPS, SGD, BioGrid, Krogan, Gavin and YHTP2008 (see Table 1 for details of these datasets). A Jaccard index is computed for each pair of matching complexes to quantify the extent of overlap between the complex components (see Materials and methods section for details). A Jaccard index of 1 indicates that two complexes are identical in terms of subunit compositions, and index of 0 means no overlap at all. This figure shows, for example, that only 165 CYC2008 complexes are nearly identical (0.9 < Jaccard index ⩽ 1.0) to SGD complexes, while 93 CYC2008 complexes have no overlap with any SGD complexes (Jaccard index = 0).
To further characterize the CYC2008 complexes, we assessed the extent to which specific protein subunits are shared between complexes within various complex sets, with the results summarized in Table 2. While the complexes identified by the genome-wide TAP-tagging analysis of Krogan and colleagues (2) do not share subunits, those identified by Gavin and colleagues (10) are highly overlapping. Although CYC2008 has 90% more complexes than in MIPS (408 versus 215), it resembles the MIPS complexes in terms of the average number complexes that share subunits with a given complex, the average number of shared genes per complex and the fraction of complexes that share subunits with others. However, this resemblance is not surprising given that both MIPS and CYC2008 complexes are derived from small-scale experiments.
Table 2.
Subunits sharing between complexes within different complex catalogues
| Complex sets | CYC2008 | MIPS | SGD | BioGrid | YTHP400 | Krogan | Gavin |
|---|---|---|---|---|---|---|---|
| Number of complexes | 408 | 215 | 293 | 234 | 400 | 547 | 491 |
| Number of overlapping pairs | 430 | 168 | 1052 | 1206 | 194 | 0 | 19576 |
| Average overlap per complex | 1.054 | 0.781 | 3.542 | 5.154 | 0.485 | 0.000 | 39.870 |
| Average number of shared genes | 2.047 | 2.417 | 8.781 | 2.488 | 2.505 | 0.000 | 2.399 |
| Fraction of overlapping complexes | 0.436 | 0.414 | 0.670 | 0.744 | 0.195 | 0.000 | 0.969 |
The complex catalogues are the same as those considered in Figure 1 and Table 1 (see legend of Figure 1 and Table 1 for details). The overlap between complexes was computed as described in Materials and methods section. Number of overlapping pairs: number of complex pairs sharing subunits. Average overlap per complex: average number of other complexes with which a given complex shares subunits. Average number of shared genes: average number of subunits shared between pairs of overlapping complexes. Fraction of overlapping complexes: The fraction of complexes that share subunits with one or more other complexes.
An important goal in compiling an up-to-date set of protein complexes is to derive from it a reference set of co-complex binary protein–protein associations. We derived such reference set from the 408 complexes in CYC2008 and compared it to co-complex associations derived from the MIPS and SGD complexes. In addition, we compared the set of co-complex associations derived from all three sets with PPIs archived in the BioGrid (11) database (Table 3). The BioGrid yeast PPI data (version 2.0.39) were downloaded from the URL: http://www.thebiogrid.org/downloads.php on 25 March 2008, and all genetic interactions were filtered out prior to analysis.
Table 3.
Percentages of co-complex associations derived from different catalogues of yeast protein complexes, which overlap with PPIs archived in BioGrid database (17)
| Curated set | Number of genes in complexes | Number of co-complex pairs | Overlap with BioGrid |
|---|---|---|---|
| CYC2008 | 1630 | 11 327 | 53% |
| MIPS | 1194 | 11 014 | 38% |
| SGD | 1816 | 251 058 | 4.3% |
Co-complex associations are all pair-wise links between proteins belonging to the same complex. They are computed here for the three curated complex catalogues (MIPS, SGD and CYC2008) considered in this study, detailed in the Table 1. The inordinately large number of co-complex pairs derived from the SGD complexes stem from the fact that these complexes tend to represent functional groups and not physical complexes, as discussed in the text.
Following others (1,2,5) we define co-complex associations as associations between any pair of proteins that belong to a complex, also known as the ‘matrix’ representation of PPIs (1). We find that more than half of CYC2008 co-complex associations (53%) correspond to PPIs in BioGrid. Considering that BioGrid uses a generalized spoke model to represent interactions (11), this overlap would very likely increase if the same model were used in both datasets. The overlap of the MIPS co-complex associations with BioGrid is much more limited (38%), and it is particularly small for SGD complexes. However, it should be noted that SGD derives complex memberships based on experimentally derived GO annotations in the Cellular Component category, which is structured as a hierarchically organized directed acyclic graph (16). As a result, complexes defined at different levels of the functional or structural hierarchy co-exist in SGD complexes set (e.g. ‘ribosome’, ‘cytosolic ribosome’ and ‘cytosolic small ribosomal subunit’ are all present as complexes in the set). This representation has two implications: first, the overlap among complexes is significant (Table 2), as complexes at different levels of the hierarchy naturally overlap with one another; second, some complexes actually represent functional groups (e.g. ‘ribosome’ and ‘transcription factor complex’) and are artificially large, which produce a large number of co-complex associations, as shown in Table 3. Another example illustrating this problem is the ‘histone deacetylase complex’. SGD lists 18 genes under this term; however, these 18 genes belong to four different physical complexes (Rpd3L complex, Rpd3S complex, HDA complex and Set3 complex), which are also listed as individual complexes in SGD. While the Cellular Component terms of GO correctly reflect the functional grouping of genes in these complexes, using such grouping to derive co-complex associations would invariably result in an increased number of False Positives (inferred associations that do not correspond to physical interactions).
Support for CYC2008 from direct binary interactions
Having derived an augmented, up-to-date set of S. cerevisiae complexes, it is of interest to assess the extent to which these complexes are supported by binary PPIs obtained by techniques geared at detecting such interactions directly. To that end data from a recent Y2H study (3), a large-scale PCA analysis (14) and an integral membrane protein-focused, split-ubiquitin-based study using MYTH (15) were pooled into a binary PPI network, encompassing 7086 interactions among 2929 proteins (see Materials and methods section for detail). Mapping these proteins onto the components of the CYC2008 complexes shows that only 917 genes/protein are shared between the two sets (representing ∼31% of the proteins in the binary interaction set, and 56% of the proteins in the CYC2008 dataset). In total, 193 (47% of CYC2008) complexes harbor one or more of 438 within-complex interactions, with, on average, three subunits per complex involved in such interactions. At the same time, 243 complexes are linked by 421 between-complex interactions. Interestingly, of the 438 within-complex binary interactions, the majority 321 (73%) has been identified by the Y2H screens, while 212 (48%) and 21(5%), have been identified the PCA and MYTH techniques. Among the 193 complexes that contains binary interactions the majority, 144 (75%) are small complexes with less than six subunits. Most large complexes that are well supported by Y2H binary interactions are located in the cell nucleus (e.g. the mediator, SAGA and U4/U6 × U5 tri-snRNP complexes). The PCA is very successful with detecting interactions between the components of the proteosome and the CCR4-NOT core complex. All ribosomal complexes (except for the cytoplasmic ribosomal large subunit, which is supported by only two binary interactions) have no support from the high quality binary interaction datasets analyzed here. The remaining vast majority (88%) of the binary interactions either link a protein belonging to a complex with another protein that is not part of any CYC2008 complex (2173 interactions or ∼31% of all the analyzed binary interactions) or link two proteins that are part of none of the CYC2008 complexes (3910, or 55% of the binary interactions).
CYC2008 on the web
To facilitate exploration of the CYC2008 complexes, an interactive website has been created (http://wodaklab.org/cyc2008/). The back end of the website is a relational database that stores information relevant to the CYC2008 complexes. The complexes can be queried by complex name, gene name, PubMed ID, etc. GO annotations are also provided for each complex, with a p-value and E-value associated with each GO term to indicate statistical significance of the functional enrichment. The complete CYC2008 catalogue as well as the full set of annotated YHTP2008 complexes can be freely downloaded for batch analysis. In addition, all the information described here has been made available to the MIPS and SGD databases for wider distribution to the scientific community.
DISCUSSION
Benchmark datasets play an important role in modern bioinformatics (3). The yeast complexes cataloged in the MIPS database have been widely used as a benchmark in recently published work on PPIs and protein complex prediction (5,18–20). However, this list has become outdated with the fast pace of progress in co-purification techniques. As a consequence of using MIPS as a benchmark, some recently predicted complexes denoted as ‘novel’ with respect to the set of MIPS complexes, are in fact not novel at all, as they have been identified in other (often more recent) small-scale studies. For instance, only 2 out 10 novel complexes (against MIPS complexes) predicted in (18) are not in CYC2008. The availability of the much larger and up-to-date CYC2008 set of yeast complexes will facilitate the identification of genuinely novel complexes, thus setting a new standard for methods that infer interactions and complexes in S. cerevisiae and related organisms.
Our comparative analysis also indicates that the CYC2008 catalogue has not only better coverage of the yeast genome, but is also a better representation of the stable yeast interactome than the MIPS complexes, as evidenced by the larger proportion of co-complex associations that correspond to BioGrid interactions. Hence, the CYC2008 catalogue should also represent an improved ‘Gold Standard’ set for machine learning procedures (Vlasblom et al. submitted).
Protein complexes are dynamic in nature. Assembly and dissociation of various complexes occur constantly in the cell. Several complexes may amalgamate to form larger cellular machines (e.g. pre-initiation complexes, kinetochores, splicesome, proteosome). To capture at least to some extent the dynamic nature of complexes, the MIPS database represents them in a hierarchic fashion. Since an important goal of our study has been to derive a reference set of stable co-complex associations, we chose to represent complexes in their modular form; that is, each complex is the smallest physical assembly of proteins detected using biochemical approaches. Therefore, larger complexes such as the nuclear pore complex, splicesome and kinetochore complexes are not archived as such in the CYC2008 catalogue. However, each of these larger complexes is represented by their corresponding smaller complexes that are readily detectible in small-scale studies. This representation minimizes the number of false positive co-complex associations that may arise by using the matrix model representation of PPIs/associations. This may in part explain the better specificity of CYC2008 co-complex associations than that of MIPS, when measured against PPIs archived in the BioGrid database, the bulk of which is derived from data on co-purified components.
In comparison, the overlap between the CYC2008 complexes and a compendium of the so-called direct binary interactions, collectively detected by the Y2H, PCA and MYTH techniques, is much more limited. Only 47% of the CYC2008 complexes have some support from direct binary interaction data, whereas the vast majority (94%) of the binary interactions fall outside of known complexes, as noted by others as well (3,14). The very scant overlap with the binary interactions identified using the MYTH technique is due to the fact that this technique focuses on the detection of membranes proteins, which have so far been poorly covered by co-purification methods. The limited overlap with the interactions detected by the Y2H and PCA methods is less obvious, and may stem from the different categories of interactions that these techniques and the co-purification methods are able to detect (stable versus more transient interactions), the different contexts in which the interactions are detected [in different organelles (co-purification and PCA), versus only in the nucleus (for Y2H)]. With PCA capable of detecting association between proteins separated by up to 80 Å (14), the context of these associations (e.g. number and type of intervening partners) may vary substantially, explaining the particularly poor overlap of these associations with co-complex interactions.
With an unknown fraction of the binary interactions being mediated by intervening partners, it is furthermore not straightforward at this point to derive topology descriptions from binary interactions even for complexes well supported by such interactions.
Last but not the least, the annotated YHTP2008 catalogue provides for the first time detailed information on the correspondence between complexes identified by high-throughput studies and those characterized by small-scale experiments reported in the current literature. The availability of this information should make it possible for experimental groups to follow up more systematically on the potential discoveries made by the high-throughput experiments.
SUPPLEMENTARY DATA
Supplementary Data are available at NAR Online.
FUNDING
S.J.W. is Tier 1 Canada Research Chair in Computational Biology and Bioinformatics and acknowledges support from the Canada Institute for Health Research, the Hospital for Sick Children and the Sickkids Foundation, Toronto, Canada. Funding for open access charge: Canada Institute for Health Research.
Conflict of interest statement. None declared.
Supplementary Material
ACKNOWLEDGEMENTS
We gratefully acknowledge the SGD and MIPS databases for their continuing services to the community and for providing us with the basis on which our annotation effort was built. Miguel Santos, and the systems support team of the Centre for Computational Biology at the Hospital for Sick Children are thanked for help with the computer systems. S.P. acknowledges the McLaughlin Centre for Molecular Medicine (MCMM) for support.
REFERENCES
- 1.Collins SR, Kemmeren P, Zhao XC, Greenblatt JF, Spencer F, Holstege FC, Weissman JS, Krogan NJ. Toward a comprehensive atlas of the physical interactome of Saccharomyces cerevisiae. Mol. Cell. Proteomics. 2007;6:439–450. doi: 10.1074/mcp.M600381-MCP200. [DOI] [PubMed] [Google Scholar]
- 2.Krogan NJ, Cagney G, Yu H, Zhong G, Guo X, Ignatchenko A, Li J, Pu S, Datta N, Tikuisis AP, et al. Global landscape of protein complexes in the yeast Saccharomyces cerevisiae. Nature. 2006;440:637–643. doi: 10.1038/nature04670. [DOI] [PubMed] [Google Scholar]
- 3.Yu H, Braun P, Yildirim MA, Lemmens I, Venkatesan K, Sahalie J, Hirozane-Kishikawa T, Gebreab F, Li N, Simonis N, et al. High-quality binary protein interaction map of the yeast interactome network. Science. 2008;322:104–110. doi: 10.1126/science.1158684. [DOI] [PMC free article] [PubMed] [Google Scholar]
- 4.Mewes HW, Amid C, Arnold R, Frishman D, Guldener U, Mannhaupt G, Munsterkotter M, Pagel P, Strack N, Stumpflen V, et al. MIPS: analysis and annotation of proteins from whole genomes. Nucleic Acids Res. 2004;32:D41–D44. doi: 10.1093/nar/gkh092. [DOI] [PMC free article] [PubMed] [Google Scholar]
- 5.Qiu J, Noble WS. Predicting co-complexed protein pairs from heterogeneous data. PLoS Comput. Biol. 2008;4:e1000054. doi: 10.1371/journal.pcbi.1000054. [DOI] [PMC free article] [PubMed] [Google Scholar]
- 6.Rigaut G, Shevchenko A, Rutz B, Wilm M, Mann M, Seraphin B. A generic protein purification method for protein complex characterization and proteome exploration. Nat. Biotechnol. 1999;17:1030–1032. doi: 10.1038/13732. [DOI] [PubMed] [Google Scholar]
- 7.Cherry JM, Adler C, Ball C, Chervitz SA, Dwight SS, Hester ET, Jia Y, Juvik G, Roe T, Schroeder M, et al. SGD: Saccharomyces genome database. Nucleic Acids Res. 1998;26:73–79. doi: 10.1093/nar/26.1.73. [DOI] [PMC free article] [PubMed] [Google Scholar]
- 8.Pu S, Vlasblom J, Emili A, Greenblatt J, Wodak SJ. Identifying functional modules in the physical interactome of Saccharomyces cerevisiae. Proteomics. 2007;7:944–960. doi: 10.1002/pmic.200600636. [DOI] [PubMed] [Google Scholar]
- 9.Van Dongen S. Technical Report INS-R0010, National Research Institute for Mathematics and Computer Science in the Netherlands, Amsterdam. 2000. A cluster algorithm for graphs. [Google Scholar]
- 10.Gavin AC, Aloy P, Grandi P, Krause R, Boesche M, Marzioch M, Rau C, Jensen LJ, Bastuck S, Dumpelfeld B, et al. Proteome survey reveals modularity of the yeast cell machinery. Nature. 2006;440:631–636. doi: 10.1038/nature04532. [DOI] [PubMed] [Google Scholar]
- 11.Stark C, Breitkreutz BJ, Reguly T, Boucher L, Breitkreutz A, Tyers M. BioGRID: a general repository for interaction datasets. Nucleic Acids Res. 2006;34:D535–D539. doi: 10.1093/nar/gkj109. [DOI] [PMC free article] [PubMed] [Google Scholar]
- 12.Ito T, Chiba T, Ozawa R, Yoshida M, Hattori M, Sakaki Y. A comprehensive two-hybrid analysis to explore the yeast protein interactome. Proc. Natl Acad. Sci. USA. 2001;98:4569–4574. doi: 10.1073/pnas.061034498. [DOI] [PMC free article] [PubMed] [Google Scholar]
- 13.Uetz P, Giot L, Cagney G, Mansfield TA, Judson RS, Knight JR, Lockshon D, Narayan V, Srinivasan M, Pochart P, et al. A comprehensive analysis of protein–protein interactions in Saccharomyces cerevisiae. Nature. 2000;403:623–627. doi: 10.1038/35001009. [DOI] [PubMed] [Google Scholar]
- 14.Tarassov K, Messier V, Landry CR, Radinovic S, Molina MM, Shames I, Malitskaya Y, Vogel J, Bussey H, Michnick SW. An in vivo map of the yeast protein interactome. Science. 2008;320:1465–1470. doi: 10.1126/science.1153878. [DOI] [PubMed] [Google Scholar]
- 15.Miller JP, Lo RS, Ben-Hur A, Desmarais C, Stagljar I, Noble WS, Fields S. Large-scale identification of yeast integral membrane protein interactions. Proc. Natl Acad. Sci. USA. 2005;102:12123–12128. doi: 10.1073/pnas.0505482102. [DOI] [PMC free article] [PubMed] [Google Scholar]
- 16.Ashburner M, Ball CA, Blake JA, Botstein D, Butler H, Cherry JM, Davis AP, Dolinski K, Dwight SS, Eppig JT, et al. Gene ontology: tool for the unification of biology. The gene ontology consortium. Nat. Genet. 2000;25:25–29. doi: 10.1038/75556. [DOI] [PMC free article] [PubMed] [Google Scholar]
- 17.Reguly T, Breitkreutz A, Boucher L, Breitkreutz BJ, Hon GC, Myers CL, Parsons A, Friesen H, Oughtred R, Tong A, et al. Comprehensive curation and analysis of global interaction networks in Saccharomyces cerevisiae. J. Biol. 2006;5:11. doi: 10.1186/jbiol36. [DOI] [PMC free article] [PubMed] [Google Scholar]
- 18.Bandyopadhyay S, Kelley R, Krogan NJ, Ideker T. Functional maps of protein complexes from quantitative genetic interaction data. PLoS Comput. Biol. 2008;4:e1000065. doi: 10.1371/journal.pcbi.1000065. [DOI] [PMC free article] [PubMed] [Google Scholar]
- 19.Zhang B, Park BH, Karpinets T, Samatova NF. From pull-down data to protein interaction networks and complexes with biological relevance. Bioinformatics (Oxford, England) 2008;24:979–986. doi: 10.1093/bioinformatics/btn036. [DOI] [PubMed] [Google Scholar]
- 20.Kiemer L, Costa S, Ueffing M, Cesareni G. WI-PHI: a weighted yeast interactome enriched for direct physical interactions. Proteomics. 2007;7:932–943. doi: 10.1002/pmic.200600448. [DOI] [PubMed] [Google Scholar]
Associated Data
This section collects any data citations, data availability statements, or supplementary materials included in this article.