Abstract
We developed a miniature fiber optic pressure sensor system and utilized it for in vitro intradiscal pressure measurements for rodents. One of the unique features of this work is the design and fabrication of a sensor element with a multilayer polymer-metal diaphragm. This diaphragm consists of a base polyimide layer (150 nm thick), a metal reflective layer (1 μm thick), and another polyimide layer for protection and isolation (150 nm thick). The sensor element is biocompatible and can be fabricated by simple, batch-fabrication methods in a non-cleanroom environment with good device-to-device uniformity. The fabricated sensor element has an outer diameter of only 366 μm, which is small enough to be inserted into the rodent discs without disrupting the structure or altering the intradiscal pressures. In the calibration and in vitro rodent intradiscal pressure measurements, the sensor element exhibits a linear response to the applied pressure over the range of 0–70 kPa, with a sensitivity of 0.0206 μm/kPa and a resolution of 0.17 kPa. To our best knowledge, this work is the first successful demonstration of rodent intradiscal pressure measurements.
Keywords: Fabry, Pérot interferometers, fiber optic sensors, intervertebral disc pressure, low-coherence interferometry, pressure sensors
1. Introduction
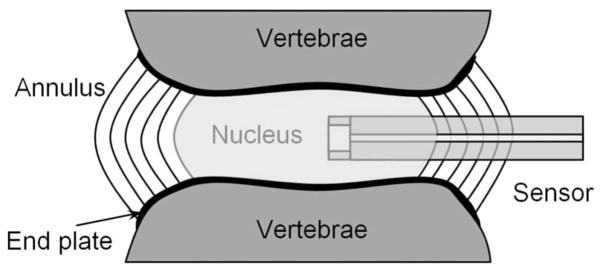
Lower back pain, which continues to be a leading cause of disability in people of all ages, has been associated with degenerative disc diseases. Some studies on humans and animals have found that the mechanical stress, especially the stress-induced fluid pressure within the intervertebral disc, is one of the main factors and indicators of the health of a disc.1,2 However, a quantitative study remains a challenge due to the constrained space inside a disc and the lack of miniature sensors. A simplified diagram of the healthy intervertebral disc is illustrated in Fig. 1. The disc is composed of an annulus fibrosus and a nucleus pulposus. The annulus fibrosus is a strong radial tirelike structure made up of lamellae, which are concentric sheets of collagen fibers connected to the vertebral end plates. The nucleus pulposus is enclosed by the annulus fibrosus. Although the nucleus pulposus is composed of water, collagen, and proteoglycans (PGs), the dominant portion of it is the fluid (water and PGs). The amount and pressure of water in the nucleus vary from time to time depending on physical activity and state of health. To measure the interstitial fluid pressure, a pressure sensor has to be inserted into the nucleus as shown in Fig. 1. Traditionally, commercially available miniature sensors are inserted via a needle through the annulus into the nucleus. Due to the relatively large size (in millimeters) of the sensors, the experimental studies are limited to humans, pigs, and rabbits that have large discs.3–6
Fig. 1.
Schematic diagram of a healthy intervertebral disc with the insertion of a miniature pressure sensor for intradiscal pressure measurements.
With the prevalent use of rodent disc models in mechanobiology, it is important to characterize the intradiscal pressure of rodent tails under external stresses. However, due to the small dimensions of the rodent disc, which is only a few millimeters in height, even the smallest-diameter probes that are currently available are too large to be inserted into rodent discs without altering the disc mechanics. Research conducted by Ryan and Hsieh7 showed that the insertion of a 22-gauge or smaller needle for introducing a pressure sensor into the disc would not adversely affect the disc mechanics; this prescribes an approximate maximum diameter of 400 μm for the pressure sensor.
To successfully carry out rodent disc pressure measurements, the sensor should have the following attributes: (1) miniature size, (2) biocompatibility, (3) appropriate dynamic range and sensitivity to capture the pressure within the rodent disc, and (4) adequate detection system to pick up the small diaphragm deformation. For the sensor fabrication, repeatable and batch fabrication is desirable. In addition, since the pressure sensor will be in direct contact with the biological tissue in the disc, the sensor diaphragm material should be elastic enough to avoid catastrophic failures.
Recent advances in fiber optic sensors have enabled the development of sensors with a size comparable to the optical fiber diameter (typically 125 μm). Such sensors make it possible to directly insert into rodent discs without adversly affecting the disc mechanics. In addition, fiber optic sensors have the advantages of being lightweight, biocompatible, highly sensitive, and not susceptible to electromagnetic interference (EMI).8 Optical sensors can also be exceedingly versatile, making them an appropriate choice for rodent disc pressure measurements.
Several miniature fiber optic pressure sensors have been reported recently.9–20 These sensors are used in either an intensity-based system13 or an interferometry-based system.9–12,14–20 Intensity-based systems measure the intensity change of the reflected light in response to the deflection of the sensor diaphragm. Such systems are simple to construct, but they suffer from the problems of low sensitivity, low resolution, and low signal-to-noise ratio due to power fluctuations, especially when a sensor is installed inside a catheter or a guide wire for invasive diagnosis and surgery. Interferometry-based systems make use of the interference between the reflected beam from a diaphragm and another reflected beam from the fiber end face, constituting a low-finesse Fabry–Pérot (FP) cavity. Most FP sensors are based on conventional interferometry with a coherent light source (e.g., Refs. 10, 12, and 14). These sensors are typically operated within a “linear” range in the vicinity of a quadrature point and hence have a limited dynamic range. In addition, the sensor operating point suffers from drift due to environmental perturbations and light-source wavelength fluctuations. The low-coherence interferometry technique has been introduced to address these problems. In this technique, a broadband light source is used to illuminate the system. In spectral-domain processing, a change in pressure will cause a corresponding change in the spectrum-domain interference pattern.9,11,16–19 This change can be directly measured by using a spectrometer or an optical spectrum analyzer (OSA). Such a system has a large dynamic range, a high signal-to-noise ratio, and immunity to power and wavelength fluctuations in the light source.
In terms of sensor design and fabrication, the reported miniature fiber optic pressure sensors can be classified into the following categories: (1) pressure probes fabricated by using conventional machining and assembly techniques,12,14,15 (2) all-silica pressure sensors fabricated by using splicing, cleaving, and wet etching the optical fibers and the silica tubes,10,11 (3) pressure probes fabricated using cleanroom mi-crofabrication techniques such as photo lithography, etching, and bonding,9,17–19 and (4) pressure probes with a UV-cured polymer diaphragm covered on the end of a hollow glass tube or other type of spacer.13,20 For most of these sensors, the application prospect for rodent disc pressure measurements is limited by the complicated fabrication procedures, which are plagued by poor repeatability, brittle diaphragm materials, low-pressure sensitivity, and non-biocompatibility. In addition, none of these techniques can help realize batch fabrication of a number of sensor elements with uniform diaphragm thickness and sensor cavity length.
In this work, a miniature, biocompatible sensor with a low-coherence interferometry-based optical interrogation system is developed to facilitate the intradiscal pressure measurements of the rodent tail. The rest of the article is organized as follows. Section 2 describes the development of the overall sensor system, which includes the design, fabrication, and calibration of the pressure sensor element as well as the development of the optical interrogation subsystem. Section 3 presents the experimental studies on intradiscal pressure measurements conducted using the developed sensor system. Finally, concluding remarks appear in Section 4.
2. Development of the Sensor System
The overall sensor system consists of a pressure sensor element and an optical interrogation subsystem. The sensor element includes a diaphragm structure as the pressure transducer. When the sensor element is inserted into the rodent tail, the diaphragm deforms under the external pressure. The diaphragm deflection, which is a function of the pressure change, can be picked up by using the optical interrogation subsystem.
2.1 Sensor Design
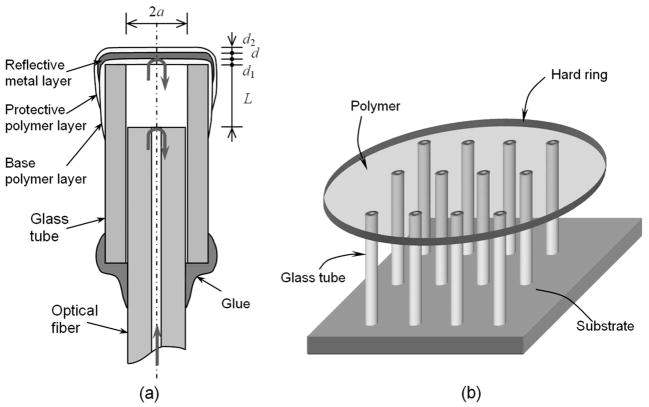
The cross-sectional view of the sensor element is illustrated in Fig. 2(a). It consists of a polymer-metal composite diaphragm, a single-mode fiber, and a glass tube. The composite diaphragm has a base polymer layer as a substrate for depositing a reflective metal layer, which increases the reflectivity. Another protective polymer layer is used to isolate the metal layer from the external environment to avoid oxidation, corrosion, and contamination. When a biocompatible polymer is chosen as the diaphragm material, the sensor element will become fully biocompatible. This is one of the unique features of this sensor design. The fiber has a well-cleaved end face, serving as a partial mirror of a Fabry–Pérot cavity; the reflective diaphragm serves as another mirror. The reflections from the fiber end face and the metal reflective layer interfere with each other at the fiber output. The diaphragm is held over an air cavity by using a glass tube, which serves as a sensor housing. The internal diameter of the glass tube is chosen to be slightly larger than the outer diameter of the fiber so that the fiber can easily fit in and then be fixed with an epoxy.
Fig. 2.
(a) Structure of the miniature fiber optic pressure sensor element that makes use of a polymer-metal composite diaphragm as a pressure transducer; (b) schematic of sensor fabrication.
The diaphragm can be modeled as an edge-clamped circular plate. The analytical solution for obtaining the deflection of the diaphragm center is well known. Since the Young’s modulus of a metal material (such as gold, aluminum, nickel/titanium, etc.) is usually greater than 100 GPa, much larger than that of a polymer (~0.1 GPa), the polymer-metal composite diaphragm can be considered as a metal diaphragm if the polymer layers (d1 and d2 in Fig. 2) are not too thick compared to the metal layer. Therefore, the deflection of the diaphragm center ΔL as a function of the applied pressure ΔP can be written as:11,12
| (1) |
where ν and E are the Poisson’s ratio and Young’s modulus of the metal material, respectively, a is the diaphragm radius, and d is the thickness, as indicated in Fig. 2(a).
Since there is no readily available prior knowledge on the measurement range needed for rodent disc pressures,7 the initial sensor design of the present work is targeted toward obtaining high-pressure sensitivity. Due to the unique multilayer design of the sensor, the sensor performance parameters such as sensitivity and dynamic range can be easily tailored. A coarse tuning of these parameters can be realized by changing the thickness of the metal layer, while a fine tuning can be achieved by having more thin-polymer layers. Here, coarse tuning means change by a great amount (e.g., 50%, four times, etc.) while fine tuning refers to a small adjustment (e.g., 1%, 5%, etc.). In this work, the diaphragm thickness is chosen to obtain a half-wavelength deflection of the diaphragm center when subjected to a pressure of 20 kPa. For a nickel diaphragm with E=207 GPa and ν =0.31, this means a pressure sensitivity of 0.019 μm/kPa at a wavelength of 780 nm. It is noted that the glass tube has an internal diameter of 150 μm (i.e., a=75 μm). Based on these parameters, it can be determined that the desired diaphragm thickness d is approximately 1.0 μm.
2.2 Sensor Fabrication
The fabrication procedures of the pressure sensor can be summarized as follows. First, multiple glass tubes (TSP150375 from Polymicro Technologies) of the same length are prepared with well-cleaved end faces. The preparation of the polymer layer is started by dispensing a drop of the polyimide (NOA68 from Norland Products) into the deionized water contained in a Petri dish with a 100-mm diameter. The polyimide floats over the water surface and spreads out to form a thin layer. The volume of polyimide is controlled to be 1 mm3 by using a digital dispenser. By observing the coloration of the polymer layer and controlling the spreading time, the layer thickness (~150 nm) can be controlled to be uniform over most of the area. By using this technique and controlling the dispensed volume of the polyimide, diaphragm thickness values ranging from 10 nm to several micrometers can be obtained without much difficulty. The polymer layer is then pre-cured by using ultraviolet (UV) light to form a strong enough layer, which can be lifted out of the water and used to cover the glass-tube ends. As a result, each glass-tube end is covered with a patch of the polymer layer [see Fig. 2(b)]. The polymer layer is then postcured by using UV light to ensure a firm attachment to the glass tube. This process allows for batch production of a number of sensors with good device-to-device uniformity.
Next, a thin layer of nickel/titanium is sputtered on top of the polymer layer using a DC magnetron sputtering machine, which is operated in a normal laboratory environment. The thickness of the sputtered layer is a function of sputtering time and distance from the target. This operation requires a sputtering time of 30 minutes for a 1-μm sputtered layer of nickel/titanium. As stated above, another polymer layer is then applied and cured on top of the nickel/titanium layer for protective purposes. The additional polymer layer can not only act as a protection layer to isolate the metal layer from the environment, but it can also help achieve a fine tuning of the sensor sensitivity. By controlling the thickness of the protective layer or by applying more layers, the stiffness of the polymer-metal composite diaphragm can be finely adjusted. As a result, the sensitivity of the sensor element can be adjusted to meet the requirements of different applications. In this sense, the sputtering condition determines the metal layer thickness and, in fact, acts as the coarse tuning of stiffness while the protective polymer layer functions as the fine tuning. This is a unique feature of this work.
Finally, to form a functional sensor element, a cleaved bare fiber is inserted into the glass tube by using an actuator-controlled linear translation stage (Zaber Technologies, model T-LA60). The fiber is threaded in and fixed with an epoxy when the fiber end is approximately 15 μm from the diaphragm (i.e., FP cavity length is 15 μm). This length allows for good visibility of the interference fringes and ample distance for the diaphragm to deform. The cavity length is actively monitored by using the optical interrogation subsystem discussed ahead.
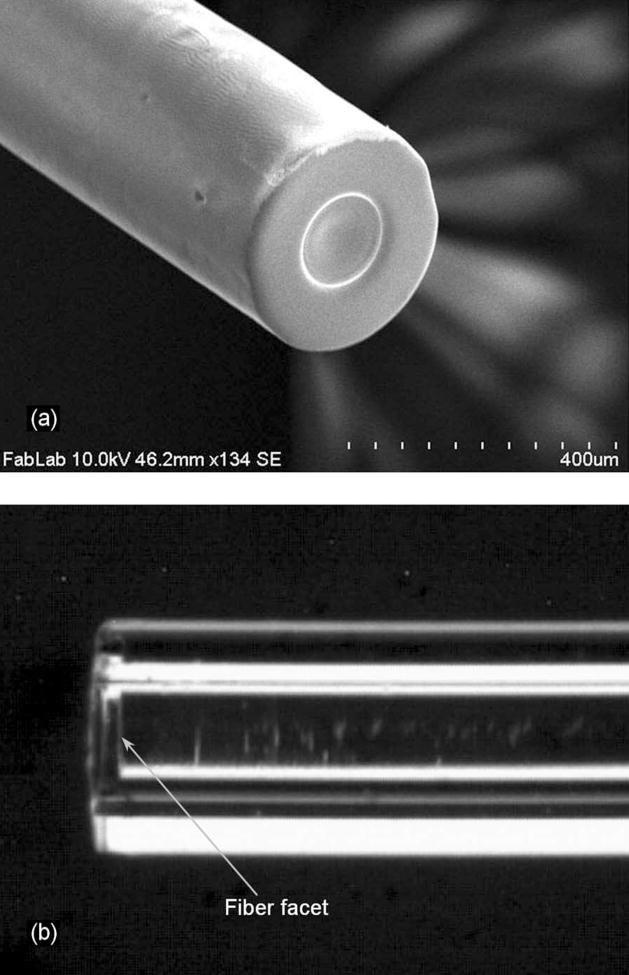
A scanning electron microscope (SEM) photograph of the sensor element is shown in Fig. 3(a) and an optical microscope picture of the optical cavity formed by the diaphragm (before the metal coating) and the fiber end facet is shown in Fig. 3(b). After fabrication, the sensor has an outer diameter of 366 μm, which can fulfill the requirement of the size being less than 400 μm for nondisruptive pressure measurements in rodent tail discs. To obtain an optimal operation condition, the initial cavity length is chosen to be 15.23 μm. The other end of the fiber forms a fiber lead-out for optical interrogation.
Fig. 3.
Fabricated pressure sensor. (a) Scanning electron micrograph of the sensor head; (b) photograph of the cavity in the sensor element (before coating the metal layer).
2.3 Optical Interrogation Subsystem
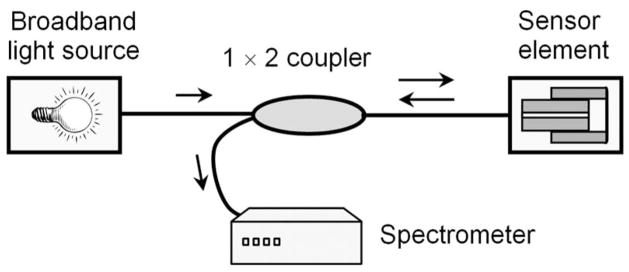
To measure the small deflections of the diaphragm, a low-coherence interferometric interrogation subsystem is employed, as illustrated in Fig. 4. It includes a broadband light source (HL 2000-HP tungsten halogen light source from Ocean Optics with a wavelength range of 360 nm–2 μm), a 1×2 fiber coupler (50/50), a Fabry–Pérot pressure sensor element, and a high-speed spectrometer (USB4000 from Ocean Optics). The light illuminated from the broadband source is guided by a fiber (SMF750 from Fibercore, design wavelength 780 nm) and delivered to the sensor element via the coupler. The reflected light is then transmitted through the coupler again to the spectrometer.
Fig. 4.
Fiber optic interrogation subsystem for rodent tail pressure measurement.
As the reflections from the fiber end facet and the diaphragm are quite weak (~4%), the sensor element can be considered to be a two-beam Fabry–Pérot interferometer. When a low-coherence light source is used, the spectrum of the reflected light will have interference fringes, with periodic peaks separated by the free spectral range (FSR). The cavity length L of the sensor element [refer to Fig. 2(a)] can be obtained as21
| (2) |
where λ1 and λ2 are any two adjacent peaks and FSR= |λ2 − λ1|. If the cavity length change |ΔL|≪L, the change of free spectral range ΔFSR can be expressed as
| (3) |
By combining Eqs. (1) and (3), the direct relationship between ΔFSR and ΔP can be obtained.
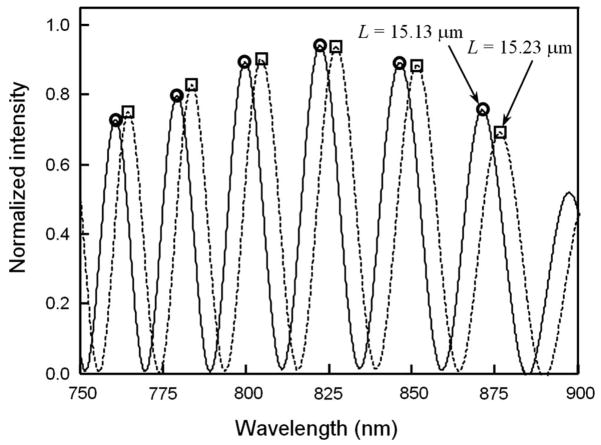
Equation (2) suggests a simple way to monitor the initial cavity length during the sensor fabrication through observation of the free spectral range of the reflected light. Fig. 5 shows two representative interference patterns for cavity lengths of 15.13 μm and 15.23 μm. The spectrometer allows for a spectral resolution of approximately 0.4 nm. Consequently, a cavity length resolution of 0.015 μm can be obtained. Here the resolution δL means the minimum detectable cavity change and is estimated by , where δ λ1 = δ λ2 =0.4 nm are the resolution of the spectrometer, and L≈15 μm, λ1 ≈ 0.80 μm, and λ2 ≈ 0.78 μm. For the pressure measurements, this cavity length resolution corresponds to a pressure resolution of approximately 0.77 kPa. Following the design in Section 2.1, the sensitivity of the sensor element is taken as 0.019 μm/kPa By averaging over several pairs of adjacent peaks with good visibility in the interference spectrum, the pressure resolution can be further improved.
Fig. 5.
Interference patterns at two different cavity lengths when the initial cavity length is actively monitored in the assembly of the fiber with the diaphragm-covered glass tube.
2.4 Sensor Calibration
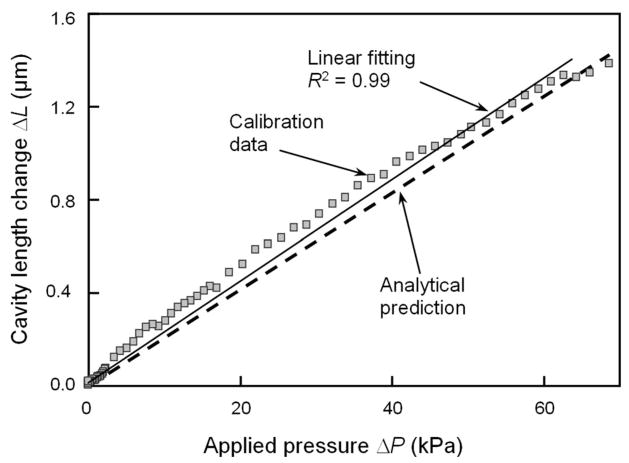
Sensor calibration was conducted in a pressure chamber with a reference pressure sensor ( Kulite Semiconductor Products, model LL-080-25A) to quantify the changes in cavity length with respect to pressure. The calibration was limited to pressures under 70 kPa due to the range of the pressure chamber. The results obtained from the calibration experiment are compared with the analytical predictions based on Eqs. (1) and (3) in Fig. 6. When the pressure is increased from zero to a small value, the sensor element exhibits an immediate response without any noticeable dead zone. This indicates that the sensor element works well in the low-pressure region. When the pressure is above 60 kPa, the cavity length change tends to saturate. The calibration data show a good linearity with the R2 value of 0.99. Based on the slope of the linear fitting curve, the sensitivity of the sensor element is determined to be 0.0206 μm/kPa, which is slightly larger than the designed value of 0.0190 μm/kPa. Based on the experimental results, the minimum detectable pressure (i.e., the pressure resolution) is found to be less than 0.17 kPa. As a result of averaging, this resolution is found to be better than that predicted by the analysis. It is noted that the actual cavity length is shortened under pressure. For simplicity, the cavity length change presented in Fig. 6 and the associated sensitivity are expressed in absolute values. As the sensing diaphragm consists of polymer and metal layers, it may experience slight drift upon the change of environmental temperature. However, it is not a serious issue, as the experiment will be conducted in a controlled environment. For other applications that are subject to temperature variation, such drift can be calibrated in advance or be eliminated by using another dummy sensing element (subject to the temperature change but not the pressure change) for differentiation.
Fig. 6.
Absolute value of the cavity length change versus external pressure for the fabricated sensor element. The pressure is measured by a reference sensor. The analytical prediction is also shown for comparison.
3. Experimental Study of Intradiscal Pressure in Rodent Tail
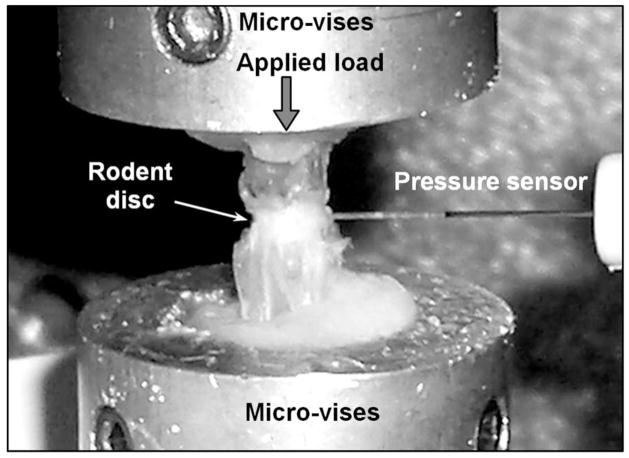
After calibration, the sensor was utilized for in vitro intervertebral discal pressure measurements, with the aim of quantitatively determining the intradiscal pressures generated by externally applied loads. The experimental arrangement is shown in Fig. 7. For the in-tail experiments, a segment containing the rodent disc of interest is mounted onto an Enduratec material testing system through the micro-vises; the two vertebrae surrounding the disc are fixed onto the micro-vises by using bone cement. User-specified compressive loads or displacements are applied externally using a Bose loading mechanism to generate pressures within the rodent tail disc. The loading and displacement data are recorded using a data acquisition card (DAQ) connected to a computer. To create a hole for the sensor to be inserted, a 22-gauge hypodermic needle was used to puncture the disc to the center depth. The needle was then withdrawn and the sensor was positioned at the exact location of the hole and inserted into the center depth by using a three-dimensional translation stage.
Fig. 7.
Experimental setup for the in vitro disc pressure measurements. The fiber optic sensor is inserted into the center of the rodent tail disc.
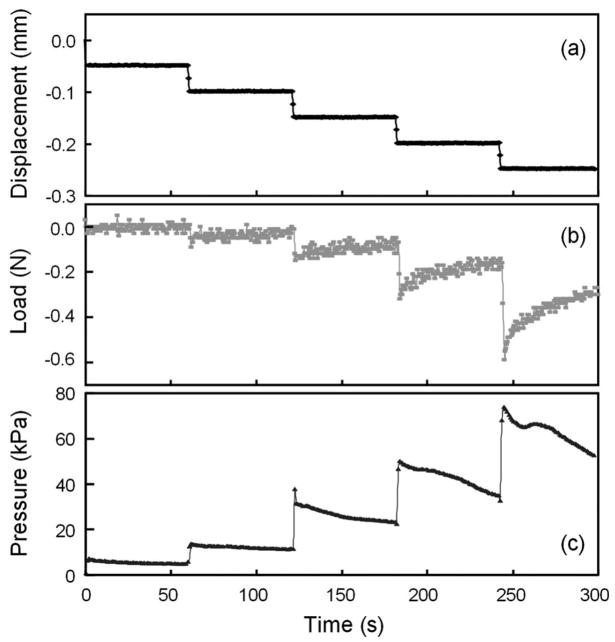
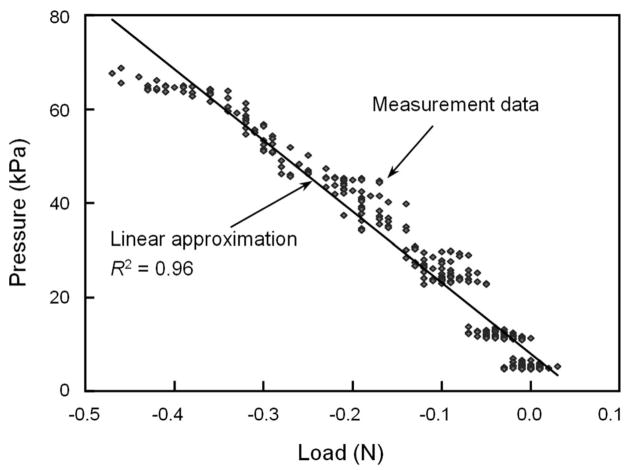
The measurement results are shown in Fig. 8. The experiment was a closed-loop, displacement-controlled test in which a constant compressive displacement was applied to the tail segment every 50 seconds, as shown in Fig. 8(a). The displacement step is 0.05 mm and each step was held for the entire period of 50 seconds before applying additional compression. The change of the load is shown in Fig. 8(b). After each step of displacement increase, the absolute amount of load was increased immediately, but it was then gradually relaxed with the lapse of time. This is due to the visco-elastic property of the intervertebral disc.7 The corresponding pressure measured by the sensor element is shown in Fig. 8(c). The sensor responded instantaneously to each step increase of the displacement, and relaxed gradually due to the reduction of the load. It is worth noting that the sensor signal shown in Fig. 8(c) has much smaller noise compared to the load signal in Fig. 8(b) obtained from the material testing system. In the first several compression steps, the load magnitudes were so small that the signal was overwhelmed by the noise, while the pressure sensor still showed a clean response with much less noise. The visibility of the interference patterns was also exceptional, with low standard deviations throughout the entire test. The relationship between the recorded load and the measured pressure is plotted in Fig. 9. Although the data points are quite scattered, especially in the low load range, the intra-discal pressure in the nucleus is almost linearly proportional to the externally applied load over the observed pressure range of 70 kPa. Regression analyses yielded a pressure-to-compressive load relationship of 151 kPa/N, with an R2 value of 0.96. This linearity agrees with some previous observations in the intradiscal measurements of pigs and humans.6,22–24
Fig. 8.
Measurement results of in vitro disc pressure experiments. (a) Applied stepwise increase of the displacement; (b) intervertebral disc load recorded by the material testing system; (c) pressure response measured by the sensor developed in this work.
Fig. 9.
Relationship between the recorded load and the measured pressure in in vitro disc pressure experiments.
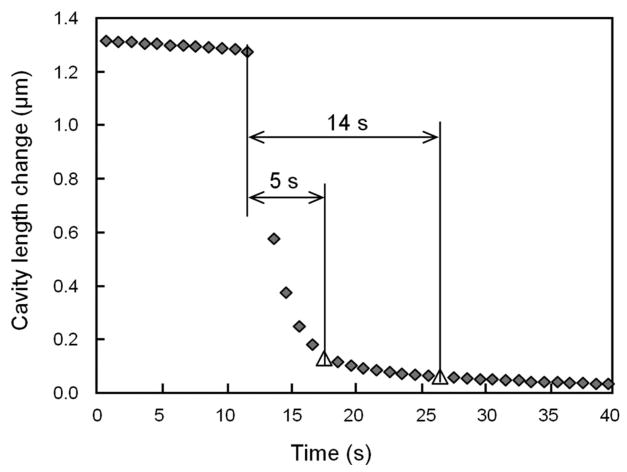
As the sensor diaphragm had two polymer layers, the creeping behavior of the polymer, which has been observed in earlier work,6 was also investigated. To determine whether the creeping effect contributed to the data scatter seen in Fig. 9 and affected the fidelity of the measured pressure values, an experimental study of the diaphragm creeping was carried out. In the experiments, the sensor element was subjected to a step-down pressure signal and its response was measured. An initial pressure of approximately 70 kPa was held constant for about a minute and then released suddenly. The time history of the cavity length change was measured, as shown in Fig. 10. From the time of release, it took 5 seconds for the cavity length to reach within a 10% range of the expected cavity length in atmospheric pressure, and 14 seconds to reach 5%. This does not account for the time it took for the pressure to return to the atmospheric pressure after release, which is expected to be less than a few seconds. These results verify that the sensor does exhibit some creeping behavior; however, the magnitudes are insignificant and can be neglected. The low creeping could be attributed to the fact that the diaphragm is mainly composed of the sputtered metal layer (~1 μ m), while the total thickness of the base and protective polymer layers is only about 300 nm, which cannot greatly affect the overall mechanical properties of the diaphragm. The low creeping effect of the sensor element suggests that the data scattering of Fig. 9 is likely due to the low accuracy of the recorded load values. It also proves that the recorded visco-elastic behavior of the disc in Fig. 8(c) was due to the intra-discal pressure and not due to the creeping of the sensor diaphragm.
Fig. 10.
Creeping study of the sensor element by measuring the dynamic change of the cavity length in response to a drastic pressure drop.
4. Concluding Remarks
We demonstrated intradiscal pressure measurements using a sensor system consisting of a miniature fiber optic pressure sensor element and a low-coherence interrogation subsystem. The use of low-coherence interferometry can help eliminate the influence of the environmental noise due to power fluctuation and wavelength instability. The sensor element utilizes a polymer-metal composite diaphragm fabricated on top of a glass capillary tube and a normally cleaved optical fiber to form a Fabry–Pérot interferometer. The final diameter is approximately 366 μ m, which is below the limit of 400 μ m needed for nondisruptive insertion into the rodent tail discs. Sensor calibration and in vitro experiments show that the sensor element has a linear response over a pressure range of 0–70 kPa, with a sensitivity of 0.0206 μm/kPa, close to the designed value of 0.019 μm/kPa. The pressure resolution is found to be better than 0.17 kPa.
The sensor design and fabrication possesses many novel aspects in comparison to the previous machining and micro-machining methods.9–20 First, multiple sensors can be fabricated simultaneously and have identical diaphragm thickness and cavity length, and thus the fabrication technique allows for batch production of sensors that yields good device-to-device uniformity. Second, the fabrication follows simple processes, safe procedures, and cheap materials, without the need for a cleanroom environment. Third, the multilayer design of the sensor diaphragm allows for appropriate tuning of the sensor performance parameters (i.e., sensitivity and dynamic range) and enhanced durability of the sensor. Finally, the bio-compatibility and miniature size of the sensor element make it attractive for biomedical diagnosis and treatment that require minimal invasive monitoring of the pressures of blood, joints, bladders, and so on.
In terms of mechanobiological studies, this sensor can not only provide a tool for directly linking transient pressure effects with cellular response, but it can also enable comparisons of load-induced pressure changes in rodents with those measured in humans. Verifying the relevance of these intra-discal pressure–external load relationships in rats would lend further support to the appropriateness of rodent tail disc loading models for studying the mechanisms of disc degeneration. In addition, the small size and biocompatibility of the sensor element can also facilitate many other biomedical diagnosis and treatment applications that have to deal with constrained spaces and require minimal invasive monitoring of the pressures.
Acknowledgments
This work has been supported partially by the National Institutes of Health (NIH) Grant no. 1R03AR054051. The authors are grateful to Dave Ryan, Adam Gabai, Alvin Yew, and Hyunchul Kim of the Department of Bioengineering at the University of Maryland for their assistance in various experiments.
References
- 1.Edwards WT, Ordway NR, Zheng Y, McCullen G, Han Z, Yuan HA. Peak stresses observed in the posterior lateral annulus. Spine. 2001;26(16):1753–1759. doi: 10.1097/00007632-200108150-00005. [DOI] [PubMed] [Google Scholar]
- 2.Wilke H, Neef P, Hinz B, Seidel H, Claes L. Intradiscal pressure together with anthropometric data—a data set for the validation of models. Clin Biomech. 2001;16(Suppl 1):S111–126. doi: 10.1016/s0268-0033(00)00103-0. [DOI] [PubMed] [Google Scholar]
- 3.Lotz JC, Colliou OK, Chin JR, Duncan NA, Liebenberg E. Compression-induced degeneration of the intervertebral disc: An in vivo mouse model and finite-element study. Spine. 1998;23(23):2493–2506. doi: 10.1097/00007632-199812010-00004. [DOI] [PubMed] [Google Scholar]
- 4.Polga DJ, Beaubien BP, Kallemeier PM, Schellhas KP, Lew WD, Buttermann GR, Wood KB. Measurement of in vivo intradiscal pressure in healthy thoracic intervertebral discs. Spine. 2004;29(12):1320–1324. doi: 10.1097/01.brs.0000127179.13271.78. [DOI] [PubMed] [Google Scholar]
- 5.Guehring T, Unglaub F, Lorenz H, Omlor G, Wilke HJ, Kroeber MW. Intradiscal pressure measurements in normal discs, compressed discs and compressed discs treated with axial posterior disc distraction: An experimental study on the rabbit lumbar spine model. Eur Spine J. 2005;15(5):597–604. doi: 10.1007/s00586-005-0953-z. [DOI] [PMC free article] [PubMed] [Google Scholar]
- 6.Ekstrom L, Holm S, Holm AK, Hansson T. In vivo porcine intradiscal pressure as a function of external loading. J Spinal Disorders Techniq. 2004;17(4):312–316. doi: 10.1097/01.bsd.0000092068.78152.00. [DOI] [PubMed] [Google Scholar]
- 7.Ryan DA, Hsieh AH. Viscoelastic behavior of the disc following annular puncture. Amer Soc Biomech Ann Meeting. 2006 paper no. 179. [Google Scholar]
- 8.Yu M, Balachandran B. Acoustic measurements using a fiber optic sensor system. J Intell Mater Syst Struct. 2003;14(7):409–414. [Google Scholar]
- 9.Totsu K, Haga Y, Esashi M. Ultra-miniature fiber-optic pressure sensor using white light interferometry. J Micromech Microeng. 2005;15(1):71–75. [Google Scholar]
- 10.Wang X, Xu J, Zhu Y, Yu B, Han M, Cooper K, Pickrell G, Wang A. An optical fiber tip pressure sensor for medical applications. Quant Electron Laser Sci Conf. 2005;2:916–918. [Google Scholar]
- 11.Wang X, Xu J, Zhu Y, Cooper KL, Wang A. An all fused silica miniature optical fiber tip pressure sensor. Opt Lett. 2006;31(7):885–887. doi: 10.1364/ol.31.000885. [DOI] [PubMed] [Google Scholar]
- 12.MacPherson WN, Kilpatrick JM, Barton JS, Jones JD. Miniature fiber optic pressure sensors for turbomachinery applications. Rev Sci Instrum. 1999;70(3):1868–1874. [Google Scholar]
- 13.Olson ES. Observing middle and inner ear mechanics with novel intracoclear pressure sensors. J Acoust Soc Am. 1998;103(6):3445–3463. doi: 10.1121/1.423083. [DOI] [PubMed] [Google Scholar]
- 14.Watson S, Gander MJ, MacPherson WN, Barton JS, Jones JDC, Klotzbuecher T, Braune T, Ott J, Schmitz F. Laser-machined fibers as Fabry–Pérot pressure sensors. Appl Opt. 2006;45(22):5590–5596. doi: 10.1364/ao.45.005590. [DOI] [PubMed] [Google Scholar]
- 15.C. Belleville, S. Buissier, and R. Van Neste, Fiber optic pressure sensor for catheter use, U.S. Patent Application No. 2006/0133715 (2006).
- 16.Cibula E, Đonlagić D. Miniature fiber-optic pressure sensor with a polymer diaphragm. Appl Opt. 2005;44(14):2736–2744. doi: 10.1364/ao.44.002736. [DOI] [PubMed] [Google Scholar]
- 17.Abeysinghe DC, Dasgupta S, Jackson HE, Boyd JT. Novel MEMS pressure and temperature sensors fabricated on optical fibers. J Micromech Microeng. 2002;12(3):229–235. [Google Scholar]
- 18.Abeysinghe DC, Dasgupta S, Boyd JT, Jackson HE. A novel MEMS pressure sensor fabricated on an optical fiber. IEEE Photonics Technol Lett. 2001;13(9):993–995. [Google Scholar]
- 19.Hill GC, Melamud R, Declercq FE, Davenport AA, Chan IH, Hartwell PG, Pruitt BL. SU-8 MEMS Fabry–Pérot pressure sensor. Sens Actuators, A. 2007;138(1):52–62. [Google Scholar]
- 20.D. W. Sherrer, D. E. Leber, and D. A. Steinbeig, Micromachined, etalon-based optical fiber pressure sensor, U.S. Patent Application No. 2002/0003917 (2002).
- 21.Grattan KTV, Meggitt BT. Optical Fiber Sensor Technology. Chapman & Hall; London: 1995. [Google Scholar]
- 22.Nachemson A. The load on lumbar disks in different positions of the body. Clin Orthop Relat Res. 1966;45:107–122. [PubMed] [Google Scholar]
- 23.Rolander SD. Motion of the lumbar spine with special reference to the stabilizing effect of posterior fusion. Acta Orthop Scand Suppl. 1966;90(Suppl):1–144. doi: 10.3109/ort.1966.37.suppl-90.01. [DOI] [PubMed] [Google Scholar]
- 24.Ranu HS. Measurement of pressures in the nucleus and within the annulus of the human spinal disc due to extreme loading. Proc Instr Mech Eng. 1990;204:141–146. doi: 10.1243/PIME_PROC_1990_204_248_02. [DOI] [PubMed] [Google Scholar]


