Abstract
This paper discusses the problems of defining and measuring late-fetal mortality (stillbirths). It uses evidence from 11 developed countries to trace long-term trends in fetal mortality. Issues associated with varying definitions and registration practices are identified, as well as the range of possible rates, key turning points and recent convergence. The implications for developing countries are spelt out. They emphasize the possible limitations of WHO estimation methods and survey-based data by examining the cross-sectional associations among 187 countries in the year 2000. The important role of skilled birth attendants is emphasized in both data sets, but the different effects on maternal mortality and late-fetal mortality are also noted.
Résumé
Le présent article examine les problèmes liés à la définition et à la mesure de la mortalité fœtale tardive (mortinatalité). Il utilise des données provenant de 11 pays développés pour suivre les tendances à long terme de la mortalité fœtale. Il identifie les problèmes liés à des définitions et à des pratiques d’enregistrement variables, la plage de variation du taux de mortalité, ainsi que ses principaux points d’inflexion et sa convergence récente. Il expose également les implications pour les pays en développement. Il met l’accent sur les limites potentielles des méthodes d’estimation de l’OMS et des données d’enquête en examinant les associations transversales entre 187 pays au cours de l’année 2000. Les deux jeux de données font ressortir le rôle important de la présence de personnel qualifié pour assister les accouchements, mais également les effets différents de cette présence sur la mortalité maternelle et fœtale tardive.
Resumen
Se analizan en este artículo los problemas asociados a la definición y medición de la mortalidad fetal tardía (mortinatalidad). A partir de la evidencia obtenida en 11 países desarrollados se perfilan las tendencias a largo plazo de la mortalidad fetal. Se abordan algunas cuestiones relacionadas con las diversas definiciones y prácticas de registro, así como el margen de posibles valores de las tasas, algunos puntos de inflexión clave y la reciente convergencia de los datos. Se explican las implicaciones para los países en desarrollo, y se destacan las posibles limitaciones de los métodos de estimación de la OMS y los datos encuestales examinando las relaciones transversales entre 187 países en el año 2000. Se hace hincapié en el importante papel de las parteras cualificadas en los dos conjuntos de datos, pero se señalan también los diferentes efectos en la mortalidad materna y en la mortalidad fetal tardía.
ملخص
تناقش ەذە الورقة المشكلات المتعلقة بتعريف وقياس وفيات الأجنة المتأخرة (الإملاص). وتستخدم الورقة بيِّنات جُمعت من 11 بلداً متقدِّماً بەدف تتبُّع الاتجاەات الطويلة الأجل في وفيات الأجنة. ويتم في الورقة تحديد القضايا المرتبطة بتفاوت التعريفات وممارسات التسجيل، إضافةً إلى تحديد مدى المعدلات الممكنة، ونقاط التحوُّل الرئيسية، والتقارب الذي حدث مؤخرا. كما توضِّح الورقة آثار ذلك على البلدان النامية. وتركِّز ەذە الآثار على أوجە القصور الممكنة في أساليب التقدير التي تستخدمەا منظمة الصحة العالمية، وفي المعطيات (البيانات) المرتكزة على المسح، وذلك عن طريق دراسة علاقات الارتباط بين القطاعات المختلفة في 187 بلداً في عام 2000. وتؤكد الورقة على أەمية دور المولدات الماەرات في كلتا المجموعتين من المعطيات، مع الإشارة كذلك إلى مختلف التأثيرات على وفيات الأمومة وعلى وفيات الأجنة المتأخرة.
Introduction
Historical trends in late-fetal mortality in developed countries may have important implications for both the current level and future trends in developing countries. In developing countries, the reduction of child mortality remains one of the chief objectives for public health programmes, but little attention is given to fetal mortality.1,2 In many developed countries, while absolute rates have never been lower, late-fetal mortality is now higher than infant mortality. Perinatal deaths are the principal subject of concern among obstetricians and paediatricians. The causes of antepartum stillbirths and the survival of preterm live births represent two important areas for research and policy initiatives. The reduction of intrapartum stillbirths to 10% or less of all late-fetal deaths is credited to the availability of effective birth attendants supported by skilled obstetricians, advanced medical technology and specialized institutional facilities. How did the developed countries reach this fortunate, although still challenging, position and what are the implications for developing countries where early-age mortality remains high and fetal health is not yet a priority?
This question has several complicated aspects. The definitions of miscarriage, abortion (induced, unsafe and natural), stillbirth or late-fetal death, viability and live birth are particularly complicated, socially as well as biologically constructed, and subject to variation.3 This variability will affect the prospects for accurate recording in registration systems, community and hospital surveys, together with those for measurement and comparison. Since the immediate causes of fetal deaths may be difficult to identify, even with the aid of postmortem examinations, the ultimate causes (e.g. maternal physique, infection, poor midwifery) are also likely to be difficult to identify.
Data problems: developed countries
European countries have adopted a variety of different practices for stillbirth and live birth registration, and this limits the comparative value of perinatal mortality as an index of health care.4 Also, in countries where legal abortion is used as a form of birth control, the registration of stillbirths, live births and neonatal deaths has a different meaning from those countries where abortion is uncommon or illegal.5 It has also been common practice in several countries (e.g. Belgium, France, Spain) to register as live births only those infants who survived for a specified period beyond birth. Those who did not survive were placed in a category often known as “false stillbirths” or they were completely ignored for registration purposes. Despite these problems, and there are others, there is a long and remarkably rich history of attempts to register late-fetal deaths in many developed countries. Indeed, the very commitment to registration signifies an appreciation of the importance of perinatal health and the need to monitor progress.6
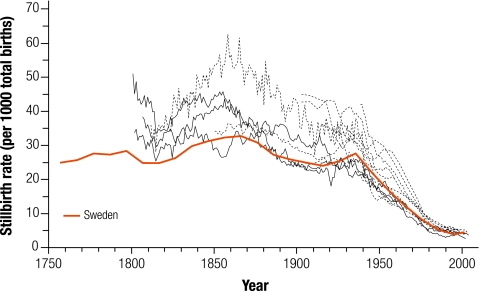
Fig. 1 draws on registration data from 11 countries to illustrate the course of late-fetal mortality over the longest period of time possible. It shows time-series for the stillbirth rate (SBR), i.e. registered stillbirths per 1000 total births (stillbirths plus live births). Usually, the terms stillbirth, late-fetal death and dead born can be regarded as synonymous since they relate to the birth of a fetus of more than 28 weeks gestation showing no vital signs, but this is not always the case. The 11 countries can be divided into three groups determined by the length of the registration period and the sorts of problems to which the resulting data are exposed. In the first group we have Denmark, Iceland, Norway and Sweden with registration dating from at least the early years of the 19th century (1750s in Sweden shown in Fig. 1 as a solid line for decades), a reputation for high quality (especially from the 1870s) and a commitment to state support for midwifery services. Fig. 1 shows the SBR series for these countries as solid lines and highlights the case of Sweden. In the second group come France, Italy, the Netherlands, and Spain. Here stillbirth registration began in the 19th or early 20th century, but was affected in its early decades by the problem of “false stillbirths”. The registered number of stillbirths may need to be revised downwards while live births and neonatal deaths should be corrected upwards. This has been done for the Netherlands, but not the other countries in the group, which are only shown from 1900 onwards. The third group contains England and Scotland (from 1939), Wales (from 1927) and the United States of America (USA). In the USA, the legal definition of fetal death varies between states. A consistent national series for late-fetal mortality is only available from the 1940s, and there are considerable regional and social variations.7,8 Fig. 1 also shows a small number of regional examples. The Zeeland province of the Netherlands has a particularly well developed local demographic database, which allows SBRs to be derived from the early 19th century. Zeeland is the highest series illustrated in Fig. 1.
Fig. 1.
Long-term trends in late-fetal mortality in 11 developed countries
Setting aside the various problems of definition and registration, Fig. 1 does suggest some broad, general points. First, the pattern traced by the time-series can be described in terms of “an undulating high plateau succeeded after a common turning point by sustained decline and convergence”. The undulating plateau phase has SBRs ranged from 25 to 45 per 1000 total births, and up to 60 in particular circumstances. The turning point occurred in the late 1930s or the 1940s when the SBR was still 25 to 45. Convergence in the early 21st century was in the 3–5 range. Second, among the first group of countries, plus the Netherlands, the SBR did decline between 1860 and 1900, although it also appears to have increased from 1810 to 1850 in these same cases. The reasons for this wave-like trend need to be established, but it seems likely that the early increase was mainly due to improvements in registration coverage while the subsequent late-19th century decline was associated with improvements in the quality of birth attendants and their ability to use antisepsis measures.9–11 If this is so, it indicates that general access to skilled midwives and obstetricians could reduce the SBR to 25 even before those key advances of the 1930s and 1940s, which were associated with the availability of new drugs for the control of infections. Third, other demographic series for developed countries are known to have followed the “plateau-decline-convergence” sequence, although only maternal mortality had a roughly coincidental turning point in the 1930s or 1940s.12
Estimates: developing countries
WHO developed estimates of late-fetal and neonatal mortality for its member countries in the year 2000, as well as gender-specific life tables.13,14 SBRs have been derived without correction from registration or survey data, where they are available. Where they are not, SBRs have been estimated from early-neonatal mortality rates, which are found from neonatal mortality rates by using SBR to early-neonatal mortality rates ratios specific to each mortality stratum. WHO uses five mortality strata (A-E) to distinguish different levels of child and adult mortality (A: very low child and adult mortality; B: low child and adult mortality; C: low child and high adult mortality; D: high child and adult mortality; E: high child and very high adult mortality).
These estimates are summarized in Table 1 for the 14 WHO subregions and in Table 2 for a small number of selected countries. Table 1 shows SBRs, neonatal mortality rates, infant mortality rates and early-childhood mortality rates (ages 1–4) ranked by life expectancy at birth in years [e(0)]. In all cases the estimates for males and females have been combined. The three developed subregions (all low mortality A strata from Europe, North America and the Western Pacific) are placed together. Table 1 illustrates some important points by combining the SBR, infant mortality rate and early-childhood mortality rate with overall mortality via life expectancy at birth. The high level of adult mortality in the subregion Africa (mortality strata E) means that e(0) is much reduced compared with Africa (mortality strata D), despite similar levels of early-age mortality. South East Asia (mortality strata D) and Eastern Mediterranean (mortality strata D) fall close together and separate from the other seven developing subregions where the SBR is 20 or less and e(0) more than 65 years.
Table 1. WHO mortality estimates for subregions,a in 2000.
| Subregion and mortality stratab,c | Stillbirth rate | Neonatal mortality rate | Infant mortality rate | Early-childhood mortality rate | e(0) |
|---|---|---|---|---|---|
| Africa E (20) | 30 | 42 | 116 | 55 | 44.4 |
| Africa D (26) | 39 | 45 | 118 | 48 | 51.4 |
| Eastern Mediterranean D (9) | 24 | 46 | 94 | 29 | 60.0 |
| South-East Asia D (7) | 36 | 41 | 63 | 34 | 61.1 |
| Americas D (6) | 12 | 20 | 42 | 19 | 66.0 |
| Europe C (9) | 20 | 12 | 19 | 5 | 66.2 |
| South-East Asia B (3) | 15 | 17 | 39 | 11 | 66.5 |
| Europe B (17) | 17 | 21 | 35 | 11 | 68.9 |
| Eastern Mediterranean B (12) | 13 | 16 | 31 | 6 | 70.1 |
| Western Pacific B (21) | 19 | 20 | 32 | 11 | 70.5 |
| Americas B (26) | 9 | 14 | 27 | 7 | 71.0 |
| Americas A (3) | 4 | 5 | 7 | 1 | 76.9 |
| Europe A (23) | 4 | 3 | 5 | 1 | 78.0 |
| Western Pacific A (5) | 5 | 2 | 4 | 1 | 80.8 |
e(0), life expectancy at birth in years. a The total number of countries in this analysis was 187. b The letters A–E are applied to distinguish mortality strata and create subregions. A: very low child and adult mortality; B: low child and adult mortality; C: low child and high adult mortality; D: high child and adult mortality; E: high child and very high adult mortality. c The values in parentheses are the number of countries. Sources: Table A2.1,13 and Lopez et al.14
Table 2. WHO mortality estimates for selected countries, year 2000.
| Countrya | % skilled attendantsb | Maternal mortality rate (per 10 000 births) | Stillbirth rate | Neonatal mortality rates | Infant mortality rate | Early-childhood mortality rate | e(0) |
|---|---|---|---|---|---|---|---|
| Malawi (Africa E) | 60.5 | 180.0 | 13 | 40 | 154 | 78 | 37.5 |
| Nigeria (Africa D) | 35.2 | 80.0 | 48 | 53 | 114 | 46 | 50.6 |
| Egypt (Eastern Mediterranean D) | 69.4 | 8.4 | 10 | 21 | 63 | 34 | 61.3 |
| India (South-East Asia D) | 42.5 | 54.0 | 39 | 43 | 63 | 34 | 61.3 |
| China (Western Pacific B) | 82.8 | 5.6 | 19 | 21 | 32 | 9 | 71.0 |
| USA (Americas A) | 99.0 | 1.7 | 4 | 5 | 7 | 1 | 76.7 |
| Italy (Europe A) | n/a | 0.5 | 3 | 3 | 6 | 1 | 79.2 |
| Japan (Western Pacific A) | 100.0 | 1.0 | 5 | 2 | 4 | 1 | 81.0 |
Table 2 selects eight countries to represent the four subregions with the lowest e(0)s in the year 2000, three countries with the highest and one (China) to represent the seven subregions with intermediate levels of e(0) (66–71 years). Table 2 also gives the estimated maternal mortality rate (MMR, maternal deaths per 10 000 live births) and the percentage of births having a skilled attendant present (for various years around the year 2000).15,16
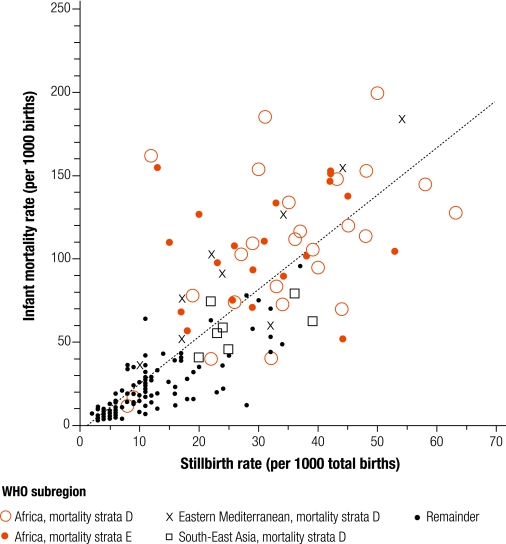
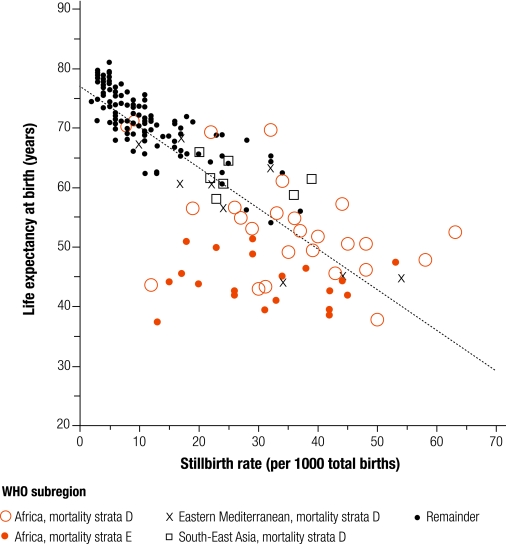
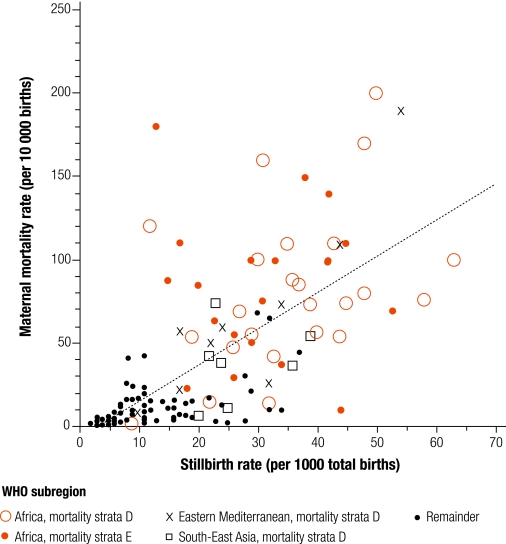
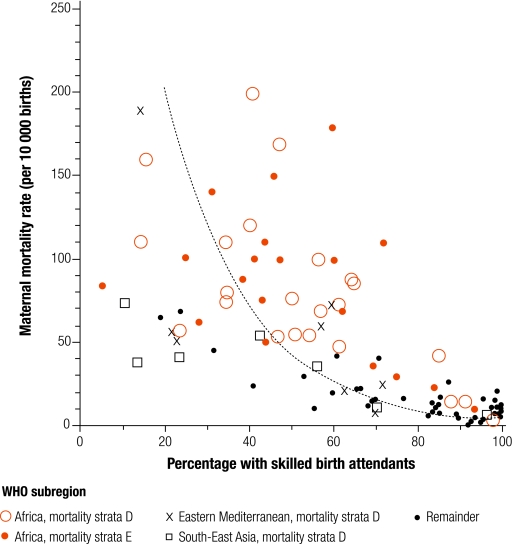
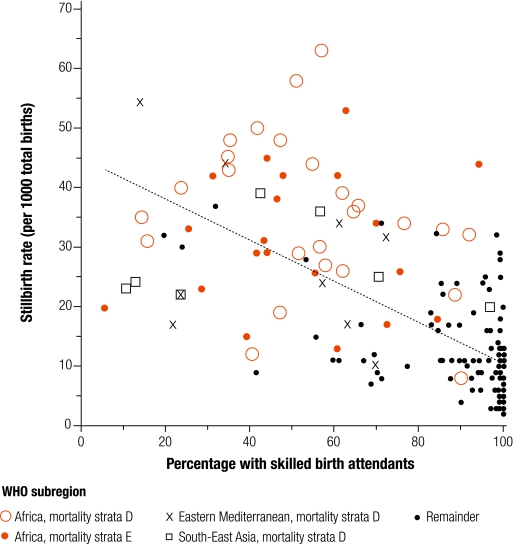
The estimates presented in Table 1 and Table 2 help to place late-fetal mortality in a wider context, to illustrate contemporary global variations and to raise questions concerning reliability. However, it is also likely that the WHO subregions are far from homogeneous in terms of early-age mortality. The remaining figures focus on four of the WHO subregions in Table 1: Africa mortality strata D and E ; Eastern Mediterranean D; and South-East Asia D. Fig. 2 shows the relationship between infant mortality rate and SBR among the countries making up the four subregions, while Fig. 3 relates life expectancy to SBR and Fig. 4 shows MMR with SBR. The maximum number of countries in observation is 187. In each case, the regression line has been fitted to all available observations (Table 3).
Fig. 2.
Association between infant mortality and late-fetal mortality, in 2000
Fig. 3.
Association between life expectancy at birth and late-fetal mortality, in 2000
Fig. 4.
Association between maternal mortality and late-fetal mortality, in 2000
Table 3. Associations between mortality rates.
| Association | α | β | r | R²% | n |
|---|---|---|---|---|---|
| Fig. 2 IMR/SBR | -3.2315 | 2.8385 | 0.8253 | 68.12 | 187 |
| Fig. 3e(0)/SBR | 77.1610 | -0.6850 | -0.8180 | 66.09 | 187 |
| Fig. 4 MMR/SBR | -7.8799 | 2.1842 | 0.7161 | 51.28 | 172 |
| Fig. 5 MMR/attendantsa | 127.4733 | -1.2429 | -0.7791 | 60.70 | 172 |
| Fig. 6 SBR/attendants | 45.0857 | -0.3464 | -0.6670 | 44.49 | 187 |
e(0), life expectancy at birth in years; IMR, infant mortality rate; MMR, maternal mortality rate per 10 000 live births; SBR, stillbirth rate. a A better fit (R² = 66.06%) is given by the exponential relationship: y = 549.6446 * 10–0.0223x which is illustrated in Fig. 5.
Fig. 2, Fig. 3 and Fig. 4 demonstrate the variability among countries in the four subregions with the lowest life expectancies, but also suggest some irregularities that may be due to the estimation procedures adopted. For example, the nine countries in Eastern Mediterranean D (Afghanistan, Djibouti, Egypt, Iraq, Morocco, Pakistan, Somalia, Sudan and Yemen) appear to cover virtually the full range of mortality experience. There is no coherence in terms of shared position. The 20 countries in the WHO subregion of Africa E do have particularly low life expectancies in common, but they do not share a similar experience in terms of late-fetal mortality. Several historical studies have identified a strong association between MMR and SBR, yet Fig. 4 shows many extreme residuals about a broad positive correlation (Table 3).
The argument linking the reduction in MMR with improvements in the quality and availability of skilled birth attendants is universally accepted.17 It is paralleled, as we have seen, by historical arguments that link the decline of both MMR and SBR with the availability of skilled attendants. However, Fig. 5 and Fig. 6 demonstrate that the matter is not so simple when countries are compared. Fig. 5 relates MMR to the percentage of births with a skilled attendant, while Fig. 6 uses SBR as the dependent variable. It is clear that in countries where access to skilled birth attendants is universal (at least above 85%) then MMR will be negligible; there are no counter-examples. But there are examples of countries that appear to have low levels of MMR and only a minority of births are delivered by skilled attendants. There are also countries with high levels of birth attendants that have non-negligible SBR. Since only intrapartum stillbirths will be sensitive to the quality of birth attendants and many late-fetal deaths are antepartum, caused by maternal infections and nutrition, it might be hypothesized that SBRs will have a weaker association (Table 3).18,19 Fig. 5 shows so much diversity among the four low life expectancy subregions that, without the support of both logic and substantial amounts of other empirical evidence, it would be difficult to sustain claims for the critical role of skilled attendants in SBR.
Fig. 5.
Association between maternal mortality and percentage of births with skilled birth attendants, in 2000
Fig. 6.
Association between late-fetal mortality and percentage of births with skilled birth attendants, in 2000
Comparisons: time and space, change and variation
Fig. 1 suggests that, before skilled birth attendants became widespread and effective, late-fetal mortality among European countries varied from 25 to perhaps 60 per 1000 births. Fig. 6 shows that in the early 21st century there are still many developing countries (India and Nigeria included) with late-fetal mortality in this range and a minority of births being delivered by skilled attendants. Less than 1 in 250 viable fetuses die before live birth, less than 1 in 10 000 mothers die from childbirth-related causes and life expectancy at birth is at least 80 years in the most favourable circumstances. In the worst conditions the equivalent figures are 15 fetuses, 200 mothers and 40 years; about what they were among Europeans before 1850. Although these comparisons provide salutary reminders, they highlight what has been achieved and the task remaining. However, the figures and tables presented here cannot be taken at face value. Problems with the definition, registration and estimation of late-fetal mortality mean that temporal and spatial comparisons may be undermined. The examples of Italy and Malawi will help to illustrate the point.
Registration of stillbirths began in Italy in 1863.20 But the low level of national SBRs and the regional differentials indicate that the process was far from comprehensive. In the 1870s only seven Italian regions had SBRs over 30, and in four (Abruzzi, Calabria, Sardinia and Sicily) it was less than 20. Italy offers an excellent example of what we would expect to see in a country with improving registration coverage. National SBRs only reached credible levels during the early decades of the 20th century because regional differences in registration quality had narrowed by then. Rates in the south rose to match those in the north and then stayed at a higher level longer. After 1950 all regions shared in a sustained decline so that Italy’s SBR is now one of the lowest in the world. Table 2 shows that Malawi is credited by WHO with an SBR of only 13 in the year 2000 despite having very high infant and maternal mortality, and a very low life expectancy. This SBR is not estimated but comes from the Malawi Demographic and Health Surveys for 2000, which also reports an infant mortality rate of 104.21 Had the SBR been estimated from early-neonatal mortality, it would have been given as 34. The SBR of 10 for Egypt also comes directly from the Demographic Health Surveys. It would have been 19 if derived from early-neonatal mortality rates. In the cases of India and Nigeria, the SBR has been estimated from neonatal mortality rates given in DHS reports. Italy and Malawi may be extreme examples. They demonstrate how unreliable registration and survey data can be, but they also emphasize the value of placing late-fetal alongside other mortality indices, and of comparing across both the spatial and temporal dimensions.
Conclusions
This paper has three principal conclusions. First, there are still many problems to be resolved in the measurement of late-fetal mortality. Some of these relate to the quality of survey data and others to estimation methods which are, to say the least, rudimentary. The history of stillbirth registration and the developing role of skilled birth attendants in Europe provide several useful markers in terms of anticipated mortality rates, the effects of registration improvements and the causes of decline. We may learn from the definition and registration experience in developed countries, their trends and turning points, and what levels are credible where direct evidence is lacking.
Second, the role of birth attendants is more complicated than may have been thought. The effect on maternal mortality has been re-emphasized, but the influence on late-fetal mortality appears more ambiguous than might have been anticipated. Whether this is due to poor estimation of the SBR or reliance on unjustified assumptions awaits closer consideration.
Third, on the expectation that many more countries will join the high life expectancy set and that child mortality will be further reduced, then fetal health will occupy a higher place on the public health agenda. Without good quality registration data, or at least a robust methodology for estimation from survey material, the challenge of high fetal wastage cannot be tackled effectively. Target mothers and the newborn; prepare to focus on the unborn. ■
Footnotes
Competing interests: None declared.
References
- 1.Ahmad OB, Lopez AD, Inoue M. The decline in child mortality: a reappraisal. Bull World Health Organ. 2000;78:1175–91. [PMC free article] [PubMed] [Google Scholar]
- 2.Rutstein SO. Factors associated with trends in infant and child mortality in developing countries during the 1990s. Bull World Health Organ. 2000;78:1256–70. [PMC free article] [PubMed] [Google Scholar]
- 3.Unsafe abortion: global and regional estimates of the incidence of unsafe abortion and associated mortality, 4th edn. Geneva: WHO; 2004. [Google Scholar]
- 4.Gourbin G, Masuy-Stroobant G. Registration of vital data: are live births and stillbirths comparable all over Europe? Bull World Health Organ. 1995;73:449–80. [PMC free article] [PubMed] [Google Scholar]
- 5.Carlson E, Hoem JM, Rychtarikova J. Trajectories of fetal loss in the Czech Republic. Demography. 1999;36:327–37. doi: 10.2307/2648056. [DOI] [PMC free article] [PubMed] [Google Scholar]
- 6.Woods R, Løkke A, van Poppel F. Two hundred years of evidence-based perinatal care: late-fetal mortality in the past. Arch Dis Child Fetal Neonatal Ed. 2006;91:F445–7. doi: 10.1136/adc.2006.098178. [DOI] [PMC free article] [PubMed] [Google Scholar]
- 7.Hoyert DL. Perinatal mortality in the United States, 1985-91, National Center for Health Statistics. Vital Health Statistics 1995;20. [PubMed] [Google Scholar]
- 8.Barfield WD, Tomashek KM, Flowers LM, Iyasu S. Contribution of late fetal deaths to US perinatal mortality rates, 1995-1998. Semin Perinatol. 2002;26:17–24. doi: 10.1053/sper.2002.29850. [DOI] [PubMed] [Google Scholar]
- 9.Løkke A. The ‘antiseptic’ transformation of Danish midwives, 1860-1920. In: Marland H, Rafferty AM. eds. Midwives, Society and Childbirth: Debates and Controversies in the Modern Period London: Routledge; 1997. pp. 102-133. [Google Scholar]
- 10.Andersson T, Högberg U, Bergström S. Community-based prevention of perinatal deaths: lessons from nineteenth-century Sweden. Int J Epidemiol. 2000;29:542–8. doi: 10.1093/ije/29.3.542. [DOI] [PubMed] [Google Scholar]
- 11.Loudon I. Midwives and the quality of maternal care. In: Marland H, Rafferty AM. eds. Midwives, society and childbirth: debates and controversies in the modern period London: Routledge; 1997. pp. 180-200. [Google Scholar]
- 12.Loudon I. Death in childbirth: an international study of maternal care and maternal mortality, 1800-1950 Oxford: Clarendon Press; 1992. [Google Scholar]
- 13.Neonatal and perinatal mortality: country, regional and global estimates Geneva: WHO; 2006.
- 14.Lopez AD, Ahmad OB, Guillot M, Inoue M, Ferguson BD, Salomon JA. Life tables for 191 countries for 2000: data, methods, results [GPE discussion paper no. 40]. Geneva: WHO; 2001. [Google Scholar]
- 15.Maternal mortality in 2000: estimates developed by WHO, UNICEF, UNFPA Geneva: WHO; 2004.
- 16.Skilled attendant at birth, 2006 updates Geneva: WHO; 2006.
- 17.The critical role of the skilled attendant. A joint statement by WHO, ICM and FIGO Geneva: WHO; 2004.
- 18.Lawn J, Shibuya K, Stein C. No cry at birth: global estimates of intrapartum stillbirths and intrapartum-related neonatal deaths. Bull World Health Organ. 2005;83:409–17. [PMC free article] [PubMed] [Google Scholar]
- 19.Goldenberg RL, Thompson C. The infectious origins of stillbirths. Am J Obstet Gynecol. 2003;189:861–73. doi: 10.1067/S0002-9378(03)00470-8. [DOI] [PubMed] [Google Scholar]
- 20.Tendenze evolutive della mortalità infantile in Italia, Annali di Statistica, Serie VIII, Volume 29. Rome: ISTAT; 1975.
- 21.Mahy M. Childhood mortality in the developing world: a review of evidence from the demographic and health rurveys [DHS comparative reports no. 4]. Calverton, MD: ORC Macro; 2003. [Google Scholar]


