Abstract
In vivo knowledge of the spatial distribution of viable, necrotic, and hypoxic areas can provide prognostic information about the risk of developing metastases and regional radiation sensitivity and may be used potentially for localized dose escalation in radiation treatment. In this study, multimodality in vivo magnetic resonance imaging (MRI) and positron emission tomography (PET) imaging using stereotactic fiduciary markers in the Dunning R3327-AT prostate tumor were performed, focusing on the relationship between dynamic contrast-enhanced (DCE) MRI using Magnevist (Gd-DTPA) and dynamic 18F-fluoromisonidazole (18F-Fmiso) PET. The noninvasive measurements were verified using tumor tissue sections stained for hematoxylin/eosin and pimonidazole. To further validate the relationship between 18F-Fmiso and pimonidazole uptake, 18F digital autoradiography was performed on a selected tumor and compared with the corresponding pimonidazole-stained slices. The comparison of Akep values (kep = rate constant of movement of Gd-DTPA between the interstitial space and plasma and A = amplitude in the two-compartment model (Hoffmann U, Brix G, Knopp MV, Hess T and Lorenz WJ (1995). Magn Reson Med 33, 506–514) derived from DCE-MRI studies and from early 18F-Fmiso uptake PET studies showed that tumor vasculature is a major determinant of early 18F-Fmiso uptake. A negative correlation between the spatial map of Akep and the slope map of late (last 1 hour of the dynamic PET scan) 18F-Fmiso uptake was observed. The relationships between DCE-MRI and hematoxylin/eosin slices and between 18F-Fmiso PET and pimonidazole slices confirm the validity of MRI/PET measurements to image the tumor microenvironment and to identify regions of tumor necrosis, hypoxia, and well-perfused tissue.
Introduction
It is anticipated that the ability to image the tumor microenvironment in vivo will provide useful prognostic information including an assessment of factors that influence response to treatment. For example, hypoxia, typically distributed heterogeneously in locally advanced tumors, is known to affect both radiation sensitivity and the development of metastases [1–4]. Tumor hypoxia results from an imbalance between the supply and use of oxygen in tumor tissues. Thus, major determinants of tumor hypoxia include the structure and functionality of tumor vasculature and the degree of angiogenesis [5–8]. The direct measurement of tumor hypoxia usually requires invasive procedures such as the insertion of polarographic electrodes. However, such invasive methods are restricted both spatially and temporally, being limited to a relatively small number of measurements on easily accessible tumors at, typically, a single point in time. Noninvasive imaging offers several advantages, including the feasibility of longitudinal measurements on the same subject, the generation of complete three-dimensional maps of tumor hypoxia, and the potential application to image-guided therapy. Imaging modalities, such as magnetic resonance imaging (MRI), positron emission tomography (PET), electron paramagnetic resonance, and optical imaging, have their own unique advantages. Magnetic resonance imaging provides unique functional and structural information on tumor vasculature and physiology at high spatial resolution. Positron emission tomography can measure sensitively and quantitatively local concentrations of radioactive molecular targets of interest, such as labeled fluoromisonidazole (18F-Fmiso).
18F-Fmiso PET is currently under intense investigation as a method of imaging tumor hypoxia. This is based on the selective bioreduction of 18F-Fmiso in hypoxic tumor regions followed by the binding of its metabolites to macromolecules [9–12]. However, the spatial resolution, based on the full-width half-maximum (FWHM) of the point spread function of the PET activity signal, is relatively coarse, ranging from 1 to 2 mm for dedicated small-animal scanners to 5 to 6 mm for clinical PET scanners. Magnetic resonance techniques provide unique opportunities to obtain noninvasive structural and functional information on tumor vasculature and physiology with anatomical details at finer spatial resolution. Magnetic resonance methods, which include dynamic contrast-enhanced MRI (DCE-MRI) [13,14], blood oxygen level-dependent imaging [15], fluorine-19 MR measurements of oxygen-sensitive compounds [16–18], and the measurement of lactate [19,20], may provide high-spatial resolution functional information to complement other imaging modalities.
In particular, DCE-MRI provides vasculature/perfusion information of the tumor microenvironment [21,22] and, thus, not only offers complementary information to PET hypoxia imaging but also may address the relationship between tumor hypoxia and vasculature. In this article, we focus on the relationship between DCE-MRI studies using Gd-DTPA as the contrast agent, and dynamic 18F-Fmiso PET, in the syngeneic Dunning R3327-AT prostate tumor in rats. The in vivo imaging results were validated by ex vivo studies featuring staining with hematoxylin/eosin (H&E) (tumor necrosis) and pimonidazole (tumor hypoxia) together with 18F digital autoradiography (DAR; 18F-Fmiso distribution) on tumor tissue sections accurately registered to the corresponding in vivo slices. Accurate registration of macroscopic (MRI and PET) and microscopic images (H&E, pimonidazole and 18F DAR) is a unique and important feature of the current study.
Experimental Methods
Animal Preparation
Animal studies were conducted in compliance with protocols approved by the Institutional Animal Care and Use Committee of Memorial Sloan-Kettering Cancer Center (MSKCC). The rat prostate cancer cell line R3327-AT [23] was cultured in Dulbecco's modified Eagle's medium supplemented with 10% fetal calf serum, 100 U/ml penicillin, and 100 µg/ml streptomycin at 37°C in a humidified CO2 incubator. Cells were harvested on reaching 75% to 80% confluence and suspended in phosphate-buffered saline (PBS) at a final concentration of 2 x 10⁶ cells/0.1 ml. Two to four million R3327-AT cells were injected in the right hind leg of 6- to 8-week-old Copenhagen rats. Tumor volume (V) was calculated as V = (π/6) x x x y x z, where x, y, and z were the three orthogonal dimensions of the tumor [24]. The experiments were performed over a tumor size range of 500–2500 mm3. A total of six rats were used. At the start of each experiment, the tail vein was catheterized with a 24G catheter and connected to a three-way stopcock (Stopcock Nylon 3-Way, 420163-4503; Kimble Kontes LLC, NJ), facilitating intravenous (IV) injection of the different agents at various stages of the multimodality imaging experiment. The catheter was kept patent by injecting heparinized saline.
Magnetic Resonance Coil and Fiduciary Marker Assembly
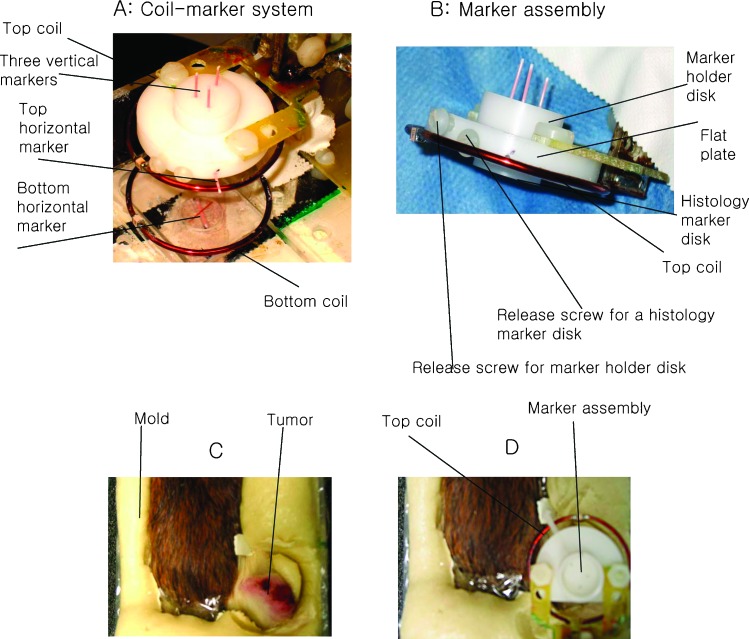
The MRI coil [diameter (D) = 4 cm, Helmholtz configuration] was constructed in two parts (Figure 1A) with the upper part of the MRI coil and marker assembly initially detached to facilitate subsequent positioning of the animal. The spatial marker assembly is shown in Figure 1A attached to the rest of coil-marker system, and Figure 1B shows an enlarged side view of the marker assembly alone (adapted from [25,26]). The marker assembly was composed of two cylindrical disks and one flat plate. The top disk, referred to as the marker holder disk [D = 1.5 cm, thickness (t) = 0.9 cm] had three holes (D = 0.9 mm) for the vertical markers. A bottom histology marker disk (D = 1.5 cm, t = 0.5 cm) with identically aligned holes was separated from the marker holder disk by a flat plate. Separate release screws fastened each disk to the flat plate, which was fixed to the top of the radiofrequency coil. At the end of the imaging experiments, the histology marker disk was detached from the rest of the marker assembly and served as a reference to align the tumor sections with the in vivo image slices as described below (procedure detailed in the Preparation of Tumor Cryosections section). The flat plate had one side hole to contain a horizontal marker. An additional holder was placed at the center of the bottom coil with a grooved disk (D = 1 cm, t = 0.3 cm) containing another horizontal marker as shown in Figure 1A. The three vertical (forming an oblique triangle with lengths of 0.9, 0.7, and 0.5 cm, respectively) and two leveled horizontal markers (22G catheter; Terumo Surflo I.V. Catheter, Somerset, NJ) were filled with Gd-DTPA-doped and red-colored water, sealed at the ends with Critoseal (Cascade Healthcare, Portland, OR), and placed at each of the designated positions in the marker holders. The three vertical markers were pushed into the 0.9-mm-sized holes through the two separate cylindrical disks (the marker holder and histology marker disks). The three vertical and two horizontal markers appear as the red tubes in Figure 1A. The distance between the top and bottom coil was adjustable over a range of 2 to 3 cm to accommodate tumors of various sizes.
Figure 1.
Photographs illustrating animal positioning and molding process on the home-built MR/PET animal holder with stereotactic marker system. (A) An enlarged picture of the stereotactic coil-marker system for MR/PET with actual markers (22G catheter, appearing as red tubes) placed in position. (B) Side view of the marker holder and histology disk. The tumor without (C) and with marker assembly in place (D) is shown after securing the animal on the holder. The release screws for vertical marker holder and histology disk were used to disengage each piece independently.
Animal Immobilization
The animal was placed on a plexiglass holder, and a rapidly setting mold was formed to keep it in place on the plastic wrap-lined animal holder with a respiration monitor pad (SA Instruments, Inc., Stony Brook, NY) placed under the animal's abdomen. The animal was anesthetized with isoflurane (1%–2%), lined in plastic wrap, and placed prone on the holder with its tumor-bearing hind leg outstretched above the bottom part of the MR coil (Figure 1C). The animal-positioning mold was made by mixing SecureFoam foaming reagents (Bionix Radiation Therapy, Toledo, OH) “A” and “B” (15 g each) together and pouring them on the plexiglass holder lateral to the animal [27], effectively immobilizing the animal and its leg. After allowing 5 to 7 minutes for the mold to cure, the top part of the MRI coil including the marker assembly was attached back to the circuitry and placed on the top of tumor (Figure 1D).
Dynamic Contrast-Enhanced MRI
The DCE-MRI experiments were performed on a Bruker 7T BioSpin (Bruker, Germany) imaging spectrometer. A syringe filled with the contrast agent Gd-DTPA (0.2 mM Gd/kg, Magnevist; Berlex Laboratories, Inc., Wayne, NJ) was connected to the three-way stopcock through Gd-DTPA-filled tubing (Masterflex Norprene tubing, 6402-13). The entire assembly including the anesthetized animal was positioned inside the magnet using a spirit level and the axial MR profile. Respiration was monitored during the MR experiment. Warm air flowed through the magnet's bore to maintain the animal's temperature under isoflurane anesthesia. The MRI coil was tuned and matched to the proton frequency, followed by shimming of the sample. The coronal slices of interest were determined from a pilot scan. Spin density images [fast low-angle shot MRI, repetition interval (TR) = 500 milliseconds, echo time (TE) = 3.1 milliseconds, number of repetitions (NR) = 1, number of averages (NA) = 1, slice thickness (ST) = 0.79 mm, field of view (FOV) = 3.5 cm x 3.5 cm, matrix = 128 x 128, number of slices = 64, flip angle = 30°] were acquired to encompass the MRI marker and tumor for subsequent image registration with PET and histology. T2-weighted MR images (rapid acquisition with refocused echoes, TR = 2000 milliseconds, TE = 30 milliseconds, NR = 1, NA = 1, ST = 0.79 mm, number of slices = 4, FOV = 3.5 cm x 3.5 cm, matrix = 128 x 128) were acquired for four tumor slices to visualize clearly the boundary between tumor and muscle. T1-weighted DCE-MRI (fast low-angle shots, TR = 33 milliseconds, TE = 3.1 milliseconds, NR = 256, NA = 1, ST = 0.79 mm, number of slices = 4, FOV = 3.5 cm x 3.5 cm, matrix = 128 x 128, flip angle = 30°) was performed at 5.47 seconds of temporal resolution with an in-plane resolution of 273 µm x 273 µm in plane. The contrast agent Gd-DTPA was injected through the tail vein after 2 minutes of baseline acquisition followed by 20 minutes of dynamic acquisition. After the DCE-MRI studies, additional proton spin density images were reacquired and compared with the previous images to ensure that the tumors were in the identical position with respect to the marker system before and after the DCE-MRI study. The tubing and syringe for the administration of the contrast agent Gd-DTPA were replaced by a syringe filled with pimonidazole (Hypoxyprobe, NPI, Inc., Burlington, MA). The still anesthetized animal in the holder was transported under anesthesia to the microPET facility on a mobile anesthesia cart. We have previously shown that this procedure prevents the displacement of the tumor with respect to the marker assembly [26].
Dynamic microPET
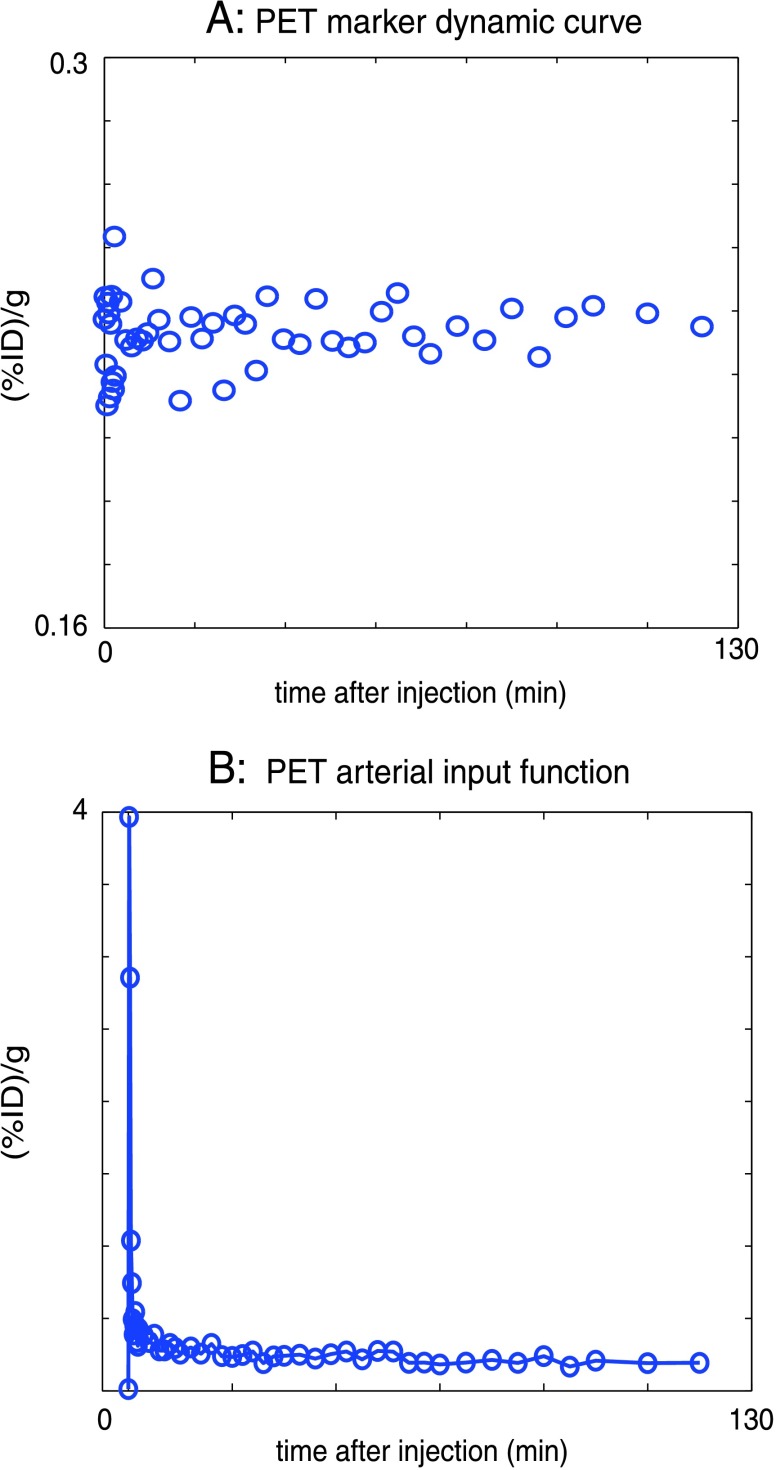
Fluorine-18-Fmiso was produced by the Radiochemistry Service at MSKCC on an EBCO TR 19/9 cyclotron (EDCO Technologies, Vancouver, Canada) as reported previously [28]. For PET studies, the MRI markers were replaced with catheter tubings filled with 18F-Fmiso diluted with red dye to an activity of ∼10 µCi/ml. The animal was positioned with its tumor centered in the gantry of the microPET Focus 120 (CTI Molecular Imaging, Inc., Knoxville, TN) and the animal bed horizontally aligned with respect to the MRI plane. An initial 2-minute static acquisition was performed to acquire the diluted 18F-Fmiso marker images for image coregistration before the injection of the 18F-Fmiso and dynamic imaging. Thus, the relatively high-activity (∼1.5 mCi) 18F-Fmiso injected for the dynamic imaging did not distort the images of the marker and the low-activity markers had no effect on the dynamic 18F-Fmiso imaging. The injection of 18F-Fmiso (∼1.5 mCi) through one port of the three-way stopcock was immediately followed by the injection of pimonidazole (60 mg/kg) through another port of the stopcock. Dynamic PET scanning was initiated immediately before the injection of the 18F-Fmiso and continued for 2 to 3 hours. Figure 2A shows a “control” dynamic PET time-activity curve of one vertical marker demonstrating the stability of the PET acquisition. The list mode data were acquired using an energy window of 350 to 750 keV and a coincidence timing window of 6 nanoseconds and were reconstructed in a three-dimensional image matrix with voxel dimensions of 0.86 mm x 0.86 mm x 0.79 mm.
Figure 2.
(A) The PET signal of one of the vertical markers for the duration of the PET measurement demonstrating the stability of the PET acquisition; the greater dispersion of points at earlier times after injection reflects the corresponding shorter time frames and lower count statistics. (B) The AIF of PET sampled from the tail region of a rat. This AIF was used for the compartment modeling of the dynamic PET time-activity curves reducing the open parameters to be fitted to four. ID indicates injected dose.
Preparation of Tumor Cryosections
After the PET scan, the animal assembly was removed from the scanner and the PET markers were removed by releasing the vertical marker holder disk (previously described in the Animal Preparation section) from the coil-marker assembly while keeping the histology disk with its identical pattern of holes in place on the tumor. The animal was then euthanized in place by isoflurane overdose, and immediately after sacrifice, three catheters with steel needles were pushed through the histology marker disk into the tumor. The resulting catheter histology disk-tumor assembly ensured the coregistration of tissue sections with the in vivo MR and PET images. After the insertion of the catheter and needles, the bottom histology marker disk was released from the coil-marker assembly, and the animal was removed from the holder for tumor excision. The tumor was excised with the catheter histology disk-tumor assembly intact, washed once in PBS, placed into OCT (Tissue-Tek O.C.T. Compound, Sakura Finetek U.S.A., Inc., Torrance, CA) and frozen in dry ice. After the catheter histology disk-tumor assembly was frozen, the steel needles were removed leaving the catheter tubing in place. To properly orient the tissue section plane with respect to the MRI/PET imaging plane, the histology disk was oriented parallel to the cutting surface of the tumor while freezing in dry ice. The frozen tissues were stored at -80°C until later processing.
Autoradiography, Immunofluorescence, and Histology
The frozen OCT-embedded tumors were sectioned on a Microm HM500 cryostat microtome (Microm International GmbH, Walldorf, Germany). Sets of contiguous 8-µm-thick sections were cut at 0.79-mm increments across the tumor to ensure that the histology slices were sampled at positions corresponding to mid slice of the MRI and PET tomograms. To acquire the distribution of 18F-Fmiso on a selected tumor, one section from each set was placed onto an imaging phosphor plate for DAR. Twenty-four hours later, the DAR images were read out in a 50-µm-pixel-size mode using a Fujifilm BAS-1800 II phosphor plate reader (Fuji Photo Film Co. Ltd., Tokyo, Japan). After autoradiography, sections were fixed in 4% paraformaldehyde solution for 10 minutes at room temperature and then blocked in SuperBlock-PBS (Pierce Biotechnology, Inc., Rockford, IL) for 1 hour. The pimonidazole distribution was detected by incubating with an antipimonidazole monoclonal antibody conjugated to fluorescein isothiocyanate (Chemicon, Temecula, CA), diluted 1:10 in SuperBlock. Images of stained tumor sections were acquired at a high magnification (x100) using an Olympus BX40 fluorescence microscope (Olympus America Inc., Melville, NY) equipped with a motorized stage (Prior Scientific Instruments Ltd., Cambridge, UK) and an appropriate filter. The individually captured image frames were rendered into a montage of the entire tumor section (0.85 µm x 0.85 µm per pixel) using ImagePro software (Media Cybernetics Inc, Bethesda, MD). The sections were then stained with H&E for the identification of tumor necrosis and were imaged by light microscopy (0.85 µm x 0.85 µm per pixel). An image mask was generated based on the pimonidazole-stained section to distinguish the hypoxic from the nonhypoxic areas in the tumor. To reproducibly generate masks of positive pimonidazole staining, the images were converted to black and white, and a threshold for the intensity of pimonidazole background staining was obtained by measuring the average intensity of staining in the necrotic region of the tumor. The necrotic tumor region was determined from the corresponding H&E stained section. The resulting mask of positive pimonidazole staining was applied to the slope map of the late 18F-Fmiso PET images to separate values corresponding to hypoxic tumor regions from those corresponding to nonhypoxic tumor regions. For viable tumor regions, a similar mask was generated from the H&E image and applied to the corresponding DCE Akep map to distinguish values of viable tumor tissue from those of necrosis.
Data Analysis
Dynamic Contrast-Enhanced MRI Analysis
The DCE-MRI data analysis was performed using in-house written Matlab (The MathWorks, Inc., Natick, MA) scripts. Dynamic signal intensity curves were obtained from the T1-weighted signal intensity of each voxel in the dynamic MR images of the tumor slices after Gd-DTPA administration. The experimental dynamic build-up curves for each voxel in the MR images were normalized to the baseline signal and fitted using the model developed by Hoffman et al. [29] for each slice. This model is based on the linear relationship between measured saturation recovery MR signal and the concentration of Gd-DTPA in the tissue. An amplitude (A), which reflects the degree of relative MR signal enhancement and an exchange rate (kep), which characterizes the velocity of MR signal increase, can be derived from the two-compartment model. Consequently, the value of Akep is analogous to the slope of time-dependent MR signal enhancement and is considered an approximate measure of blood flow/perfusion of the tumor tissue [29]. The Hoffman model was used to estimate Akep values of individual voxels from the dynamic build up curves, and Akep maps were generated for the corresponding tumor slices.
Dynamic PET Analysis
List mode data were sorted into two-dimensional histograms by Fourier rebinning using a span of 3 and a maximum ring difference of 47. Images were reconstructed by filtered back-projection using a ramp filter with the Nyquist frequency as the cutoff frequency in a 128 x 128 x 95 matrix. The image data were corrected for nonuniformity of scanner response with cylinder source-based normalization, a global correction for dead-time count losses based on the singles count rate and physical decay to the time of injection. The count rates in the reconstructed images were converted to activity concentration (% of injected dose per gram of tissue, %ID/g) using a system calibration factor derived from a rat-size cylindrical phantom measurement containing a known activity concentration in aqueous 18F solution. The phantom measurement also revealed that no attenuation or scatter correction was necessary. Voxel-based analysis of reconstructed dynamic PET images was performed using inhouse written Matlab scripts. Kinetic curves of 18F-Fmiso intensity for individual voxels for each acquired tomographic slice through the tumor (0.86 mm x 0.86 mm x 0.79 mm, 45–49 time frames during the 2∼3 hours of total acquisition time) were obtained. The initial 18F-Fmiso uptake into the tumor was evaluated for each animal from the first 5 minutes of the dynamic PET scan. This analysis is based on the hypothesis that the initial distribution of 18F-Fmiso is mainly driven by tumor perfusion, so that the early uptake of 18F-Fmiso is representative of tumor vasculature and perfusion. The later 18F-Fmiso uptake was analyzed for each animal by fitting the linear slope of the last 1 hour of data from the PET time-activity curve. The analysis of the later 18F-Fmiso uptake data was based on the hypothesis that the accumulation of 18F-Fmiso in the hypoxic region results in a positive slope at later time after injection, whereas a well-perfused, normoxic tumor region exhibits dynamic curves with a high initial uptake followed by washout and necrotic areas display little to no initial uptake with only gradual subsequent uptake. Thus, we hypothesized that the positive slope of later time points in the dynamic PET curve of a voxel identifies areas of tumor hypoxia. The validity of this hypothesis will be demonstrated in the Experimental Results section. To quantify perfusion and tumor hypoxia, the foregoing analysis of the PET data was complemented by compartment modeling of the dynamic PET signal. The model of Thorwarth et al. [30] describes the tissue as consisting of a diffusive and an accumulative compartment based on a kinetic model with four variables fitting the experimental kinetic curves for each voxel. This model is used to extract the grade of perfusion, w0 (weighting factor of vascularized region), and the extent of hypoxia, wa x k3 (where wa is the number of viable hypoxic cells and k3 is the modified 18F-Fmiso accumulation rate constant, i.e., mean degree of hypoxia), respectively [30]. The grade of perfusion and the extent of hypoxia thus identified were then compared directly with the initial uptake and later slope maps, respectively, of the 18F-Fmiso time-activity curve. The arterial input function (AIF) for the 18F-Fmiso compartment modeling was derived by region of interest analysis over a central blood vessel in the dynamic PET (Figure 2B).
Image Coregistration
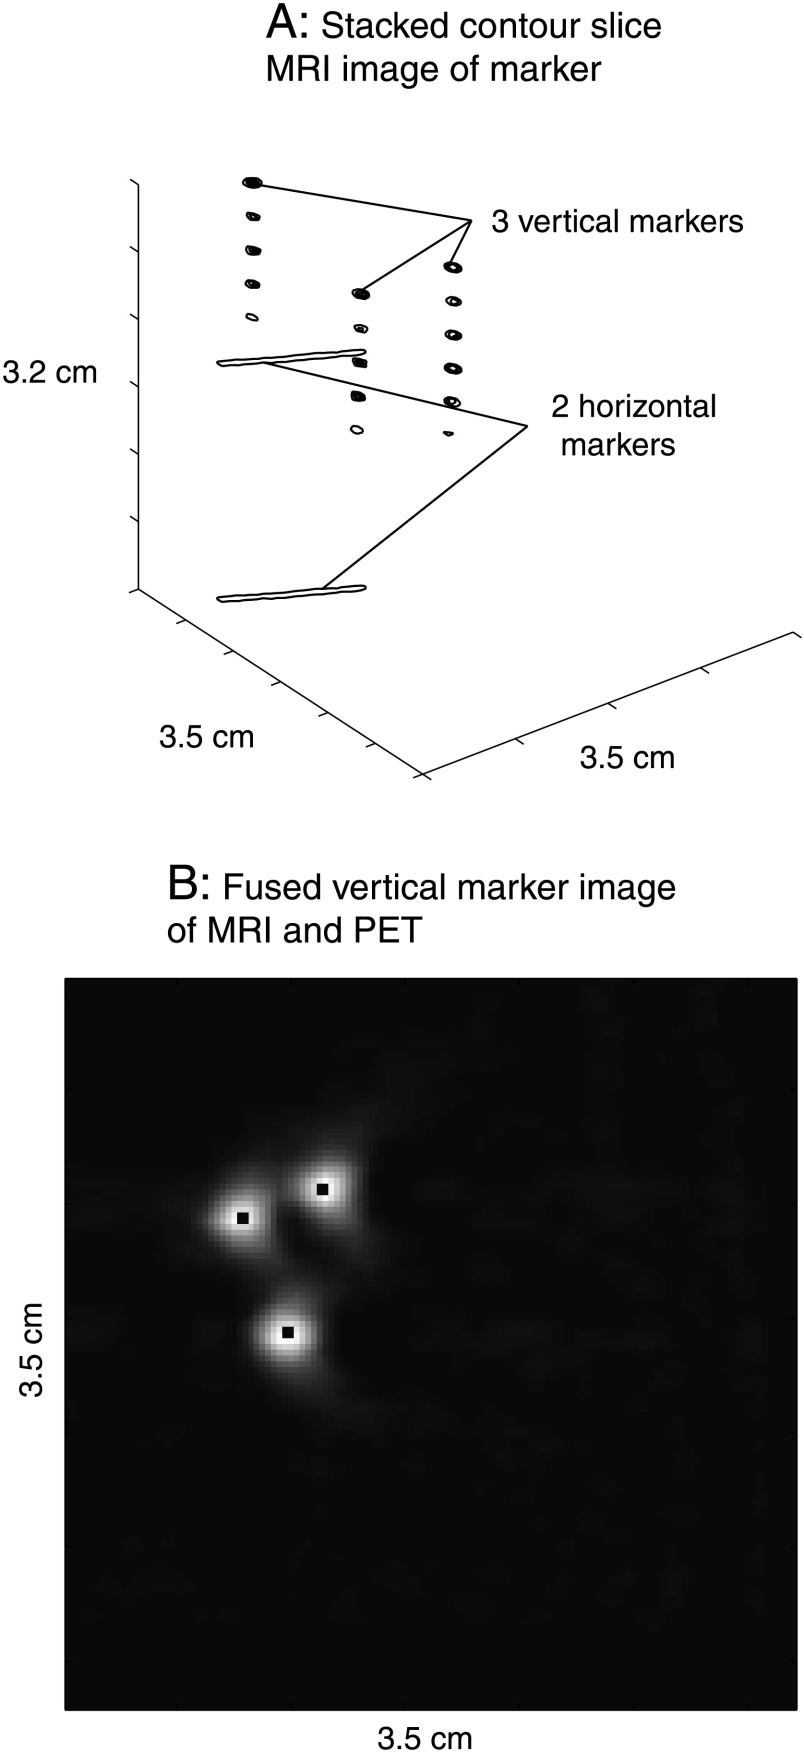
Magnetic resonance and PET images were coregistered using a rigid transform derived from the three-dimensional marker systems as shown in stacked MR slices in Figure 3A. The slice thickness of the MR images was chosen to match the nominal slice thickness of 0.79 mm of the PET image slices, facilitating the alignment of the MR with the PET image. The maximum error for this slice coregistration can be estimated as follows. Considering that the inner diameter of a 22G catheter (MR marker) was 0.6 mm and the slice thickness was 0.79 mm, a maximum error of ±0.1 mm can occur if the marker is located off center in the slice. (Note that the MR slice for the top horizontal marker was chosen in such a way that the MR signal from the marker was confined to one slice and no detectable MR signal from adjacent slices was observed.) For the PET markers, the worst case error would occur if the center of the catheter (PET marker) were located just between two adjacent PET slices, resulting in a maximum error of ±0.4 mm. After matching the slices, the MR and PET images were aligned in plane, using the three vertical marker images of both MR and PET images. Owing to the different in-plane resolutions of PET and MR, PET marker images were interpolated to match the in-plane resolution of the MR voxel using nearest-neighbor interpolation followed by the calculation of the maximum correlation coefficient for the two images with varying translational and rotational shift of the PET marker images. The resulting optimized rotational and translational shifts were then applied to the tumor slices thereby aligning the MR and PET images (Figure 3B).
Figure 3.
(A) Representative stacked two-dimensional slice images of MR markers are shown. Tumors grown on hind legs of rats are placed between the two horizontal markers. (B) The aligned MR and PET images of the three vertical markers are shown. The black center demarks the MR marker signal overlaying the coarser marker signal of the PET acquisition.
Experimental Results
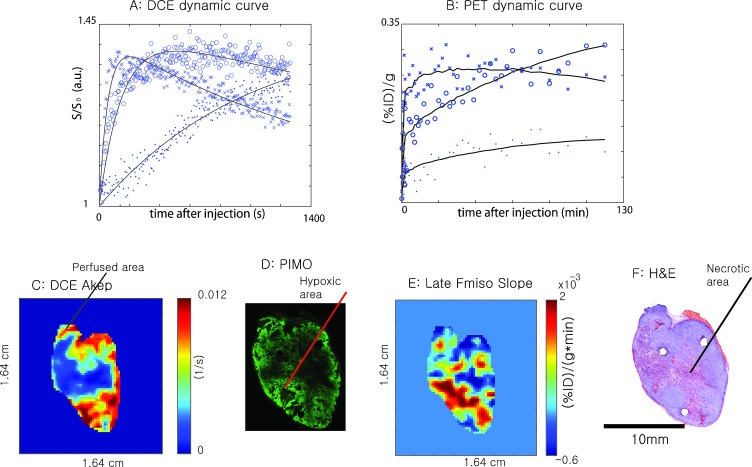
Figure 4, A and B, shows the DCE-MRI time-signal curves and 18F-Fmiso PET time-activity curves for a representative voxel from perfused, hypoxic, and necrotic regions of a tumor, respectively. The voxel for the perfused area was chosen from the high-intensity region of the DCE-MRI Akep map as shown in Figure 4C and the voxel representing the hypoxic region was selected from the area staining strongly for pimonidazole (Figure 4D) as well as from the parametric images of PET 18F-Fmiso late slope maps as shown Figure 4E. The voxel representing tumor necrosis was chosen from the H&E-stained sections (Figure 4F). In the DCE-MR study, the T1-weighted proton signal increased fastest in the nonnecrotic area as a result of rapid Gd-DTPA uptake in the well-perfused region followed by rapid washout. In contrast, hypoxic regions, typically characterized by reduced vascularization, showed a delayed Gd-DTPA uptake corresponding to a delay in signal build-up and also to a delay in washout (Figure 4A). In necrotic regions of the tumor, the time-dependent increase in the MR signal was slowest, and no washout could be observed for the duration of the MR experiment. In 18F-Fmiso PET studies, well-perfused areas of the tumor were likewise characterized by a rapid initial increase of 18F-Fmiso activity, which subsequently decreased at later times. Hypoxic areas of the tumor demonstrated lower initial activity than well-perfused areas of the tumor but continued to accumulate further 18F-Fmiso during the time course of the experiment, as manifested by the distinctive positive slope (Figure 4B). Consequently, there was a point (∼1 hour for this tumor) of crossover between the decreasing intensity of 18F-Fmiso activity in well-perfused area and increasing intensity in hypoxic areas. The existence of this crossover behavior illustrated that a single static activity image at a late time point after 18F-Fmiso injection may not reliably identify hypoxia because it may reflect 18F-Fmiso activity in well-perfused areas that has not completely washed out. Necrotic regions of the tumor showed the least activity during the time course of the PET experiment; however, some activity is still observed. These observations agree with the hypothesis that the initial uptake of 18F-Fmiso is mainly dependent on tumor vasculature and perfusion. The accumulation of 18F-Fmiso activity in hypoxic regions exhibits a characteristic positive slope at later times, providing a signature for hypoxic regions without the need for complex modeling analyses. Also, as expected, necrotic areas show very low initial uptake of activity and a persisting low signal level.
Figure 4.
Characteristic dynamic uptake curves of Gd-DTPA-assisted DCE-MRI (A) and 18F-Fmiso PET (B) for different tumor microenvironments (x, perfused area; ○, hypoxic area; ●, necrotic area). Perfused, necrotic, and hypoxic areas were independently selected from DCE-MRI (C), H&E (F), pimonidazole (D) and late Fmiso slope (E) images, respectively, and corresponding dynamic curves are plotted in A and B.
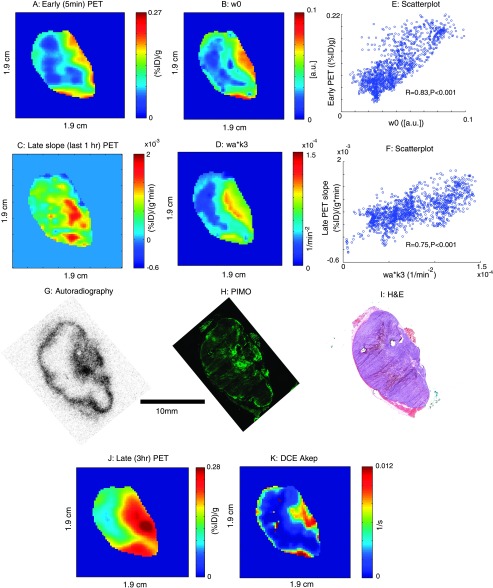
Figure 5 compares early uptake (A) and later slope (C) of the 18F-Fmiso time-activity curve with the compartment model parameters w0 (the grade of perfusion, Figure 5B) and wa x k3 (the extent of hypoxia, Figure 5D), respectively [30]. Tumor perfusion was well represented by the early uptake of 18F-Fmiso, as well as w0, with both parameters being closely related (Figure 5E, Pearson's correlation with R ∼ 0.8, P < .001). There was also a strong correlation between the late slope of the 18F-Fmiso time-activity curve and the model-derived parameter wa x k3 (Figure 5F, Pearson's correlation with R ∼ 0.75, P < .001). With the five open parameters in the PET compartment model, with one of them estimated by the measured AIF, caution needs to be exercised to obtain physiologically relevant values for each parameter. This is particularly problematic in severely hypoxic and necrotic tumor regions for which the signal-to-noise ratio is relatively low. In such cases, the early uptake rate and the late slope of the time-activity curves may provide similar, yet more robust measures of the respective tumor microenvironments as the latter parameters involve fewer degrees of freedom in the fitting procedure than the compartmental modeling.
Figure 5.
(A) Early (5 minutes) 18F-Fmiso uptake values of representative tumor (1230 mm3). (B) The w0 (grade of perfusion) map from the compartment modeling of the dynamic PET signal. (C) Late slope map (last 1 hour of acquisition) of later 18F-Fmiso PET. (D) wa x k3 (the extent of hypoxia) map from the compartment modeling of the dynamic PET signal. (E) Scatterplot comparing voxel-by-voxel early 18F-Fmiso uptake with w0. (F) Scatterplot comparing voxel-by-voxel the late slope map of 18F-Fmiso PET with wa x k3. (J) A static PET intensity image at 3 hours after injection. (K) DCE Akep map. G, H, and I are 18F-Fmiso autoradiography, pimonidazole staining (PIMO), and H&E staining, respectively.
In Figure 5, G–I, respectively, a 18F digital autoradiogram (DAR), pimonidazole- and H&E-stained tissue section, and the corresponding in vivo MRI and 18F-Fmiso PET tumor images are shown. The spatial congruence between the late (3 hours) static PET image (Figure 5J) and the activity distribution in the 18F-autoradiogram (Figure 5G) is visually apparent. However, the 3-hour static image of PET (Figure 5J) does not show the hot rim present in the DAR image. Considering the fact that the static image of the late PET scan and the DAR have grossly different (∼40-fold) resolution, the voxel-averaging effect of PET needs to be taken into account to understand this discrepancy (see the Discussion section). It is also important to note the apparent discrepancy between the significant rim activity of 18F-Fmiso in the DAR and the apparent lack of pimonidazole positivity in this region. Given the likelihood that the rim of this slice is well perfused, as may be inferred from the Akep map (Figure 5K), we hypothesize that the high-intensity region of 18F-Fmiso around the tumor rim in the tissue section contains radioactivity that did not fully wash-out from the perfused area (see the Discussion section). In principle, the late slope map of 18F-Fmiso (Figure 5C), or the wa x k3 parametric map from compartment modeling (Figure 5D) should eliminate false-positive hypoxic regions such as this; however, in this particular case, the issue is complicated by the voxel-averaging effect. Overall, the spatial congruence of the pimonidazole-stained section, the late 18F-Fmiso slope map (Figure 5C), and the wa x k3 parametric map from compartment modeling (Figure 5D) suggests that the dynamic acquisition of 18F-Fmiso PET provides a more reliable way of identifying regions of hypoxia than a late static 18F-Fmiso image.
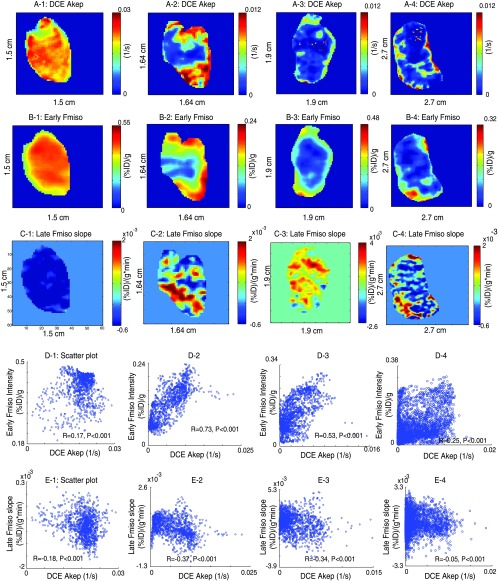
In Figure 6, the relationship between Akep map (A) and early 18F-Fmiso uptake values (B) and late 18F-Fmiso slope (C) for tumors of varying sizes are shown. Small tumors (∼500 mm3) were uniformly well perfused, as could be seen in both, the DCE Akep maps (Figure 6A-1) and early 18F-Fmiso uptake PET images (Figure 6B-1). The corresponding voxel-by-voxel scatterplots were rather concentrated at higher values over a small dynamic range (Figure 6D-1) and show a weak positive correlation between DCE Akep and early 18F-Fmiso uptake (R ∼ 0.2). Intermediate-sized tumors (500 to ∼ 1200 mm3; Figure 6, A-2 and A-3) were well perfused around the rim of the tumor with high DCE Akep values and high early PET uptake values (Figure 6, B-2 and B-3). The voxel-by-voxel scatterplot demonstrated higher positive correlations (R = 0.5∼0.7; Figure 6, D-2 and D-3) with values distributed over a larger dynamic range than for the smaller well-perfused tumors. For large tumors (>1500 mm3; Figure 6A-4), the necrotic portion appears to be dominant, and the positive correlation between DCE Akep values and early 18F-Fmiso PET values is again poorer (R ∼ 0.3; Figure 6D-4). These features can be understood in terms of the development of hypoxic and necrotic regions as the tumor grows, which is true for the R3327-AT tumor model used in this study [31,32].
Figure 6.
The rows of A, B, and C show DCE-Akep map, early (5 minutes) 18F-Fmiso uptake values, and slope map of later 18F-Fmiso curve for a slice from four different animals (numbered 1 to 4), respectively. The rows of D and E plot voxel-by-voxel scatterplots for the direct comparison of these quantities. The tumor sizes are 478 mm3 (1), 744 mm3 (2), 870 mm3 (3), and 2531 mm3 (4).
The direct spatial relationship between flow/perfusion as represented by DCE-MRI Akep parametric maps and hypoxia as represented by late 18F-Fmiso PET slope map was evaluated in their adequacy to address the fundamental relationship between tumor microvasculature and hypoxia. Small tumors (∼500 mm3; Figure 6A-1), which appear to be uniformly well perfused, exhibit uniformly negative values in the corresponding late 18F-Fmiso slope maps (Figure 6C-1) and, thus, predictably, appear to be nonhypoxic. The voxel-by-voxel scatterplot between late 18F-Fmiso slope and Akep shows a weak (R ∼ -0.2) but significant (P < .001) negative correlation (Figure 6E-1). For intermediate-size heterogeneous tumors, the regions of positive slopes appeared mainly in the less-perfused areas, and there were stronger negative correlations (R ∼ -0.35) between DCE-MRI Akep and the late slope 18F-Fmiso PET curves (Figure 6, C-2, C-3, E-2, and E-3). As the size of the tumors increases beyond 1500 mm3, no significant uptake of 18F-Fmiso was observed above the noise level except in some parts of the tumor rim, matching the Gd-DTPA uptake pattern for this large tumor (Figure 6, C-4 and E-4).
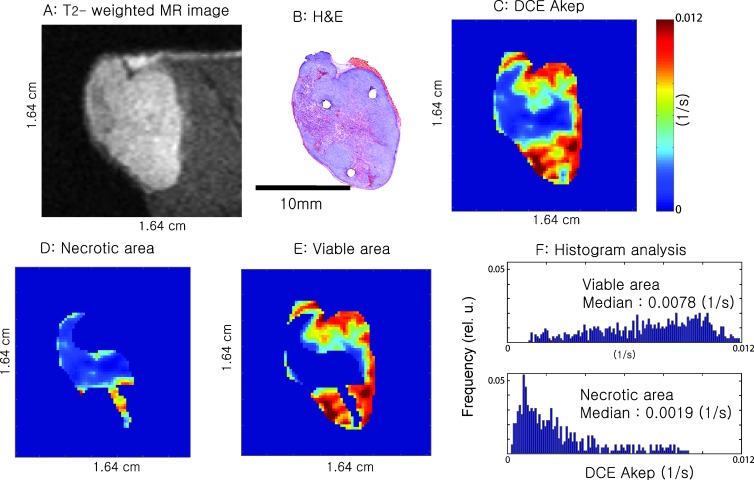
Figure 7 and Figure W1 relate the values of DCE-MRI Akep to H&E staining for two representative tumor slices each from a different animal. The T2-weighted MR image of the tumor slice (Figure 7A and Figure W1A) and the corresponding H&E slice (Figure 7B and Figure W1B) are shown. It was apparent in both tissue sections that higher values of Akep (Figure 7C and Figure W1C) correspond to the viable tumor and lower values of Akep match well with the necrotic area, as estimated from the corresponding H&E slice (Figure 7B and Figure W1B). For further quantification, a mask was generated based on the H&E staining to distinguish viable from necrotic tumor regions and was mapped onto the Akep map, as shown in Figure 7, D and E, and Figure W1, D and E, followed by histogram analysis. The histogram analysis (Figure 7F and Figure W1F) further confirmed the discrimination that the Akep values could achieve between viable and necrotic areas. The median Akep values for viable tumor regions were significantly higher than those of necrotic regions (P < .001). The amount of overlap was dependent on the individual tumor (Figure F and Figure W1F), suggesting that at the extreme tails of the distribution curves of the Akep values, there may be some minimal overlap between necrotic and viable tissue. However, the shapes of the histograms are markedly different allowing discrimination between viable and necrotic tissue.
Figure 7.
T2-weighted MR image of a slice from one animal (A), corresponding H&E-stained tissue section (B), and corresponding DCE Akep map (C). D and E are the masked Akep values for the necrotic and viable tumor areas, respectively. The histograms in (F) plot the Akep values for viable and necrotic tumor areas, respectively. The median Akep values for viable tumor regions were significantly higher (P < .001) than those of necrotic regions. The tumor size was 744 mm3.
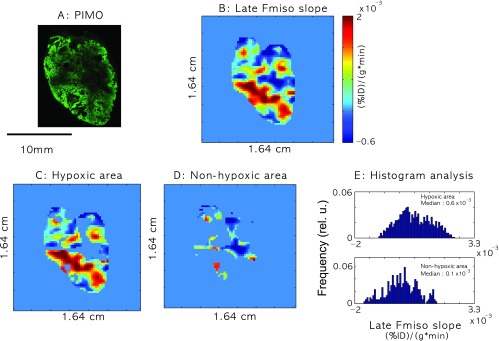
Figure 8 relates the slope map of late 18F-Fmiso PET uptake to regions of pimonidazole-defined hypoxia. A qualitative similarity between the staining in the pimonidazole section designating hypoxia (Figure 8A and Figure W2A) and the late 18F-Fmiso slope map (Figure 8B and Figure W2B) was observed, with higher slope values generally corresponding to more intense pimonidazole staining. Pimonidazole positivity masks (see the Autoradiography, Immunofluorescence, and Histology section) were applied to the slope maps of the late 18F-Fmiso PET images to distinguish values corresponding to the hypoxic tumor regions (Figure 8C and Figure W2C) versus nonhypoxic tumor regions (Figure 8D and Figure W2D). The overlap was considerable, but histogram analysis showed a difference in the slope values between the hypoxic and nonhypoxic areas (Figure 8E and Figure W2E). The volume-averaging effect in coarser-resolution PET images appeared to be substantial and may be largely responsible for the overlap. However, the overlap between slope values of hypoxic and nonhypoxic regions was of concern and would need to be addressed before possible future clinical use.
Figure 8.
(A) Pimonidazole-stained (PIMO) section. (B) Late slope map of 18F-Fmiso PET uptake curves. C and D are masked later 18F-Fmiso PET slope values for hypoxic and nonhypoxic areas of the tumors, respectively. (E) Histogram plots of the late 18F-Fmiso PET slope values for hypoxic and nonhypoxic areas of the tumors. The median values of later 18F-Fmiso PET slope for hypoxic regions were significantly higher (P < .001) than those of nonhypoxic regions, but there was significant overlap. The tumor size was 744 mm3.
Discussion
Multimodality imaging, specifically, DCE-MRI and dynamic 18F-Fmiso PET, was performed on the R3327-AT preclinical tumor model. Corresponding tissue sections were stained with H&E and pimonidazole to relate the noninvasive, in vivo MRI/PET data to the tumor microenvironment as determined from ex vivo analysis of tissue sections. The relationships between coregistered MRI and PET parameters were investigated. A perfusion-related parameter (Akep) derived from DCE-MRI yielded a positive correlation with early 18F-Fmiso PET intensity and a negative correlation with late slope map of 18F-Fmiso PET time-activity curve.
In vivo multimodality MRI/PET imaging of the tumor microenvironment promises many advantages for obtaining prognostic information about tumor progression or tumor response to treatment; however, caution needs to be exercised when interpreting such imaging data. Two issues, in particular, should be considered based on our experimental observations as briefly mentioned in the Experimental Results section.
Voxel-Averaging Effect in PET
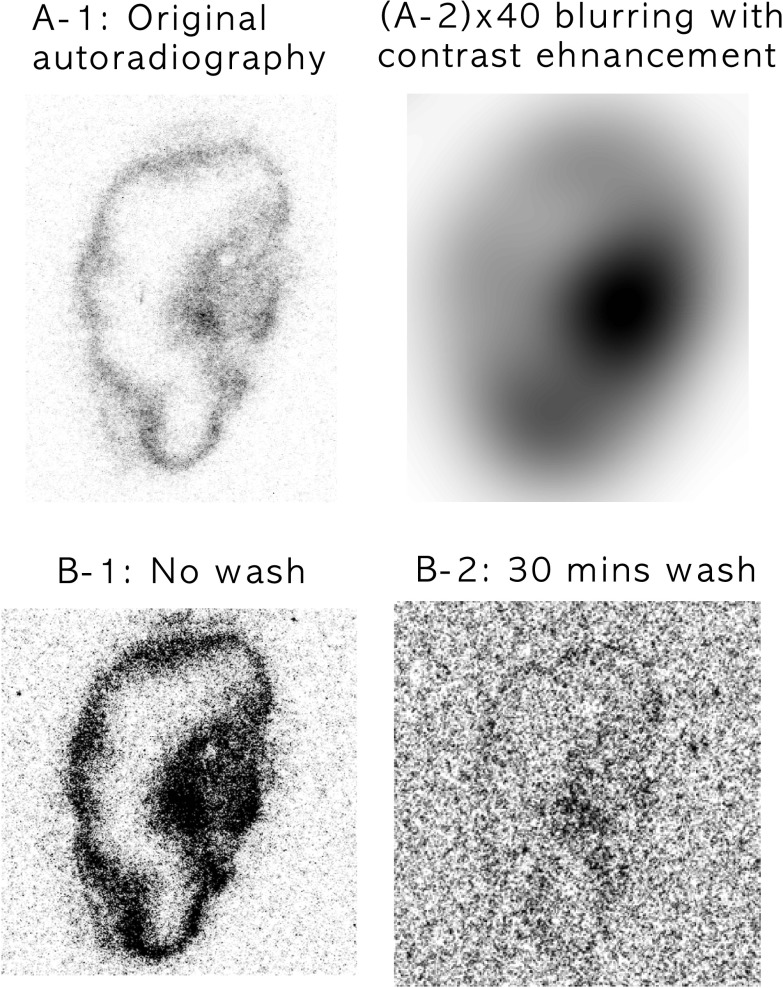
Pimonidazole staining in Figure 4D showed significant staining on the right rim region of the tumor section adjacent to the perfused area as determined from DCE-MRI in Figure 4C. Conversely, the slope map derived from the dynamic PET images (Figure 4E) did not indicate any hypoxia in the corresponding rim region. A similar behavior was also shown for the rim of the tumor in Figure 5, where there is thin pimonidazole staining around the rim of tumor (Figure 5H) and a broader distribution of 18F activity in the DAR (Figure 5G) but not in the in vivo PET images (Figure 5, C, D, and J). This effect is likely due to the volume averaging of PET resulting from its lower spatial resolution (FWHM: 2 mm) compared with other imaging modalities, particularly microscopy of tissue sections (0.85 µm x 0.85 µm per pixel at 100x magnification). This problem is exacerbated if the hypoxic region is located close to the well-perfused areas. To depict the effect of volume averaging, Gaussian blurring was applied to the original DAR (Figure 9). Figure 9A-2 shows 40-fold blurred data, corresponding to the approximate FWHM resolution obtained from microPET imaging with no distinctive hot spots around the rim of tumor; this agrees well with the corresponding late-time (3 hours) static PET image (Figure 5J). Hypoxia imaging using MRI/PET is highly sensitive and specific to tumor hypoxia if the area of hypoxia is similar to the voxel size of the imaging modality used. Smaller hypoxic regions located close to necrotic or perfused tumor areas or intermittent hypoxic regions may otherwise not be detectable using these in vivo imaging modalities because of the voxel-averaging effect.
Figure 9.
A-1 shows the original 18F-Fmiso DAR image at 50 µm x 50 µm in-plane pixel resolution from the tumor shown in Figure 5. A-2 shows the same image with a Gaussian blur applied (radius = 40 pixels), corresponding to the approximate FWHM resolution obtained from microPET imaging (∼2 mm), and with image contrast enhancement. B shows a 18F-Fmiso autoradiograph obtained from a representative tumor section using the tumor shown in Figure 5 before and after a series of wash steps. B-1 shows the radionuclide distribution obtained using standard methods. B-2 shows the DAR image of the tumor section obtained after washing the section in PBS for 30 minutes, demonstrating the washout of unbound 18F-Fmiso.
Perfusion Effect of 18F-Fmiso Accumulation in a Tumor
It is observed that the initial uptake of 18F-Fmiso is dominated by perfusion (Figures 5 and 6). It is also shown from the 18F-Fmiso time-activity curve of 18F-Fmiso PET that there exists a crossover point of signal intensity between well-perfused and hypoxic areas (Figure 4B). Awareness of this crossover effect is critical if a static 18F-Fmiso PET image is used for the detection of hypoxic regions of the tumor. Our data show that different tumors are unlikely to have similar crossover time point because the tumor microenvironment could be very different. To address the hypothesis that the high-intensity region of 18F-Fmiso around the tumor rim in the tissue section contains radioactivity, which did not fully wash out from the perfused area, the tumor section was washed in PBS for 1, 5, and 30 minutes to remove any unbound 18F-Fmiso and was radiographically evaluated. The images at the bottom row of Figure 9 depict the DARs of the frozen section (Figure 9B-1) and after a 30-minute wash in PBS (Figure 9B-2). The signal-to-noise ratio of activity drops significantly even after the first wash, and the thickness of the rim is continually reduced with each wash, eventually approaching the corresponding image of pimonidazole (Figures 5H and 9B-2). The size of the hot spot in the 18F autoradiogram of the slice (Figure 9, B-1 and B-2) decreased with each wash as well and closely approximates the size and location of the intense spot in the pimonidazole-stained section (Figure 5H) and late slope map of 18F-Fmiso (Figure 5C). The possibility of introducing unbound 18F-Fmiso during tissue sectioning cannot be fully excluded when explaining the visible hot rim in DAR, although it is considered less likely.
Also, other aspects related to the sequential acquisition of the MR and PET data in this study need to be considered. The fiduciary marker system and the molding of the animal with the tumor grown on the leg allow stable positioning of the tumor between the MR and PET acquisitions and thus coregistration of the MR and PET images using a rigid transformation. However, in a clinical setting, the tumor may be deformable and/or may be susceptible to both voluntary and involuntary (e.g., respiratory) patient motions. Thus, image coregistration would need to account for motion or tissue deformation, which is a more complex problem to solve and less robust than a rigid transformation. This could be further aggravated by significant tissue movement present between the two imaging studies and would most likely result in larger coregistration errors than can be expected in the current study. Also, performing the MR and PET acquisition sequentially assumes that the gross tumor physiology does not change between the experiments. Simultaneous acquisition of the MR and PET images would therefore be highly desirable. The recent developments of combined MR/PET systems (preclinical and clinical [33–36]), which allow such simultaneous image acquisition, will be invaluable in pursuing studies such as those presented in this article.
Previous clinical studies support the importance of measuring both tumor perfusion and hypoxia [37,38]. Bruehlmeier et al. [37] showed in a PET study of human brain tumors that the initial uptake of 18F-Fmiso was perfusion-dependent, whereas late uptake was independent of perfusion. Thorwarth et al. [38] showed in a PET study of human head-and-neck cancers that hypoxia and perfusion were independent from each other but both affected radiation treatment outcome. Their data clearly illustrate the need for both perfusion and hypoxia measurements to investigate the tumor microenvironment. Although perfusion and hypoxia were found to be independent, their results emphasize the interaction of these parameters. The combined measurements of both hypoxia and perfusion were shown to be clinically predictive of outcome, whereas neither parameter alone was related to outcome. The clinical data cited support the validity and relevance of the preclinical data presented in this article because the tumor microenvironment in both preclinical and clinical studies demonstrates significant heterogeneity in perfusion and hypoxia. Thus, the potential utility of further clinical and preclinical studies to evaluate perfusion, hypoxia, and their relationship to outcome is warranted.
Bearing in mind the caveats listed above, the combination of DCE-MRI and 18F-Fmiso PET could be proposed as noninvasive clinical imaging tool in the evaluation of tumor prognosis, planning for radiation therapy or chemotherapy, and monitoring of treatment response. These noninvasive imaging modalities have particular promise because they provide not only anatomically but also clinically important functional information of the tumor microenvironment.
Supplementary Material
Acknowledgments
The authors thank Valerie A. Longo and Mihai Coman for their technical assistance, H. Carl Le for helpful discussions, and Shangde Cai and Eva Burnazi for the 18F-Fmiso production.
Abbreviations
- DAR
digital autoradiography
- DCE-MRI
dynamic contrast-enhanced magnetic resonance imaging
- Fmiso
fluoromisonidazole
- FOV
field of view
- FWHM
full-width half-maximum
- H&E
hematoxylin/eosin
- MRI
magnetic resonance imaging
- NA
number of averages
- NR
number of repetitions
- PET
positron emission tomography
- ST
slice thickness
- TE
echo time
- TR
repetition time
Footnotes
This research was supported by National Institutes of Health (NIH) grant no's. PO1 CA115675 and P50 CA86438. This publication acknowledges National Cancer Institute grant number P30 CA08748, which provides partial support for the Research Animal Resource Center, the Radiochemistry Core, and the Small-Animal Imaging Core at Memorial Sloan-Kettering Cancer Center (MSKCC), and the NIH Small-Animal Imaging Research Program (SAIRP) grant no. R24 CA83084, which provides partial support for the Small-Animal Imaging Core at MKSCC.
This article refers to supplementary materials, which are designated by Figures W1 and W2 and are available online at www.neoplasia.com.
References
- 1.Chaudary N, Hill RP. Hypoxia and metastasis in breast cancer. Breast Dis. 2006;26:55–64. doi: 10.3233/bd-2007-26105. [DOI] [PubMed] [Google Scholar]
- 2.Hockel M, Schlenger K, Mitze M, Schaffer U, Vaupel P. Hypoxia and radiation response in human tumors. Semin Radiat Oncol. 1996;6:3–9. doi: 10.1053/SRAO0060003. [DOI] [PubMed] [Google Scholar]
- 3.Vaupel P, Mayer A, Briest S, Hockel M. Hypoxia in breast cancer: role of blood flow, oxygen diffusion distances, and anemia in the development of oxygen depletion. Adv Exp Med Biol. 2005;566:333–342. doi: 10.1007/0-387-26206-7_44. [DOI] [PubMed] [Google Scholar]
- 4.Menon C, Fraker DL. Tumor oxygenation status as a prognostic marker. Cancer Lett. 2005;221:225–235. doi: 10.1016/j.canlet.2004.06.029. [DOI] [PubMed] [Google Scholar]
- 5.Dachs GU, Chaplin DJ. Microenvironmental control of gene expression: implications for tumor angiogenesis, progression, and metastasis. Semin Radiat Oncol. 1998;8:208–216. doi: 10.1016/s1053-4296(98)80046-5. [DOI] [PubMed] [Google Scholar]
- 6.Secomb TW, Hsu R, Braun RD, Ross JR, Gross JF, Dewhirst MW. Theoretical simulation of oxygen transport to tumors by three-dimensional networks of microvessels. Adv Exp Med Biol. 1998;454:629–634. doi: 10.1007/978-1-4615-4863-8_74. [DOI] [PubMed] [Google Scholar]
- 7.Haroon ZA, Peters KG, Greenberg CS, Dewhirst MW. Angiogenesis and oxygen transport in solid tumors. In: Teicher BA, editor. Antiangiogenic Agents in Cancer Therapy. Totowa, NJ: Humana Press Inc.; 1998. pp. 3–21. [Google Scholar]
- 8.Neeman M, Provenzale JM, Dewhirst MW. Magnetic resonance imaging applications in the evaluation of tumor angiogenesis. Semin Radiat Oncol. 2001;11:70–82. doi: 10.1053/srao.2001.18105. [DOI] [PubMed] [Google Scholar]
- 9.Koh WJ, Rasey JS, Evans ML, Grierson JR, Lewellen TK, Graham MM, Krohn KA, Griffin TW. Imaging of hypoxia in human tumors with [F-18] fluoromisonidazole. Int J Radiat Oncol Biol Phys. 1992;22:199–212. doi: 10.1016/0360-3016(92)91001-4. [DOI] [PubMed] [Google Scholar]
- 10.Casciari JJ, Graham MM, Rasey JS. A modeling approach for quantifying tumor hypoxia with [F-18]fluoromisonidazole PET time-activity data. Med Phys. 1995;22:1127–1139. doi: 10.1118/1.597506. [DOI] [PubMed] [Google Scholar]
- 11.Serganova I, Humm J, Ling C, Blasberg R. Tumor hypoxia imaging. Clin Cancer Res. 2006;12:5260–5264. doi: 10.1158/1078-0432.CCR-06-0517. [DOI] [PubMed] [Google Scholar]
- 12.Lee ST, Scott AM. Hypoxia positron emission tomography imaging with 18F-fluoromisonidazole. Semin Nucl Med. 2007;37:451–461. doi: 10.1053/j.semnuclmed.2007.07.001. [DOI] [PubMed] [Google Scholar]
- 13.Tofts PS. Modeling tracer kinetics in dynamic Gd-DTPA MR imaging. J Magn Reson Imaging. 1997;7:91–101. doi: 10.1002/jmri.1880070113. [DOI] [PubMed] [Google Scholar]
- 14.Kuhl CK, Mielcareck P, Klaschik S, Leutner C, Wardelmann E, Gieseke J, Schild HH. Dynamic breast MR imaging: are signal intensity time course data useful for differential diagnosis of enhancing lesions? Radiology. 1999;211:101–110. doi: 10.1148/radiology.211.1.r99ap38101. [DOI] [PubMed] [Google Scholar]
- 15.Ogawa S, Lee TM, Kay AR, Tank DW. Brain magnetic resonance imaging with contrast dependent on blood oxygenation. Proc Natl Acad Sci USA. 1990;87:9868–9872. doi: 10.1073/pnas.87.24.9868. [DOI] [PMC free article] [PubMed] [Google Scholar]
- 16.Sotak CH, Hees PS, Huang HN, Hung MH, Krespan CG, Raynolds S. A new perfluorocarbon for use in fluorine-19 magnetic resonance imaging and spectroscopy. Magn Reson Med. 1993;29:188–195. doi: 10.1002/mrm.1910290206. [DOI] [PubMed] [Google Scholar]
- 17.Procissi D, Claus F, Burgman P, Koziorowski J, Chapman JD, Thakur SB, Matei C, Ling CC, Koutcher JA. In vivo 19F magnetic resonance spectroscopy and chemical shift imaging of tri-fluoro-nitroimidazole as a potential hypoxia reporter in solid tumors. Clin Cancer Res. 2007;13:3738–3747. doi: 10.1158/1078-0432.CCR-06-1563. [DOI] [PubMed] [Google Scholar]
- 18.Mason RP, Antich PP, Babcock EE, Constantinescu A, Peschke P, Hahn EW. Non-invasive determination of tumor oxygen tension and local variation with growth. Int J Radiat Oncol Biol Phys. 1994;29:95–103. doi: 10.1016/0360-3016(94)90231-3. [DOI] [PubMed] [Google Scholar]
- 19.He Q, Shungu DC, van Zijl PC, Bhujwalla ZM, Glickson JD. Singlescan in vivo lactate editing with complete lipid and water suppression by selective multiple-quantum-coherence transfer (Sel-MQC) with application to tumors. J Magn Reson B. 1995;106:203–211. doi: 10.1006/jmrb.1995.1035. [DOI] [PubMed] [Google Scholar]
- 20.Jue T, Arias-Mendoza F, Gonnella NC, Shulman GI, Shulman RG. A 1H NMR technique for observing metabolite signals in the spectrum of perfused liver. Proc Natl Acad Sci USA. 1985;82:5246–5249. doi: 10.1073/pnas.82.16.5246. [DOI] [PMC free article] [PubMed] [Google Scholar]
- 21.Hylton N. Dynamic contrast-enhanced magnetic resonance imaging as an imaging biomarker. J Clin Oncol. 2006;24:3293–3298. doi: 10.1200/JCO.2006.06.8080. [DOI] [PubMed] [Google Scholar]
- 22.Egeland TA, Gaustad JV, Benjaminsen IC, Hedalen K, Mathiesen B, Rofstad EK. Assessment of fraction of hypoxic cells in human tumor xenografts with necrotic regions by dynamic contrast-enhanced MRI. Radiat Res. 2008;169:689–699. doi: 10.1667/RR1311.1. [DOI] [PubMed] [Google Scholar]
- 23.Isaacs JT, Isaacs WB, Feitz WF, Scheres J. Establishment and characterization of seven Dunning rat prostatic cancer cell lines and their use in developing methods for predicting metastatic abilities of prostatic cancers. Prostate. 1986;9:261–281. doi: 10.1002/pros.2990090306. [DOI] [PubMed] [Google Scholar]
- 24.Euhus DM, Hudd C, LaRegina MC, Johnson FE. Tumor measurement in the nude mouse. J Surg Oncol. 1986;31:229–234. doi: 10.1002/jso.2930310402. [DOI] [PubMed] [Google Scholar]
- 25.Humm JL, Ballon D, Hu YC, Ruan S, Chui C, Tulipano PK, Erdi A, Koutcher J, Zakian K, Urano M, et al. A stereotactic method for the three-dimensional registration of multi-modality biologic images in animals: NMR, PET, histology, and autoradiography. Med Phys. 2003;30:2303–2314. doi: 10.1118/1.1600738. [DOI] [PubMed] [Google Scholar]
- 26.Zhang M, Huang M, Le C, Zanzonico PB, Claus F, Kolbert KS, Martin K, Ling CC, Koutcher JA, Humm JL. Accuracy and reproducibility of tumor positioning during prolonged and multi-modality animal imaging studies. Phys Med Biol. 2008;53:5867–5882. doi: 10.1088/0031-9155/53/20/021. [DOI] [PMC free article] [PubMed] [Google Scholar]
- 27.Zanzonico P, Campa J, Polycarpe-Holman D, Forster G, Finn R, Larson S, Humm J, Ling C. Animal-specific positioning molds for registration of repeat imaging studies: comparative microPET imaging of F18-labeled fluoro-deoxyglucose and fluoro-misonidazole in rodent tumors. Nucl Med Biol. 2006;33:65–70. doi: 10.1016/j.nucmedbio.2005.07.011. [DOI] [PubMed] [Google Scholar]
- 28.Engelhardt EL, Schneider RF, Seeholzer SH, Stobbe CC, Chapman JD. The synthesis and radiolabeling of 2-nitroimidazole derivatives of cyclam and their preclinical evaluation as positive markers of tumor hypoxia. J Nucl Med. 2002;43:837–850. [PubMed] [Google Scholar]
- 29.Hoffmann U, Brix G, Knopp MV, Hess T, Lorenz WJ. Pharmacokinetic mapping of the breast: a new method for dynamic MR mammography. Magn Reson Med. 1995;33:506–514. doi: 10.1002/mrm.1910330408. [DOI] [PubMed] [Google Scholar]
- 30.Thorwarth D, Eschmann SM, Paulsen F, Alber M. A kinetic model for dynamic [18F]-Fmiso PET data to analyse tumour hypoxia. Phys Med Biol. 2005;50:2209–2224. doi: 10.1088/0031-9155/50/10/002. [DOI] [PubMed] [Google Scholar]
- 31.Thorndyke C, Meeker BE, Thomas G, Lakey WH, McPhee MS, Chapman JD. The radiation sensitivities of R3327-H and R3327-AT rat prostate adenocarcinomas. J Urol. 1985;134:191–198. doi: 10.1016/s0022-5347(17)47055-8. [DOI] [PubMed] [Google Scholar]
- 32.Hunjan S, Zhao D, Constantinescu A, Hahn EW, Antich PP, Mason RP. Tumor oximetry: demonstration of an enhanced dynamic mapping procedure using fluorine-19 echo planar magnetic resonance imaging in the Dunning prostate R3327-AT1 rat tumor. Int J Radiat Oncol Biol Phys. 2001;49:1097–1108. doi: 10.1016/s0360-3016(00)01460-7. [DOI] [PubMed] [Google Scholar]
- 33.Catana C, Procissi D, Wu Y, Judenhofer MS, Qi J, Pichler BJ, Jacobs RE, Cherry SR. Simultaneous in vivo positron emission tomography and magnetic resonance imaging. Proc Natl Acad Sci USA. 2008;105:3705–3710. doi: 10.1073/pnas.0711622105. [DOI] [PMC free article] [PubMed] [Google Scholar]
- 34.Judenhofer MS, Wehrl HF, Newport DF, Catana C, Siegel SB, Becker M, Thielscher A, Kneilling M, Lichy MP, Eichner M, et al. Simultaneous PET-MRI: a new approach for functional and morphological imaging. Nat Med. 2008;14:459–465. doi: 10.1038/nm1700. [DOI] [PubMed] [Google Scholar]
- 35.Schlemmer HP, Pichler BJ, Krieg R, Heiss WD. An integrated MR/PET system: prospective applications. Abdom Imaging. 2008 doi: 10.1007/s00261-008-9450-2. [DOI] [PMC free article] [PubMed] [Google Scholar]
- 36.Schlemmer HP, Pichler BJ, Schmand M, Burbar Z, Michel C, Ladebeck R, Jattke K, Townsend D, Nahmias C, Jacob PK, et al. Simultaneous MR/PET imaging of the human brain: feasibility study. Radiology. 2008;248:1028–1035. doi: 10.1148/radiol.2483071927. [DOI] [PubMed] [Google Scholar]
- 37.Bruehlmeier M, Roelcke U, Schubiger PA, Ametamey SM. Assessment of hypoxia and perfusion in human brain tumors using PET with 18F-fluoromisonidazole and 15O-H2O. J Nucl Med. 2004;45:1851–1859. [PubMed] [Google Scholar]
- 38.Thorwarth D, Eschmann SM, Scheiderbauer J, Paulsen F, Alber M. Kinetic analysis of dynamic 18F-fluoromisonidazole PET correlates with radiation treatment outcome in head-and-neck cancer. BMC Cancer. 2005;5:152. doi: 10.1186/1471-2407-5-152. [DOI] [PMC free article] [PubMed] [Google Scholar]
Associated Data
This section collects any data citations, data availability statements, or supplementary materials included in this article.


