Abstract
Oral cancer is the eighth most common cancer worldwide and represents a significant disease burden. If detected at an early stage, survival from oral cancer is better than 90% at 5 years, whereas late stage disease survival is only 30%. Therefore, there is an obvious clinical utility for novel metabolic markers that help to diagnose oral cancer at an early stage and to monitor treatment response. In the current study, blood samples of oral cancer patients were analyzed using nuclear magnetic resonance spectroscopy to derive a metabolic signature for oral cancer. Using multivariate chemometric analysis, we obtained an excellent discrimination between serum samples from cancer patients and from a control group and could also discriminate between different stages of disease. The metabolic profile obtained for oral cancer is significant, even for early stage disease and relatively small tumors. This suggests a systemic metabolic response to cancer, which bears great potential for early diagnosis.
Introduction
Oral squamous cell carcinoma (OSCC) is the eighth most common cancer worldwide and represents a well-defined subgroup of head and neck cancer [1,2]. It has a 5-year mortality of 45% to 60% dependent on the setting and patient group, and the disease is frequently associated with tobacco smoking and excessive alcohol intake [3,4]. The main treatment of OSCC is radical surgery. High-stage disease frequently requires postoperative adjuvant radiotherapy to “mop-up” residual disease and is therefore more distressing for patients and, unfortunately, less successful in survival when compared with treatment of low-stage disease. Whereas patients with high-stage tumors of larger size and higher metastatic potential have only a 30% chance of survival at 5 years, patients with low-stage cancer have an 80% to 90% chance of survival.
A high degree of clinical skill is required to detect OSCC, and this is not widely available. The development of detection methods (such as blood tests) that can act as a surrogate for a highly skilled clinical examination would allow detection of OSCC at an early stage as well as monitoring response to treatment and helping to identify residual disease after treatment. This would significantly improve survival as treatment of early stage disease has been shown to be more successful.
Nuclear magnetic resonance (NMR) spectroscopy is a commonly used analytical method to analyze the small molecule composition, that is, the metabolome, of body fluids such as urine and blood serum. Variations in metabolite concentrations have been associated with the biochemical status of organisms and reflect changes in metabolism arising from biologic conditions, including disease and response to chemical treatment. Recent studies demonstrate the applicability of NMR-based metabolomics using serum samples for the diagnosis and prognosis of disease [5–13].
Both 1H and 31P magnetic resonance spectroscopy have previously been used to identify metabolic signatures of squamous cell carcinoma compared with benign tumors and normal tissues [14–21]. Both in vivo and in vitro clinical studies have shown that the cholinecreatine ratio is significantly higher in OSCC than in normal tissue [18–20]. Analysis of squamous cell carcinoma cell line cultures was suggestive of rapid membrane biosynthesis due to increased cell proliferation [19]. Moreover, in vitro studies using two-dimensional (2D) correlated spectroscopy revealed that a variety of metabolites, such as alanine, glutathione, histamine, isoleucine, and leucine, were found at a higher concentration in tumor tissue compared with the normal tissue [19]. An NMR study of ex vivo tumor tissue found elevated concentrations of taurine, choline, glutamic acid, lactic acid, and lipids in squamous cell tissue compared with normal tissue [17].
Many solid tumors show an increased glycolytic metabolism, which has, in the case of OSCC, been associated with the overexpression of glucose transporters especially of Glut-1 [22]. This change in metabolism is commonly used to locate primary tumors and associated metastases using positron emission tomography by monitoring [18F]-2-fluoro-2-deoxy-d-glucose uptake [22]. Other authors have examined the role of advanced glycated end products (AGE) and increased levels of the AGE receptor (RAGE) in patients with diabetes mellitus type 2 and primary gingival carcinoma showing that RAGE expression is closely associated with the invasiveness of OSCC [23,24].
Here, we present a pilot study analyzing serum samples of a small number of patients with OSCC and normal control individuals to identify characteristic changes to metabolite profiles in patients with OSCC. This allowed us to probe the highly relevant question of whether early stage tumors with a size of <2 cm and therefore <0.005% of body mass can be detected using a metabolomics approach.
Materials and Methods
Patient Characteristics and Sample Collection
After ethical committee approval and written patient consent, samples of venous blood were collected from sequential patients with histologically confirmed OSCC at the University Hospital Birmingham NHS Foundation Trust, Birmingham, United Kingdom. Control samples were taken from normal donors who had no personal history of cancer. All samples were taken at around the same time during the day for each patient.
Samples were harvested by standard venepuncture, and 10 ml of blood was acquired and immediately transferred to a sterile universal container without anticoagulant. This was centrifuged at 3500 rpm for 5 minutes. The supernatant was removed in 1-ml aliquots, and samples were immediately quenched in liquid nitrogen until serum was frozen and later transferred to a -80°C freezer for storage.
Samples were harvested from 15 cancer patients: 5 males and 10 females of average age of 63.8 years. Patient characteristics, staging of disease, and other parameters are shown in Table 1. The UK average age for patients with oral cancer is 63.5 years, which is well represented by this study. There is an unexpectedly high proportion of females in this cohort; the national average is a ratio of 2:1 in favor of males. No significance is attached to the high proportion of females in the study population because the patients were taken from sequentially presenting patients in a single unit.
Table 1.
Age, Sex, Disease Stage, and Weight Changes of OSCC Patients.
| Sample | Age | Sex | Stage | Weight (kg) | Weight Change (kg) |
| Cancer patients | |||||
| B01 | 71 | F | IV | 63 | -6 |
| B02 | 46 | M | I | 00 | |
| B03 | 66 | F | II | 35 | -25 |
| B04 | 66 | F | I | 81 | |
| B05 | 56 | F | II | 70 | |
| B06 | 49 | F | IV | 47 | -20 |
| B07 | 84 | M | IV | 63 | |
| B08 | 72 | M | III | 68 | -10 |
| B09 | 69 | F | IV | 85 | |
| B10 | 63 | F | II | 82 | |
| B11 | 61 | F | I | 69 | |
| B12 | 52 | M | IV | 62 | |
| B13 | 75 | F | II | 74 | |
| B14 | 60 | M | II | 65 | |
| B15 | 67 | F | III | 79 | |
| Normal controls | |||||
| C01 | 40 | F | |||
| C02 | 46 | M | |||
| C03 | 49 | M | |||
| C04 | 55 | F | |||
| C05 | 56 | M | |||
| C06 | 57 | M | |||
| C07 | 60 | M | |||
| C08 | 62 | F | |||
| C09 | 72 | F | |||
| C10 | 77 | M |
Weight change, before surgical intervention.
Ten blood samples were harvested from normal healthy donors: six males and four females of average age of 57 years (Table 1). Tumors were staged according to standard American Joint Committee on Cancer classification for head and neck and oral cancer [25].
Sample Preparation
Approximately 0.5 ml of human serum was filtered (Nanosep 3K OMEGA; Pall Corporation, Ann Arbor, MI) at 4°C using a centrifuge at 10,000 rpm [26]. Three hundred twenty microliters of filtered serum was diluted adding 90 µl of distilled water. One hundred forty microliters of phosphate buffer 0.4 M containing 0.75% w/v sodium azide and 50 µl of 3.25 mM 3-(trimethylsilyl)propionate-2,2,3,3-d4 (TMSP; Cambridge Isotope Laboratories) in D2O (99.9% pure; GOSS Scientific Instruments Ltd, Essex, UK) were added to the filtered serum. The final pH of the solution was adjusted to 7.0 (± 0.1). The sample transferred to the NMR tube contained 600 µl of filtered serum.
Nuclear Magnetic Resonance Data Acquisition
One-dimensional (1D) 1H and 2D 1H J-resolved (JRES) NMR spectra [27] were acquired using a 500-MHz Bruker spectrometer (Bruker Biospin, Rheinstetten, Germany) equipped with a cryogenically cooled probe at 303.15 K. Proton spectra were referenced to the TMSP signal (δ 0.00 ppm). In both pulse sequences, the water resonance was suppressed using excitation sculpting [28]. One-dimensional spectra were acquired using a 60° flip angle, a 5-kHz spectral width, and a relaxation delay of 3 seconds; 128 transients were collected with 16,384 data points and eight dummy scans. Two-dimensional JRES spectra were collected using a double spin-echo sequence with 16 transients per increment at 32 increments. Strong coupling artifacts were suppressed by phase cycling [29]. Two-dimensional COSY experiments were carried out using an 800-MHz Varian spectrometer (Varian, Palo Alto, CA) equipped with a cryogenically cooled probe using a gradient-selected coherence transfer pathway (gCOSY45 [30]) with 16 transients of 8192 complex data points, 256 increments, and a spectral width of 8 kHz in both dimensions.
Nuclear Magnetic Resonance Data Processing and Postprocessing
Nuclear magnetic resonance data were processed using NMRLab [31] and MetaboLab (U. Günther, unpublished software) in the MATLAB (The Math Works, Inc., Natick, MA) programming environment. Postprocessing included scaling, alignment, exclusion of water and TMSP signals, binning at 0.005 ppm, and application of a generalized log transformation [32] to enhance small signals in the spectrum.
Before Fourier transformation, 2D JRES were multiplied by a combined sine-bell/exponential window function in the direct dimension and by a sine bell function in the incremented dimension [33]. The spectra were processed and tilted in frequency space by 45°; projections were calculated after tilting and symmetrizing using NMRLab [31] to simplify 1D spectra and to reduce peak congestion. Alternatively, we also recovered coupled 1D spectra by omitting the 45° rotation for metabolite identification using the Chenomx NMR Suite software (version 5; Chenomx Inc., Edmonton, Canada).
Statistical Analysis
Unsupervised (principal component analysis, PCA) and supervised (PLS-DA) multivariate analyses in PLS-Toolbox (Version 4.1; Eigenvector Research, Manson, WA) were used for statistical data analysis. Cross-validation applying the “Venetian blind” algorithm has been used for all PLS-DA analyses.Metabolites were identified from loadings plots using the Chenomx NMR Suite software (version 5; Chenomx Inc.).
Results
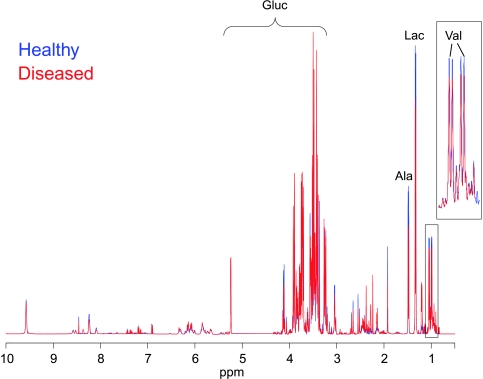
Figure 1 depicts the superimposition of two representative 1H NMR spectra (projections of JRES spectra), which show the average signals from healthy (blue line) and diseased (red line) subjects. The spectra are dominated by the resonances of carbohydrates, in particular, both anomeric forms of glucose (∼3–5.5 ppm, Gluc) and some of the intermediate metabolites of the glycolytic pathway, such as lactate (δ 1.33 and 4.11 ppm, Lac). Other compounds such as amino acids, in particular, valine (Val, 0.9–1.1 ppm) and alanines (Ala, 1.46 ppm), show large methyl signals in the spectrum. Smaller contributions to the spectrum are often more relevant to the analysis and are enhanced by applying a generalized log transformation (Figure 1) [32].
Figure 1.
Superimposition of two representative 1H NMR spectra (projections of JRES spectra), which show the average signals from the serum samples of healthy subjects (blue line) and patients with disease (red line) after application of a generalized log transformation. Predominant metabolite resonances are labeled on the spectrum. Ala indicates alanine; Gluc, glucose; Lac, lactate; Val, valine.
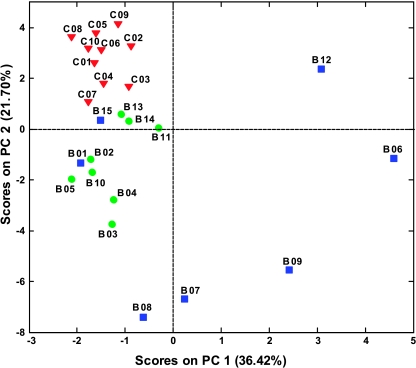
One-dimensional and 2D JRES NMR spectra were recorded for filtered blood sera from patients with head and neck cancers and from a control group of healthy volunteers. Two-dimensional JRES spectra were used to visualize both chemical shifts and scalar couplings along different spectral dimensions and increase peak dispersion and therefore metabolite specificity in 1D projections [34]. Principal component analysis applied to 1D projections is depicted in Figure 2 and shows a clear separation between samples from healthy subjects and OSCC patients. Samples from patients with the disease group geared toward smaller or negative values of PC2; samples from higher stage disease also spread out toward higher positive values of PC1. Furthermore, the PCA result shows clustering according to the stage of disease; samples B06, B07, B08, B09, and B12 are from patients with stages III and IV disease, with associated metastasis, and are observed at higher absolute values of PC1 and PC2. Samples B01 and B15 represent an exception to good separation of low- and high-stage disease, which, in the case of B01, can be attributed to the small size of the tumor that was classified as high-stage IV because it had invaded the locally adjacent bony structures although there was no indication of metastatic disease. Therefore, PCA not only differentiates disease and control samples but also shows significant potential to distinguish early and late stage disease with high specificity.
Figure 2.
Principal components analysis scores plot of 1H NMR spectra of human blood sera from OSCC patients (●) and from healthy controls (▼).
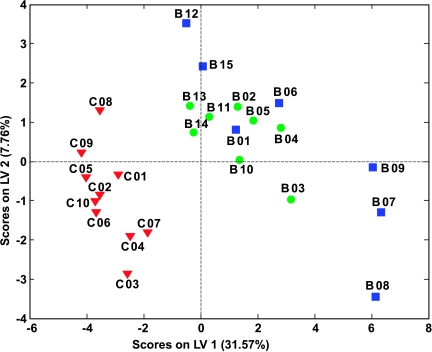
To obtain a more objective statistical estimation and specific loadings, we used PLS-DA for a model discriminating samples from cancer patients and controls (Figure 3). In this case, the sensitivity and specificity for oral cancer detection are both >95% (see receiver operating characteristic curves in Figure W1) after applying the Venetian blind algorithm for cross-validation. Despite limited statistical significance owing to a small number of samples, this result is remarkable considering that some early stage tumors were below 0.005% of the overall body mass.
Figure 3.
PLS-DA scores plot of 1H NMR spectra of human blood sera using two classes: OSCC patients (● early and ■ late stage diseases) and healthy controls (▼).
To probe for a possible bias arising from other factors, we probed the ensemble of data for the influence of age and sex. Both factors do not cluster in the unsupervised PCA. Therefore, PLS-DA analyses were used to build models for disease, age, and sex. In this analysis, a substantially less-pronounced clustering and a lower degree of specificity and sensitivity were observed for age and sex compared with disease versus control (see receiver operating characteristic curves in Figures W1–W3).
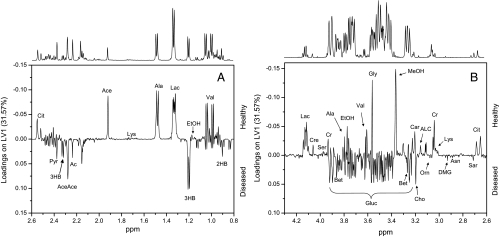
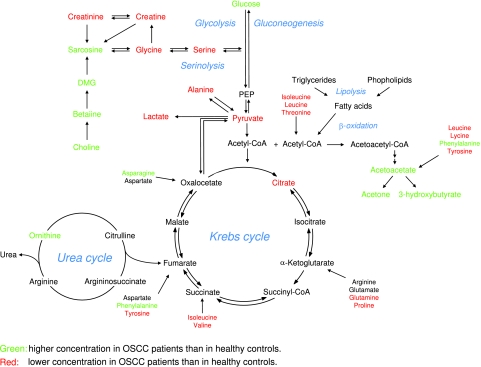
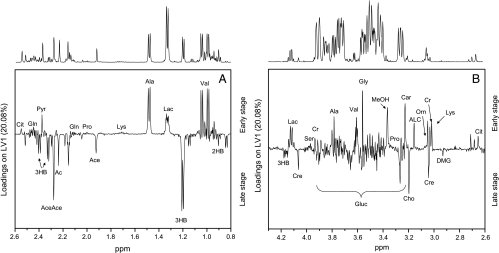
Loadings plots were calculated from PLS-DA models to identify discriminatory metabolites for different models. Figure 4, A and B, shows different areas of loadings in the first latent variable of PLS-DA, with positive values representing healthy controls and negative values representing patients with disease. In the samples from cancer patients, the levels of valine, ethanol, lactate, alanine, acetate, citrate, phenylalanine, tyrosine, methanol, formaldehyde, and formic acid were reduced compared with those of healthy controls, whereas signals arising from glucose, pyruvate, acetone, acetoacetate, 3-hydroxybutyrate and 2-hydroxybutyrate, choline, betaine, and, to a lesser degree, dimethylglycine, sarcosine, asparagine, and ornithine showed enhanced loadings. In the aromatic region, additional contributions arise from yet unidentified metabolites. These contributions were summarized in metabolic pathways shown in Figure 5. To avoid possible errors arising from PLS-DA for a small sample size, we compared these results with differences of average late and early stage spectra, which gave the same results.
Figure 4.
Loadings plots for the first principal component for different regions of the spectrum. A representative NMR spectrum of human serum from an OSCC patient is shown above the loadings plots. Signals representing the most relevant discriminatory metabolites of healthy individuals (positive loadings) and OSCC patients (negative loadings) are labeled (A and B). 2HB indicates 2-hydroxybutyrate; 3HB, 3-hydroxybutyrate; Ac, acetone; Ace, acetate; AceAce, acetoacetate; ACL, acetyl-l-carnitine; Ala, alanine; Asn, asparagine; Bet, betaine; Car, carnitine; Cho, choline; Cit, citrate; Cr, creatine; Cre, creatinine; DMG, dimethylglycine; EtOH, ethanol; Gln, glutamine; Gluc, glucose; Gly, glycine; Lac, lactate; Lys, lysine; MeOH,methanol; Orn, ornithine; Pro, proline; Pyr, pyruvate; Sar, sarcosine; Ser, serine; Val, valine.
Figure 5.
Schematic representation of the most relevant metabolic differences between oral cancer patients and healthy controls.
To identify the metabolites that are responsible for the distinction between different stages of disease, PLS-DA models using only samples from patients with disease were built (not shown). Loadings plots from latent variable 1 are displayed in Figure 6, A and B, showing similar patterns as for the distinction between patients with disease and healthy controls (Figure 4, A and B). In samples from patients with late stage disease, the levels of 2-hydroxybutyrate, 3-hydroxybutyrate, acetone, acetate, acetoacetate, creatinine, asparagine, glucose, dimethylglycine, betaine, and choline were remarkably increased compared with patients with early stage disease, whereas valine, lactate, alanine, pyruvate, lysine, creatine, acetyl-l-carnitine, and carnitine showed reduced concentrations (Figure 6, A and B). In addition, a model using three classes (healthy controls and patients with early and late stage diseases) is shown in Figure W4. The application of this multivariate chemometric model shows a clear separation between the samples from healthy controls and patients with disease. Very narrow groupings are observed for the control samples and the patients with early stage disease. On the contrary, the sera of patients with late stage disease are more widely spread in the scores plot highlighting the higher inhomogeneity of their metabolic profile.
Figure 6.
Loadings plots (latent variables) from a PLS-DA analysis of OSCC patients showing metabolites that discriminate between early (positive loadings) and late stage diseases (negative loadings). A representative NMR spectrum of human serum from an OSCC patient is shown above the loadings plots.
Discussion
This study shows an unexpectedly strong metabolic profile in blood sera of patients with OSCC with a significant signature even for low-stage tumors. Subsequent analysis of metabolite profiles of serum samples from oral cancer patients can distinguish patients with disease from healthy normal controls and can also discriminate patients with high- and low-stage diseases and provide a fingerprint of metabolic changes. Although the statistical relevance of this study is limited by the small number of samples, a strong signature was obtained using an unbiased and unsupervised PCA. This is an astonishing result considering the relatively small size of the tumors (less than 0.005% of total body mass for early stages) and the fact that some patients (B02, B03, B04, B05, B10, B11, B13, and B14) had localized tumors without metastasis or only small locoregional metastasis. Sensitivity and specificity were both remarkably high for the detection of disease. Discrimination between disease stages in PCA was also remarkable with only two samples from patients with stages IV and III disease (B01 and B15) clustering with low-stage samples. For B01, this has been attributed to the fact that the tumor was small but had invaded the locally adjacent bony structures, although there was no indication of metastatic disease. Based solely on size and in absence of the bony invasion, this tumor would have been classified as stage I or II. Many believe such upstaging to be incorrect, and certainly, this tumor was biologically more similar to low-stage disease and may explain why it clustered with the other low-stage tumors.
Because blood serum represents the effects of metabolism in different organs, it is difficult to assign a metabolic fingerprint to specific metabolic processes. Nevertheless, changes in blood serum metabolite concentrations of patients with OSCC clearly point to an altered energy metabolism. The relatively high level of glucose and low level of lactate is strikingly different to observations in other types of cancer where, commonly, lactate levels are high [10,35]. It is unlikely that the high level of glucose can be ascribed to any other disorder because none of the patients was diagnosed with any other medical condition leading to elevated glucose. It is possible that the levels of glucose may be linked to the unique behavior of oral cancer, which interferes with the ability of insulin to modulate the uptake of glucose and thus regulates consequent energy metabolism favoring the accumulation of carbohydrates and the process of ketogenesis [36–39]. Several potential precursors of glucose in gluconeogenesis, such as lactate, alanine, and other gluconeogenic amino acids [40–42], were found at lower concentrations in patients with head and neck cancer. This clearly points to an altered energy metabolism, although it is not possible to assign changes to specific pathways considering that blood samples represent a cross-section of metabolic events in multiple organs.
The increased level of ketone bodies can be linked to lipolysis as a backup mechanism for energy production. This signature cannot be a consequence of fasting because all patients with OSCC received optimal nutrition according to a standard protocol of calorific requirement. Enteral tube feeding was used if patients were unable to swallow. Moreover, of the 15 patients, only 2 had lost significant amounts of weight (B03 and B06) and 2 others showed moderate weight loss (B01 and B08). Importantly, samples from these patients were grouped according to the disease stage with the already discussed exception of B01. This shows that the cancer signature dominates in these samples.
Furthermore, several Krebs cycle intermediates such as citrate, succinate, and formate were less concentrated in patients with disease suggesting a suppressed Krebs cycle. This represents a typical signature in cancer patients, and it has been previously associated with the “Warburg effect” [43], which assumes that tumors rely on glycolysis as a main source of energy, even in the presence of oxygen.
Elevated levels of 2-hydroxybutyrate may be associated with protein and amino acid catabolism. This is also supported by vastly altered amino acid profiles of head and neck cancer patients. For example, ornithine and asparagine levels were higher in oral cancer patients than in control samples. This result is in agreement with previous observations where blood plasma free amino acid pattern profiles were diagnostically correlated with the organ site for three different types of malignant tumors [44]. Ornithine represents a metabolite found in the urea cycle, which can use amino acid breakdown products to feed into the Krebs cycle. Besides ornithine, the blood levels of most essential and nonessential amino acids (such as threonine, valine, isoleucine, leucine, glycine, tyrosine, and phenylalanine) were found to be lower in the cancer patients. A significant decrease in blood plasma threonine and glycine has previously been reported at the early stage of head and neck cancer [44,45] but has been attributed to dysphagia and consequent insufficient food intake rather than to the disease itself. However, this is an unlikely cause in the present study because optimal nutrition was ensured for all patients.
In agreement with previous reports analyzing OSCC tumor samples [16,18,19], serum samples showed creatine to be low, creatinine to be high, and choline-creatine ratios to be high. Choline and its derivatives represent important constituents in phospholipid metabolism of cell membranes [46] and have been previously identified as markers of cellular proliferation. In the context of the metabolite profile associated with OSCC in this study, choline, together with betaine, dimethylglycine, carnitine, and acetyl carnitine, allows a distinct differentiation between early and late stage diseases.
In summary, patients with OSCC show a distinct signature of altered energy metabolism in blood serum, which includes altered lipolysis (an accumulation of ketone bodies), a distorted Krebs cycle, and amino acid catabolism. Most of the observed effects are more pronounced in late stage OSCC, and some metabolites show specific changes in the later stages of disease. Such measurements might revolutionize cancer treatment if early stage disease can be detected equally well in other cancers and if the obtained signatures show specificity for the individual type of disease.
Supplementary Material
Acknowledgments
The authors thank Christian Ludwig and Alessia Lodi for help with NMR experiments and for fruitful discussions, respectively. The authors are indebted to Chenomx for use of their metabolomics software.
Footnotes
The authors thank the EU for supporting S.T. in the context of the MOTET Marie Curie project. The authors also thank the Wellcome Trust and the EU in the context of the EU-NMR grant (RII3-026145) for supporting the HWB-NMR facility in Birmingham.
This article refers to supplementary materials, which are designated by Figures W1 to W4 and are available online at www.neoplasia.com.
References
- 1.Boyle P, Ferlay J. Cancer incidence and mortality in Europe, 2004. Ann Oncol. 2005;16:481–488. doi: 10.1093/annonc/mdi098. [DOI] [PubMed] [Google Scholar]
- 2.Ferlay J, Autier P, Boniol M, Heanue M, Colombet M, Boyle P. Estimates of the cancer incidence and mortality in Europe in 2006. Ann Oncol. 2007;18:581–592. doi: 10.1093/annonc/mdl498. [DOI] [PubMed] [Google Scholar]
- 3.Brandwein-Gensler M, Teixeira MS, Lewis CM, Lee B, Rolnitzky L, Hille JJ, Genden E, Urken ML, Wang BY. Oral squamous cell carcinoma: histologic risk assessment, but not margin status, is strongly predictive of local disease-free and overall survival. Am J Surg Pathol. 2005;29:167–178. doi: 10.1097/01.pas.0000149687.90710.21. [DOI] [PubMed] [Google Scholar]
- 4.Carvalho AL, Nishimoto IN, Califano JA, Kowalski LP. Trends in incidence and prognosis for head and neck cancer in the United States: a site-specific analysis of the SEER database. Int J Cancer. 2005;114:806–816. doi: 10.1002/ijc.20740. [DOI] [PubMed] [Google Scholar]
- 5.Beckwith-Hall BM, Thompson NA, Nicholson JK, Lindon JC, Holmes E. A metabonomic investigation of hepatotoxicity using diffusion-edited H-1 NMR spectroscopy of blood serum. Analyst. 2003;128:814–818. doi: 10.1039/b302360p. [DOI] [PubMed] [Google Scholar]
- 6.Brindle JT, Nicholson JK, Schofield PM, Grainger DJ, Holmes E. Application of chemometrics to H-1 NMR spectroscopic data to investigate a relationship between human serum metabolic profiles and hypertension. Analyst. 2003;128:32–36. doi: 10.1039/b209155k. [DOI] [PubMed] [Google Scholar]
- 7.Carraro S, Rezzi S, Reniero F, Heberger K, Giordano G, Zanconato S, Guillou C, Baraldi E. Metabolomics applied to exhaled breath condensate in childhood asthma. Am J Respir Crit Care Med. 2007;175:986–990. doi: 10.1164/rccm.200606-769OC. [DOI] [PubMed] [Google Scholar]
- 8.Duarte IF, Goodfellow BJ, Barros A, Jones JG, Barosa C, Diogo L, Garcia P, Gill AM. Metabolic characterisation of plasma in juveniles with glycogen storage disease type 1a (GSD1a) by high-resolution H-1 NMR spectroscopy. NMR Biomed. 2007;20:401–412. doi: 10.1002/nbm.1073. [DOI] [PubMed] [Google Scholar]
- 9.Makinen VP, Soininen P, Forsblom C, Parkkonen M, Ingman P, Kaski K, Groop PH, Ala-Korpela M. Diagnosing diabetic nephropathy by H-1 NMR metabonomics of serum. Magn Reson Mat Phys Biol Med. 2006;19:281–296. doi: 10.1007/s10334-006-0054-y. [DOI] [PubMed] [Google Scholar]
- 10.Odunsi K, Wollman RM, Ambrosone CB, Hutson A, McCann SE, Tammela J, Geisler JP, Miller G, Sellers T, Cliby W, et al. Detection of epithelial ovarian cancer using H-1-NMR-based metabonomics. Int J Cancer. 2005;113:782–788. doi: 10.1002/ijc.20651. [DOI] [PubMed] [Google Scholar]
- 11.Stubbs M, Robinson SP, Hui C, Price NM, Rodrigues LM, Howe FA, Griffiths JR. The importance of tumor metabolism in cancer prognosis and therapy; pre-clinical studies on rodent tumors with agents that improve tumor oxygenation. Oxford, England: Pergamon-Elsevier Science Ltd; 2002. pp. 131–141. [DOI] [PubMed] [Google Scholar]
- 12.Tsang TM, Huang JTJ, Holmes E, Bahn S. Metabolic profiling of plasma from discordant schizophrenia twins: correlation between lipid signals and global functioning in female schizophrenia patients. J Proteome Res. 2006;5:756–760. doi: 10.1021/pr0503782. [DOI] [PubMed] [Google Scholar]
- 13.Whitehead TL, Kieber-Emmons T. Applying in vitro NMR spectroscopy and H-1 NMR metabonomics to breast cancer characterization and detection. Prog Nucl Magn Reson Spectrosc. 2005;47:165–174. [Google Scholar]
- 14.Adalsteinsson E, Spielman DM, Pauly JM, Terris DJ, Sommer G, Macovski A. Feasibility study of lactate imaging of head and neck tumors. NMR Biomed. 1998;11:360–369. doi: 10.1002/(sici)1099-1492(1998110)11:7<360::aid-nbm518>3.0.co;2-p. [DOI] [PubMed] [Google Scholar]
- 15.Arias-Mendoza F, Payne GS, Zakian KL, Schwarz AJ, Stubbs M, Stoyanova R, Ballon D, Howe FA, Koutcher JA, Leach MO, et al. In vivo P-31 MR spectral patterns and reproducibility in cancer patients studied in a multi-institutional trial. NMR Biomed. 2006;19:504–512. doi: 10.1002/nbm.1057. [DOI] [PubMed] [Google Scholar]
- 16.Bezabeh T, Odlum O, Nason R, Kerr P, Sutherland D, Patel R, Smith ICP. Prediction of treatment response in head and neck cancer by magnetic resonance spectroscopy. Am J Neuroradiol. 2005;26:2108–2113. [PMC free article] [PubMed] [Google Scholar]
- 17.El-Sayed S, Bezabeh T, Odlum O, Patel R, Ahing S, MacDonald K, Somorjai RL, Smith ICP. An ex vivo study exploring the diagnostic potential of H-1 magnetic resonance spectroscopy in squamous cell carcinoma of the head and neck region. Head Neck J Sci Spec. 2002;24:766–772. doi: 10.1002/hed.10125. [DOI] [PubMed] [Google Scholar]
- 18.Maheshwari SR, Mukherji SK, Neelon B, Schiro S, Fatterpekar GM, Stone JA, Castillo M. The choline/creatine ratio in five benign neoplasms: comparison with squamous cell carcinoma by use of in vitro MR spectroscopy. Am J Neuroradiol. 2000;21:1930–1935. [PMC free article] [PubMed] [Google Scholar]
- 19.Mukherji SK, Schiro S, Castillo M, Kwock L, Muller KE, Blackstock W. Proton MR spectroscopy of squamous cell carcinoma of the extracranial head and neck: in vitro and in vivo studies. Am J Neuroradiol. 1997;18:1057–1072. [PMC free article] [PubMed] [Google Scholar]
- 20.Star-Lack JM, Adalsteinsson E, Adam MF, Terris DJ, Pinto HA, Brown JM, Spielman DM. In vivo H-1 MR spectroscopy of human head and neck lymph node metastasis and comparison with oxygen tension measurements. Am J Neuroradiol. 2000;21:183–193. [PMC free article] [PubMed] [Google Scholar]
- 21.Yokota H, Guo JF, Matoba M, Higashi K, Tonami H, Nagao Y. Lactate, choline, and creatine levels measured by vitro H-1-MRS as prognostic parameters in patients with non-small-cell lung cancer. J Magn Reson Imaging. 2007;25:992–999. doi: 10.1002/jmri.20902. [DOI] [PubMed] [Google Scholar]
- 22.Kunkel M, Reichert TE, Benz P, Lehr HA, Jeong JH, Wieand S, Bartenstein P, Wagner W, Whiteside TL. Overexpression of Glut-1 and increased glucose metabolism in tumors are associated with a poor prognosis in patients with oral squamous cell carcinoma. Cancer. 2003;97:1015–1024. doi: 10.1002/cncr.11159. [DOI] [PubMed] [Google Scholar]
- 23.Bhawal UK, Ozaki Y, Nishimura M, Sugiyama M, Sasahira T, Nomura Y, Sato F, Fujimoto K, Sasaki N, Ikeda MA, et al. Association of expression of receptor for advanced glycation end products and invasive activity of oral squamous cell carcinoma. Oncology. 2005;69:246–255. doi: 10.1159/000087910. [DOI] [PubMed] [Google Scholar]
- 24.Ujpal M, Barabas J, Kovalszky I, Szabo G, Nemeth Z, Gabris K, Suba ZS. A preliminary comparative study of the prognostic implications of type 2 diabetes mellitus for patients with primary gingival carcinoma treated with surgery and radiation therapy. J Oral Maxillofac Surg. 2007;65:452–456. doi: 10.1016/j.joms.2006.09.015. [DOI] [PubMed] [Google Scholar]
- 25.Greene FL, Page DL, Fleming ID. AJCC Cancer Staging Manual. Philadelphia, PA: Lippincott Raven; 2002. [Google Scholar]
- 26.Tiziani S, Emwas AH, Lodi A, Ludwig C, Bunce CM, Viant MR, Gunther UL. Optimized metabolite extraction from blood serum for H-1 nuclear magnetic resonance spectroscopy. Anal Biochem. 2008;377:16–23. doi: 10.1016/j.ab.2008.01.037. [DOI] [PubMed] [Google Scholar]
- 27.Aue W, Karhan J, Ernst R. Homonuclear broad-band decoupling and 2-dimensional J-resolved NMR spectroscopy. J Chem Phys. 1976;64:4226–4227. [Google Scholar]
- 28.Hwang TL, Shaka AJ. Water suppression that works—excitation sculpting using arbitrary wave-forms and pulsed-field gradients. J Magn Reson A. 1995;112:275–279. [Google Scholar]
- 29.Thrippleton MJ, Edden RAE, Keeler J. Suppression of strong coupling artefacts in J-spectra. J Magn Reson. 2005;174:97–109. doi: 10.1016/j.jmr.2005.01.012. [DOI] [PubMed] [Google Scholar]
- 30.Hurd RE, John BK, Plant HD. Novel method for detection of purephase, double-absorption lineshapes in gradient-enhanced spectroscopy. J Magn Reson. 1991;93:666–670. [Google Scholar]
- 31.Gunther UL, Ludwig C, Ruterjans H. NMRLAB—advanced NMR data processing in MATLAB. J Magn Reson. 2000;145:201–208. doi: 10.1006/jmre.2000.2071. [DOI] [PubMed] [Google Scholar]
- 32.Parsons HM, Ludwig C, Gunther UL, Viant MR. Improved classification accuracy in 1- and 2-dimensional NMR metabolomics data using the variance stabilising generalised logarithm transformation. BMC Bioinformatics. 2007;8:234. doi: 10.1186/1471-2105-8-234. [DOI] [PMC free article] [PubMed] [Google Scholar]
- 33.Tiziani S, Lodi A, Ludwig C, Parsons HM, Viant MR. Effects of the application of different window functions and projection methods on processing of H-1 J-resolved nuclear magnetic resonance spectra for metabolomics. Anal Chim Acta. 2008;610:80–88. doi: 10.1016/j.aca.2008.01.030. [DOI] [PubMed] [Google Scholar]
- 34.Viant MR. Improved methods for the acquisition and interpretation of NMR metabolomic data. BMC Bioinformatics. 2003;310:943–948. doi: 10.1016/j.bbrc.2003.09.092. [DOI] [PubMed] [Google Scholar]
- 35.Morvan D, Demidem A. Metabolomics by proton nuclear magnetic resonance spectroscopy of the response to chloroethylnitrosourea reveals drug efficacy and tumor adaptive metabolic pathways. Cancer Res. 2007;67:2150–2159. doi: 10.1158/0008-5472.CAN-06-2346. [DOI] [PubMed] [Google Scholar]
- 36.Lai HS, Lee JC, Lee PH, Wang ST, Chen WJ. Plasma free amino acid profile in cancer patients. Semin Cancer Biol. 2005;15:267–276. doi: 10.1016/j.semcancer.2005.04.003. [DOI] [PubMed] [Google Scholar]
- 37.Newman E, Heslin MJ, Wolf RF, Pisters PWT, Brennan MF. The effect of insulin on glucose and protein metabolism in the forearm of cancer patients. Surg Oncol. 1992;1:257–267. doi: 10.1016/0960-7404(92)90086-z. [DOI] [PubMed] [Google Scholar]
- 38.Pisters PWT, Brennan MF. Amino-acid-metabolism in human cancer cachexia. Annu Rev Nutr. 1990;10:107–132. doi: 10.1146/annurev.nu.10.070190.000543. [DOI] [PubMed] [Google Scholar]
- 39.Pisters PWT, Cersosimo E, Rogatko A, Brennan MF. Insulin action on glucose and branched-chain amino-acid-metabolism in cancer cachexia—differential-effects of insulin. Surgery. 1992;111:301–310. [PubMed] [Google Scholar]
- 40.Bongaerts GPA, van Hatteren HK, Verhagen CAM, Wagener DJT. Cancer cachexia demonstrates the energetic impact of gluconeogenesis in human metabolism. Med Hypotheses. 2006;67:1213–1222. doi: 10.1016/j.mehy.2006.04.048. [DOI] [PubMed] [Google Scholar]
- 41.Lardy HA, Paetkau V, Walter P. Paths of carbon in gluconeogenesis and lipogenesis—role of mitochondria in supplying precursors of phosphoenol-pyruvate. Proc Natl Acad Sci USA. 1965;53:1410–1415. doi: 10.1073/pnas.53.6.1410. [DOI] [PMC free article] [PubMed] [Google Scholar]
- 42.Lowry SF, Foster DM, Norton JA, Berman M, Brennan MF. Glucose disposal and gluconeogenesis from alanine in tumor-bearing Fischer-344 rats. J Natl Cancer Inst. 1981;66:653–658. [PubMed] [Google Scholar]
- 43.Garber K. Energy boost: the Warburg effect returns in a new theory of cancer. J Natl Cancer Inst. 2004;96:1805–1806. doi: 10.1093/jnci/96.24.1805. [DOI] [PubMed] [Google Scholar]
- 44.Kubota A, Meguid MM, Hitch DC. Amino-acid profiles correlate diagnostically with organ site in 3 kinds of malignant-tumors. Cancer. 1992;69:2343–2348. doi: 10.1002/1097-0142(19920501)69:9<2343::aid-cncr2820690924>3.0.co;2-s. [DOI] [PubMed] [Google Scholar]
- 45.Ching N, Grossi C, Jham G, Angers J, Zurawinsky H, Ching CY, Nealon TF. Plasma amino-acid and serum unesterified fatty-acid deficits and the effect of nutritional support in chemotherapy treatment. Surgery. 1984;95:730–738. [PubMed] [Google Scholar]
- 46.Miller BL. A review of chemical issues in 1H NMR spectroscopy: N-acetyl-l-aspartate, creatine and choline. NMR Biomed. 1991;4:47–52. doi: 10.1002/nbm.1940040203. [DOI] [PubMed] [Google Scholar]
Associated Data
This section collects any data citations, data availability statements, or supplementary materials included in this article.


