Abstract
Tumor blood supply was related to the morphology of the tumor microvasculature and the supplying arteries (SAs) of A-07-GFP and D-12-GFP melanoma xenografts growing in window chamber preparations in BALB/c nu/nu mice. Blood supply and morphologic parameters were determined from first-pass imaging movies and vascular maps recorded after a bolus of 155-kDa tetramethylrhodamine isothiocyanate-labeled dextran had been administered intravenously. Poorly supplied tumors showed microvascular networks that did not differ from those of well-supplied tumors in vessel tortuosity, diameter, and density. Conversely, the SAs of poorly supplied tumors were more tortuous and had a smaller diameter than those of well-supplied tumors, resulting in lower plasma velocities in the downstream tumor vessels. Consequently, the blood supply of A-07-GFP and D-12-GFP tumors was governed by the geometric resistance of the SAs rather than by the geometric resistance or the vessel density of the tumor microvasculature. The present study suggests that the SAs may represent an important target for physiological interventions of tumors and that it may be beneficial to focus on the tumor SAs rather than the tumor microvasculature when searching for novel therapeutic strategies for modifying tumor blood supply.
Introduction
The physiological microenvironment of experimental and human tumors is distinctly different from that of normal tissues [1]. Tumors develop a highly heterogeneous microenvironment during growth, characterized by oxygen depletion, extracellular acidosis, elevated lactate levels, glucose deprivation, low energy status, and interstitial hypertension [2]. This hostile microenvironment causes resistance to treatment [3] and may promote malignant progression, invasive growth, and metastatic dissemination [4]. The physiological parameters of the tumor microenvironment are determined mainly by the blood supply, and the blood supply depends primarily on the vascular density, the geometric resistance to blood flow, and the viscosity of the blood [1,2,5,6].
The rate of blood flow in any vessel segment is proportional to the pressure difference between the arterial and venous sides and is inversely proportional to the viscous and geometric resistances [2,6]. When laminar flow through a circular, rigid tube can be assumed, the geometric resistance of a vessel segment is proportional to the segment length and inversely proportional to the segment diameter to the fourth power [6]. The diameter is thus the major determinant of geometric resistance in this simplified model. Tumor vessel segments, however, show severe morphologic abnormalities and are rarely circular rigid tubes. The morphologic abnormalities include contour irregularities (lacunalike, sinusoidal, and cystiform vessels), tortuosity (distorted, twisted, and bent vessels), and suboptimal dimensions (dilated and elongated vessels) [2], and the geometric resistance of tumor vessel segments is increased by contour irregularities and vessel tortuosity [2,7].
The geometric resistance of a network of vessels is a complex function of the geometric resistance of the individual vessel segments and the overall architecture of the network [6]. Tumor tissues develop vascular networks with severe architectural abnormalities, including limited arterial supply, heterogeneous vessel distribution, absent vessel hierarchy, increased intervessel distances, arteriovenous shunts, excessive branching, and blind vascular ends [2,3,8]. The fractal dimensions of tumor microvascular network have been shown to correspond closely to those produced by a statistical growth process known as invasion percolation [7]. Invasion percolation models the expansion of a network throughout a medium with randomly distributed heterogeneities in strength. The resulting network always expands into the weakest available sites, yielding a network with highly heterogeneous density and vascular pathways that are tortuous over many scales [7,9]. Calculations have indicated that the highly heterogeneous networks produced by invasion percolation have a higher resistance to flow than more regular networks [10]. The microvascular network of tumors is thus expected to show elevated geometric resistance to blood flow because of the abnormal architecture [2,7,9,11].
Experimental studies making use of ex vivo perfusion techniques have confirmed that the geometric resistance to blood flow is significantly higher in tumors than in normal tissues [12,13], and several morphologic and architectural parameters influencing the geometric resistance of tumor microvascular networks have been identified and quantitated [2,7,9,11,13]. Conversely, the significance of the geometric resistance of the arteries supplying tumors with blood has not been studied thus far. In the present work, tumors growing in mouse dorsal window chambers were subjected to detailed examinations of blood supply, vessel morphology, and vascular architecture. The intertumor heterogeneity in blood supply in human melanoma xenografts was found to be determined primarily by the geometric resistance of the tumor supplying arteries (SAs) rather than by the geometric resistance or the vessel density of the tumor microvascular network.
Materials and Methods
Mice
Adult (8–10 weeks of age) female BALB/c nu/nu mice, bred and maintained as described elsewhere [14], were used as host animals for dorsal window chamber preparations. The animal experiments were approved by the institutional committee on research animal care and were done according to the Interdisciplinary Principles and Guidelines for the Use of Animals in Research, Marketing, and Education (New York Academy of Sciences, New York, NY).
Cells and Multicellular Spheroids
A-07 and D-12 human melanoma cells [15] were constitutively transfected with green fluorescence protein (GFP) by lipofection. The transfected cells (A-07-GFP and D-12-GFP) were grown as monolayers in RPMI 1640 (25 mMHEPES and l-glutamine) supplemented with 13% bovine calf serum, 250 µg/ml penicillin, 50 µg/ml streptomycin, and 700 µg/ml (A-07-GFP) or 900 µg/ml (D-12-GFP) genetecin. Multicellular spheroids were produced and maintained by using a liquid-overlay culture technique [16]. Cell and spheroid cultures were incubated at 37°C in a humidified atmosphere of 5% CO2 in air and were subcultured twice a week.
Anesthesia
Window chamber implantation and intravital microscopy examinations were carried out with anesthetized mice. Fentanyl citrate (Janssen Pharmaceutica, Beerse, Belgium), fluanisone (Janssen Pharmaceutica), and midazolam (Hoffmann-La Roche, Basel, Switzerland) were administered intraperitoneally (i.p.) in doses of 0.63, 20, and 10 mg/kg, respectively. After surgery, the mice were given buprenorphine (Temgesic; Schering-Plough, Brussels, Belgium) i.p. in a dose of 0.12 mg/kg.
Window Chamber Preparations
Window chambers were implanted into the dorsal skin fold as described previously [17]. Briefly, the chamber consisted of two parallel frames, and after implantation, the frames sandwiched an extended double layer of skin. Before the chamber was implanted, a circular hole with a diameter of ∼6.0 mm was made in one of the skin layers. A plastic window with a diameter of 6.0 mm was attached to the frame on the surgical side with a clip to provide visual access to the fascial side of the opposite skin layer. Tumors were initiated by implanting A-07-GFP or D-12-GFP spheroids with a diameter of 100 to 200 µm onto the fascial side of the intact skin layer.
Intravital Microscopy
The mice were kept in a specially constructed holder that fixed the window chamber to the microscope stage during intravital microscopy. The body core temperature was kept at 37 to 38°C by using a hot air generator. Imaging was performed by using an inverted fluorescence microscope equipped with filters for green and red lights (IX-71; Olympus, Munich, Germany), a black and white CCD camera (C4742-95; Hamamatsu Photonics, Hamamatsu, Japan), and an appropriate image acquisition software (Wasabi; Hamamatsu Photonics). Tetramethylrhodamine isothiocyanate-labeled dextran (TRITC-dextran) with a molecular weight of 155 kDa (Sigma Aldrich, St. Louis, MO) was used as vascular tracer. A 0.2-ml bolus of TRITC-dextran (50 mg/ml) was injected into the lateral tail vein, and first-pass imaging movies were recorded at a frame rate of 18 frames per second (fps) by using a x1.25 objective lens, resulting in a time resolution of 55.6 milliseconds, a field of view of 6.89 x 5.51 mm2, and a pixel size of 10.8 x 10.8 µm2. Afterward, the entire vascular network was mapped by recording 9 to 16 single frames with a x4 objective lens, resulting in a field of view of 2.15 x 1.72 mm2 and a pixel size of 3.4 x 3.4 µm2. To investigate the reproducibility, A-07-GFP tumors were subjected to imaging twice. In these experiments, 0.05-ml boluses of TRITC-dextran (80 mg/ml) were injected, and first-pass imaging movies were recorded at a frame rate of 9 fps. All recordings were stored and analyzed offline.
Data Analysis
Two two-dimensional projected vascular masks were produced for each tumor (i.e., pixels within and outside the network were given the value of 1 and 0, respectively), one from the movies recorded with the x1.25 objective and the other from the images recorded with the x4 objective [18]. Blood supply time (BST) images were produced by assigning a BST value to each pixel of the low-magnification vascular masks. The BST of a pixel was defined as the time difference between the frame showing maximum fluorescence intensity in the pixel and the frame showing maximum fluorescence intensity in the main tumor SA, as described in detail previously [14]. Plasma velocities in vessel segments were calculated from the time lag in maximum fluorescence intensity along the segments [14]. The diameter and tortuosity of the tumor SAs were assessed from single frames of the first-pass imaging movies. The morphologic parameters of the tumor microvasculature were assessed from the high-magnification images and vascular masks. Vessel tortuosity (T) was defined as T (%) = (SL - S) · 100/SL, where SL represents the segment length (the distance between the branching points along the vessel) and S represent the shortest distance between the branching points (the distance between the branching points along a straight line). Median tortuosity of a vascular network was calculated from ∼100 randomly selected vessel segments. Vascular area fraction [no. of pixels (vascular mask)/no. of pixels (tumor)] and median vessel diameter were calculated as described earlier [18].
Statistical Analysis
The Spearman rank order correlation test was used to search for correlation between parameters. Statistical comparisons of data were carried out by nonparametric analysis using the Mann-Whitney rank sum test. Probability values of P < .05, determined from two-sided tests, were considered significant. The statistical analysis was performed by using the SigmaStat statistical software (SPSS Science, Chicago, IL).
Results
Sensitivity of the BST Assay
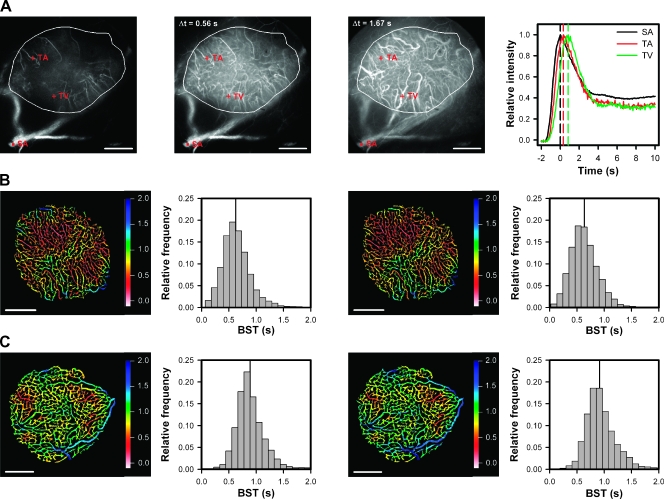
Three single frames from a representative first-pass imaging movie of an A-07-GFP tumor (encircled) are presented in Figure 1A. The first frame refers to the point of time when the TRITC-dextran bolus reached the main SA. The second frame was recorded ∼0.56 seconds after the first frame, and at that time, the bolus had reached most of the tumor capillaries. The third frame was recorded ∼1.67 seconds after the first frame and highlights some tumor venules (TVs) filled with TRITC-dextran. The graph shows relative fluorescence intensity versus time for a region of interest in the main SA and for single pixels in a tumor arteriole (TA) and a TV. Curves showing a well-defined peak were obtained for all vessel types in the tumors. The position of the peak differed among the vessels and reflected the time arterial blood needed to reach the different vessels. Accurate BST values could be determined for single pixels, and high-resolution BST images could be produced. Examinations of BST images (Figures 1, B and C, and 2, A and B) showed that the BST value changed gradually along vessel segments without discontinuities.
Figure 1.
(A) Three single frames from a representative first-pass imaging movie of an A-07-GFP tumor (encircled in white), and relative fluorescence intensity versus time for a region of interest in the main SA (black curve) and for single pixels in a TA (red curve) and a TV (green curve). The first frame refers to the point of time when the TRITC-dextran bolus reached the main SA. The second and the third frames were recorded 0.56 and 1.67 seconds after the first frame, when the bolus had reached most of the capillaries and most of the venules, respectively. (B, C) Blood supply time images and the corresponding BST frequency distributions derived from two imaging sessions of two A-07-GFP tumors differing in median BST (vertical lines), illustrating the reproducibility of the BST assay. Color bars, BST scale; scale bars, 1 mm.
Figure 2.
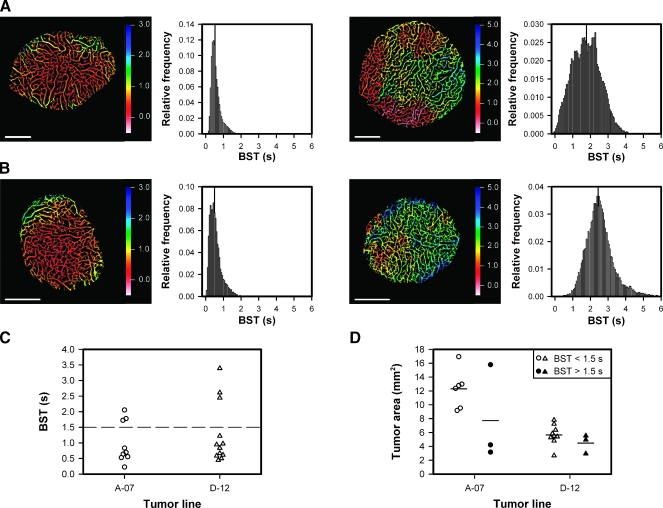
(A) Blood supply time image and the corresponding BST frequency distribution of an A-07-GFP tumor with low median BST (left) and an A-07-GFP tumor with high median BST (right). (B) Blood supply time image and the corresponding BST frequency distribution of a D-12-GFP tumor with low median BST (left) and a D-12-GFP tumor with high median BST (right). Color bars, BST scale; scale bars, 1 mm; vertical lines, median BST. (C) Median BST of A-07-GFP and D-12-GFP tumors. Points, individual tumors; dashed line, BST = 1.5 seconds, separating the tumors with low median BST from those with high median BST. (D) Area of A-07-GFP and D-12-GFP tumors with median BST < 1.5 seconds (open symbols) and A-07-GFP and D-12-GFP tumors with median BST > 1.5 seconds (closed symbols). Points, individual tumors; horizontal lines, mean tumor area.
Reproducibility of the BST Assay
To investigate the reproducibility of the BST assay, A-07-GFP tumors were subjected to first-pass imaging twice, with 20-minute intervals between the imaging sessions. The assay was found to be highly reproducible, as illustrated in Figure 1, B and C, which show the BST images and frequency distributions of two tumors differing in median BST. The intratumor heterogeneity in BST seen in the first image was reproduced in the second image (i.e., almost all vessel segments have the same color in the two images). The BST frequency distributions of the two tumors were significantly different, both in the first (P < .0001) and the second (P < .0001) imaging sessions, whereas the BST frequency distributions obtained in the two imaging sessions were not significantly different for any of the tumors (P > .05).
Individual Tumors Differ in BST
Blood supply time differed substantially among individual tumors, as illustrated in Figure 2, which shows the BST image and the corresponding BST frequency distribution of an A-07-GFP tumor with low BST values (Figure 2A, left), an A-07-GFP tumor with high BST values (Figure 2A, right), a D-12-GFP tumor with low BST values (Figure 2B, left), and a D-12-GFP tumor with high BST values (Figure 2B, right). Median BST of all tumors included in the study is shown in Figure 2C, illustrating that most of the tumors showed BST frequency distributions with median values <1.5 seconds. However, 3 of the 9 A-07-GFP tumors and 3 of the 12 D-12-GFP tumors showed significantly higher median BST values than the other tumors (P = .024 for A-07-GFP; P = .016 for D-12-GFP). Consequently, the plot in Figure 2C shows a clear gap among the 6 tumors with the highest BST values and the 15 tumors with the lowest BST values. On the basis of this observation, the tumors were divided into subgroups: those with a median BST above the gap and those with a median BST below the gap [i.e., tumors with low median BST (median BST < 1.5 seconds) and tumors with high median BST (median BST > 1.5 seconds)]. The size of the tumors is shown in Figure 2D, illustrating that two of the A-07-GFP tumors with high median BST were small and one was large compared with the A-07-GFP tumors with low median BST, whereas the three D-12-GFP tumors with high median BST did not differ in size from the nine D-12-GFP tumors with low median BST (P > .05). Taken together, these observations suggest that the intertumor differences in BST were not a consequence of differences in tumor size.
High Median BST Correlates with Low Plasma Velocity in Tumor SAs, TAs, and TVs
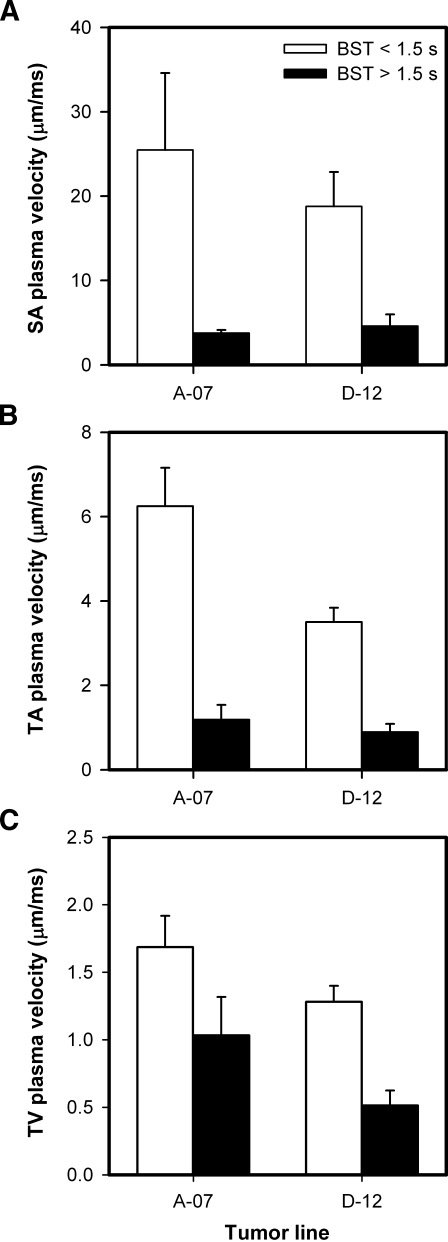
To identify the causes of the intertumor heterogeneity in BST, the plasma velocity was measured in all tumor SAs, three TAs, and three TVs. As illustrated in Figure 1A, the tumor SAs were located in the normal tissue surrounding the tumors, whereas the TAs and TVs were located within the tumor mass. The plasma velocity decreased gradually from the SAs to the venules, and was higher for the tumors with low median BST than for the tumors with high median BST, regardless of tumor line and vessel type (Figure 3). Interestingly, the difference in plasma velocity between the tumors with low and high median BST was highest for the tumor SAs [i.e., 6.8-fold (P = .023; A-07-GFP) and 4.1-fold (P = .016; D-12-GFP); Figure 3A], second highest for the TAs [i.e., 5.3-fold (P < .0001; A-07-GFP) and 3.9-fold (P < .0001; D-12-GFP); Figure 3B], and lowest for the TVs [i.e., 1.6-fold (P = .071; A-07-GFP) and 2.5-fold (P = .0014; D-12-GFP); Figure 3C].
Figure 3.
Plasma velocity in the SAs (A), TAs (B), and TVs (C) of A-07-GFP and D-12-GFP tumors with median BST < 1.5 seconds (open columns) and of A-07-GFP and D-12-GFP tumors with median BST > 1.5 seconds (filled columns). Columns and bars, mean ± SE of 8 to 27 vessels from three to nine tumors.
The SAs of Tumors with High BST Show High Geometric Resistance to Blood Flow
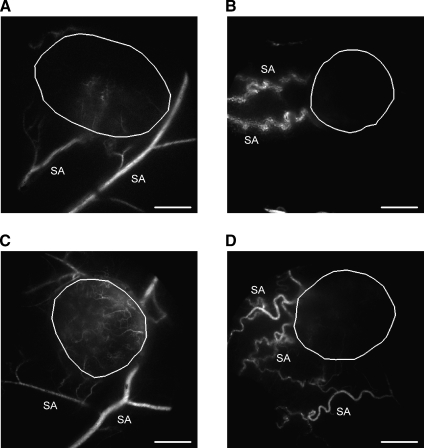
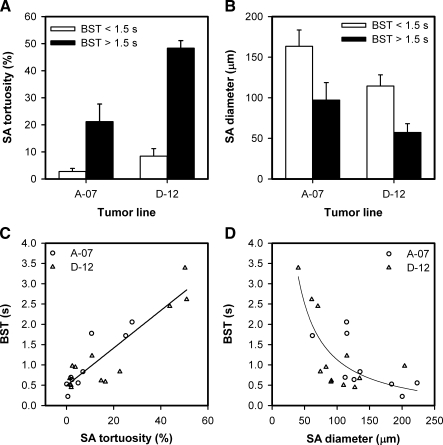
The arteries supplying the tumors with high median BST were highly tortuous compared with those supplying the tumors with low median BST. This is illustrated qualitatively in Figure 4, which shows a single frame from the first-pass imaging movie of an A-07-GFP tumor with low median BST (Figure 4A), an A-07-GFP tumor with high median BST (Figure 4B), a D-12-GFP tumor with low median BST (Figure 4C), and a D-12-GFP tumor with high median BST (Figure 4D). Quantitative studies showed that the tortuosity of the SAs was higher for the tumors with high median BST than for the tumors with low median BST (P = .024, A-07-GFP; P = .016, D-12-GFP; Figure 5A) and that the diameter of the SAs was smaller for the tumors with high median BST than for the tumors with low median BST (P = .095, A-07-GFP; P = .016, D-12-GFP; Figure 5B). Moreover, there were significant correlations between median BST and the tortuosity of the SAs (P < .0001; Figure 5C) and between median BST and the diameter of the SAs (P = .0080; Figure 5D). Qualitative or quantitative differences between A-07-GFP and D-12-GFP tumors were not detected.
Figure 4.
Single frames from first-pass imaging movies of an A-07-GFP tumor with low median BST (A), an A-07-GFP tumor with high median BST (B), a D-12-GFP tumor with low median BST (C), and a D-12-GFP tumor with high median BST (D), illustrating the position of the tumor (encircled in white) and the morphology of the tumor SAs. Scale bars, 1 mm.
Figure 5.
Mean tortuosity (A) and mean diameter (B) of the SAs of A-07-GFP and D-12-GFP tumors with median BST < 1.5 seconds (open columns) and A-07-GFP and D-12-GFP tumors with median BST > 1.5 seconds (filled columns). Columns and bars, mean ± SE of the mean values of three to nine tumors. (C, D) Median BST versus mean tortuosity (C) and mean diameter (D) of the SAs of A-07-GFP (circles) and D-12-GFP (triangles) tumors. Points, single tumors; lines, curves fitted to the data by regression analysis.
Median BST Is Not Correlated to the Geometric Resistance or the Vessel Density of the Tumor Microvascular Network
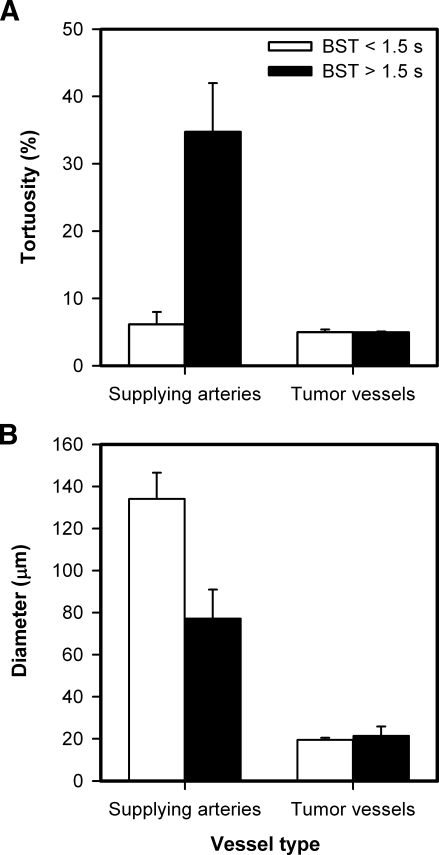
To study possible causes of the intertumor heterogeneity in BST further, median vessel tortuosity, median vessel diameter, and vascular area fraction were measured within the tumor microvascular networks. In contrast to the tumor SAs, the microvascular networks of the tumors with high and low median BST did not differ in vessel tortuosity (Figure 6A), vessel diameter (Figure 6B), or vascular area fraction (mean ± SE of 0.409 ± 0.006 vs 0.408 ± 0.017).
Figure 6.
Mean tortuosity of the SAs and median vessel tortuosity of the microvascular networks (A) and mean diameter of the SAs and median vessel diameter of the microvascular networks (B) of A-07-GFP and D-12-GFP tumors with median BST < 1.5 seconds (open columns) and A-07-GFP and D-12-GFP tumors with median BST > 1.5 seconds (filled columns). Columns and bars, mean ± SE (pooled data for the A-07-GFP and D-12-GFP tumors).
Discussion
Blood supply time and the plasma velocity of individual vessels were measured in window chamber preparations by using a novel first-pass imaging method [14,17,18]. The main advantage of the method is that the entire vascular network of transplanted tumors and the surrounding normal tissue can be examined at high spatial and temporal resolution in a single imaging sequence. The resolutions used here were sufficiently high to allow identification of most of the vessels, to measure the plasma flow velocity in the vessels, and to compute high-quality BST images. By combining this first-pass imaging method with high-resolution mapping of the microvascular network, novel studies of possible relationships between tumor blood supply and vascular morphology were possible.
By subjecting the same preparations to first-pass imaging twice, the BST assay was found to be highly reproducible. High reproducibility required that the physiological conditions of the host mice were not influenced significantly by the experimental procedure. Stable physiological conditions were achieved by keeping the body core temperature at 37 to 38°C with a hot air generator and using anesthetic doses verified not to alter tumor blood perfusion. Moreover, the volume of the TRITC-dextran bolus was minimized to avoid perturbing the systemic blood pressure. To examine whether the physiological conditions were influenced by the experimental procedure, the plasma flow velocity was measured retrospectively in a normal tissue reference vessel, as described by Brurberg et al. [17].
Most tumors develop an abnormal and hostile physiological microenvironment, primarily because of inadequate blood supply [2]. The inadequate blood supply has been attributed to low and heterogeneous microvascular density and high geometric resistance to blood flow in the tumor microvascular network [6,7]. A novel factor influencing tumor blood supply was identified in the present work. Our study revealed that the morphology of the tumor SAs may differ considerably among individual tumors growing in the same type of normal tissue and showed unequivocally that the blood supply of tumors is influenced significantly by the geometric resistance of these vessels.
Xenografted tumors of two melanoma lines were studied, and although the tumor-initiating spheroids were placed at approximately the same site relative to the preexisting vascular network in all chambers, significant intertumor heterogeneity in BST, and hence in blood supply, was seen in both lines. Moreover, the morphology of the SAs differed significantly among individual tumors, although they were located in the same type of normal tissue. The SAs of the tumors with low blood supply were more tortuous and had a smaller diameter than those of the tumors with high blood supply. High geometric resistance in the SAs correlated with low plasma velocity in these and the downstream vessels. Conversely, the microvascular networks of the tumors with high or low blood supply did not differ significantly in vessel tortuosity, diameter, and density. Consequently, the differences in blood supply between individual A-07-GFP and D-12-GFP tumors were primarily a consequence of differences in the geometric resistance of the SAs rather than differences in the geometric resistance or the vessel density of the tumor microvascular network.
Although the tumors were initiated from spheroids of approximately the same size in genetically identical mice, the morphology of the SAs differed significantly among individual tumors of the same line. These morphologic differences were most likely a result of stochastic processes as well as local variations in the concentration of proangiogenic and antiangiogenic factors secreted by the spheroids. A large number of angiogenesis activators and inhibitors have been identified [19], and it has been suggested that blood vessels may respond to some angiogenic factors by increasing the vessel diameter and to others by increasing the vessel length and tortuosity [20]. It has also been reported that antiangiogenic treatment of tumors may result in the emergence of tumor vessels with reduced leakiness, diameter, and tortuosity, a phenomenon termed tumor vessel normalization [21]. Interestingly, A-07-GFP and D-12-GFP tumors differ significantly in angiogenic profile. Thus, A-07-GFP tumors show high secretion of vascular endothelial growth factor A and interleukin 8, whereas D-12-GFP tumors show high interleukin 8 secretion and low vascular endothelial growth factor A secretion [22]. In addition, A-07-GFP tumors show an upregulated expression of the proangiogenic factors basic fibroblast growth factor and plateletderived endothelial cell growth factor [22], and D-12-GFP tumors show a significant secretion of the antiangiogenic factor thrombospondin 1 [23].
High geometric resistance to blood flow in the SAs may influence the physiological microenvironment of tumors significantly. As demonstrated here, tumors with tortuous and narrow SAs show reduced plasma velocities in the downstream tumor vessels and, hence, enhanced BST values. Tumors with high BST values may have a particularly poor overall oxygen supply, and in addition, the Po2 distribution may differ from those with lower BST values [14,17]. Thus, theoretical and experimental studies have suggested that low blood velocities in tumors may result in enhanced oxygen extraction at the arterial end of the microvasculature, rapid oxygen depletion of the erythrocytes, steep longitudinal Po2 gradients, and a large fraction of vessel segments with oxyhemoglobin saturations close to zero [24–28]. Tumors having SAs with high geometric resistance to blood flow may therefore be particularly aggressive and resistant to treatment.
Several strategies have been used in an attempt to improve the oxygenation of tumors, including the use of chemical or physical agents to increase tumor blood flow, the use of chemical or physiological methods to increase the oxygen-carrying capacity of the blood, and the use of antiangiogenic agents to normalize the tumor microvasculature [29–32]. The common feature of these strategies is that they all focus on the microvessels within tumors and not on the tumor SAs in the normal tissue surrounding the malignant tissue. The study reported here suggests that it may be beneficial to focus on the tumor SAs rather than the tumor microvasculature when searching for therapeutic strategies for improving the blood supply, and hence, the oxygenation status of tumors. Furthermore, the tumor SAs may represent an interesting target for physiological interventions attempting to decrease tumor blood supply, and hence to increase the extent of tumor hypoxia, to enhance the efficacy of therapeutic strategies developed to exploit the existence of hypoxic regions in tumors (e.g., strategies involving the use of hypoxia-selective cytotoxins or gene therapy activated by hypoxia) [3].
In conclusion, the present study shows that differences in blood supply between individual A-07-GFP and D-12-GFP tumors growing in the mouse dorsal window chamber are primarily a consequence of differences in the geometric resistance of the tumor SAs (i.e., differences in vessel tortuosity and diameter) rather than differences in the geometric resistance or density of the tumor microvascular network. Therefore, the tumor SAs may represent an important novel target for physiological interventions attempting to modify tumor blood supply to enhance the efficacy of established and experimental cancer treatments.
Acknowledgments
The authors thank Lars Aurdal at the Norwegian Computing Center for software development.
Abbreviations
- BST
blood supply time
- GFP
green fluorescence protein
- SA
supplying artery
- TA
tumor arteriole
- TRITC
tetramethylrhodamine isothiocyanate
- TV
tumor venule
Footnotes
Grant support: This work was supported by the Norwegian Cancer Society.
References
- 1.Vaupel P. Tumor microenvironmental physiology and its implications for radiation oncology. Semin Radiat Oncol. 2004;14:198–206. doi: 10.1016/j.semradonc.2004.04.008. [DOI] [PubMed] [Google Scholar]
- 2.Vaupel P, Kallinowski F, Okunieff P. Blood flow, oxygen and nutrient supply, and metabolic microenvironment of human tumors: a review. Cancer Res. 1989;49:6449–6465. [PubMed] [Google Scholar]
- 3.Brown JM, Giaccia AJ. The unique physiology of solid tumors: opportunities (and problems) for cancer therapy. Cancer Res. 1998;58:1408–1416. [PubMed] [Google Scholar]
- 4.Rofstad EK. Microenvironment-induced cancer metastasis. Int J Radiat Biol. 2000;76:589–605. doi: 10.1080/095530000138259. [DOI] [PubMed] [Google Scholar]
- 5.Kallinowski F, Schlenger KH, Runkel S, Kloes M, Stohrer M, Okunieff P, Vaupel P. Blood flow, metabolism, cellular microenvironment, and growth rate of human tumor xenografts. Cancer Res. 1989;49:3759–3764. [PubMed] [Google Scholar]
- 6.Jain RK. Determinants of tumor blood flow: a review. Cancer Res. 1988;48:2641–2658. [PubMed] [Google Scholar]
- 7.Baish JW, Gazit Y, Berk DA, Nozue M, Baxter LT, Jain RK. Role of tumor vascular architecture in nutrient and drug delivery: an invasion percolationbased network model. Microvasc Res. 1996;51:327–346. doi: 10.1006/mvre.1996.0031. [DOI] [PubMed] [Google Scholar]
- 8.Dewhirst MW, Ong ET, Braun RD, Smith B, Klitzman B, Evans SM, Wilson D. Quantification of longitudinal tissue Po2 gradients in window chamber tumours: impact on tumour hypoxia. Br J Cancer. 1999;79:1717–1722. doi: 10.1038/sj.bjc.6690273. [DOI] [PMC free article] [PubMed] [Google Scholar]
- 9.Baish JW, Jain RK. Fractals and cancer. Cancer Res. 2000;60:3683–3688. [PubMed] [Google Scholar]
- 10.Staufner D, Aharony A. Introduction to Percolation Theory. London, UK: Taylor & Francis; 1992. [Google Scholar]
- 11.Less JR, Skalak TC, Sevick EM, Jain RK. Microvascular architecture in a mammary carcinoma: branching patterns and vessel dimensions. Cancer Res. 1991;51:265–273. [PubMed] [Google Scholar]
- 12.Sevick EM, Jain RK. Geometric resistance to blood flow in solid tumors perfused ex vivo: effects of tumor size and perfusion pressure. Cancer Res. 1989;49:3506–3512. [PubMed] [Google Scholar]
- 13.Less JR, Posner MC, Skalak TC, Wolmark N, Jain RK. Geometric resistance and microvascular network architecture of human colorectal carcinoma. Microcirculation. 1997;4:25–33. doi: 10.3109/10739689709148315. [DOI] [PubMed] [Google Scholar]
- 14.Øye KS, Gulati G, Graff BA, Gaustad JV, Brurberg KG, Rofstad EK. A novel method for mapping the heterogeneity in blood supply to normal and malignant tissues in the mouse dorsal window chamber. Microvasc Res. 2008;75:179–187. doi: 10.1016/j.mvr.2007.06.009. [DOI] [PubMed] [Google Scholar]
- 15.Rofstad EK. Orthotopic human melanoma xenograft model systems for studies of tumour angiogenesis, pathophysiology, treatment sensitivity and metastatic pattern. Br J Cancer. 1994;70:804–812. doi: 10.1038/bjc.1994.403. [DOI] [PMC free article] [PubMed] [Google Scholar]
- 16.Rofstad EK, Wahl A, Davies CL, Brustad T. Growth characteristics of human melanoma multicellular spheroids in liquid-overlay culture: comparisons with the parent tumour xenografts. Cell Tissue Kinet. 1986;19:205–216. doi: 10.1111/j.1365-2184.1986.tb00731.x. [DOI] [PubMed] [Google Scholar]
- 17.Brurberg KG, Gaustad JV, Mollatt CS, Rofstad EK. Temporal heterogeneity in blood supply in human tumor xenografts. Neoplasia. 2008;10:727–735. doi: 10.1593/neo.08388. [DOI] [PMC free article] [PubMed] [Google Scholar]
- 18.Gaustad JV, Brurberg KG, Simonsen TG, Mollatt CS, Rofstad EK. Tumor vascularity assessed by magnetic resonance imaging and intravital microscopy imaging. Neoplasia. 2008;10:354–362. doi: 10.1593/neo.08162. [DOI] [PMC free article] [PubMed] [Google Scholar]
- 19.Carmeliet P, Jain RK. Angiogenesis in cancer and other diseases. Nature. 2000;407:249–257. doi: 10.1038/35025220. [DOI] [PubMed] [Google Scholar]
- 20.Gillies RJ, Schornack PA, Secomb TW, Raghunand N. Causes and effects of heterogeneous perfusion in tumors. Neoplasia. 1999;1:197–207. doi: 10.1038/sj.neo.7900037. [DOI] [PMC free article] [PubMed] [Google Scholar]
- 21.Jain RK. Normalization of tumor vasculature: an emerging concept in antiangiogenic therapy. Science. 2005;307:58–62. doi: 10.1126/science.1104819. [DOI] [PubMed] [Google Scholar]
- 22.Rofstad EK, Halsør EF. Vascular endothelial growth factor, interleukin 8, platelet-derived endothelial cell growth factor, and basic fibroblast growth factor promote angiogenesis and metastasis in human melanoma xenografts. Cancer Res. 2000;60:4932–4938. [PubMed] [Google Scholar]
- 23.Rofstad EK, Graff BA. Thrombospondin-1-mediated metastasis suppression by the primary tumor in human melanoma xenografts. J Invest Dermatol. 2001;117:1042–1049. doi: 10.1046/j.0022-202x.2001.01552.x. [DOI] [PubMed] [Google Scholar]
- 24.Degner FL, Sutherland RM. Mathematical modelling of oxygen supply and oxygenation in tumor tissues: prognostic, therapeutic, and experimental implications. Int J Radiat Oncol Biol Phys. 1998;15:391–397. doi: 10.1016/s0360-3016(98)90021-9. [DOI] [PubMed] [Google Scholar]
- 25.Hirst DG, Wood PJ. Could manipulation of the binding affinity of haemoglobin for oxygen be used clinically to sensitize tumours to radiation? Radiother Oncol. 1991;20(Suppl 1):53–57. doi: 10.1016/0167-8140(91)90188-m. [DOI] [PubMed] [Google Scholar]
- 26.Dewhirst MW. Concepts of oxygen transport at the microcirculatory level. Semin Radiat Oncol. 1998;8:143–150. doi: 10.1016/s1053-4296(98)80040-4. [DOI] [PubMed] [Google Scholar]
- 27.Fenton BM, Rofstad EK, Degner FL, Sutherland RM. Cryospectrophotometric determination of tumor intravascular oxyhemoglobin saturations: dependence on vascular geometry and tumor growth. J Natl Cancer Inst. 1988;80:1612–1619. doi: 10.1093/jnci/80.20.1612. [DOI] [PubMed] [Google Scholar]
- 28.Rofstad EK, DeMuth P, Fenton BM, Sutherland RM. 31P nuclear magnetic resonance spectroscopy studies of tumor energy metabolism and its relationship to intracapillary oxyhemoglobin saturation status and tumor hypoxia. Cancer Res. 1988;48:5440–5446. [PubMed] [Google Scholar]
- 29.Horsman MR. Nicotinamide and other benzamide analogs as agents for overcoming hypoxic cell radiation resistance in tumours. Acta Oncol. 1995;34:571–587. doi: 10.3109/02841869509094031. [DOI] [PubMed] [Google Scholar]
- 30.Chaplin DJ, Hill SA, Bell KM, Tozer GM. Modification of tumor blood flow: current status and future directions. Semin Radiat Oncol. 1998;8:151–163. doi: 10.1016/s1053-4296(98)80041-6. [DOI] [PubMed] [Google Scholar]
- 31.Vaupel P, Mayer A, Höckel M. Impact of hemoglobin levels on tumor oxygenation: the higher, the better? Strahlenther Onkol. 2006;182:63–71. doi: 10.1007/s00066-006-1543-7. [DOI] [PubMed] [Google Scholar]
- 32.Batchelor TT, Sørensen AG, di Tomaso E, Zhang WT, Duda DG, Cohen KS, Kozak KR, Cahill DP, Chen PJ, Zhu M, et al. AZD2171, a pan-VEGF receptor tyrosine kinase inhibitor, normalizes tumor vasculature and alleviates edema in glioblastoma patients. Cancer Cell. 2007;11:83–95. doi: 10.1016/j.ccr.2006.11.021. [DOI] [PMC free article] [PubMed] [Google Scholar]


