Abstract
Study Objectives:
The goal of this study was to clarify whether ginseng fermented by lactic acid bacteria (fermented ginseng, FG), can improve the first-night effect (FNE) in humans.
Design:
Behavioral tests and quantification of mRNA expression related to GABAergic neurotransmission in brain (glutamic acid decarboxylase 1, γ-aminobutyrate aminotransferase [Abat], γ-aminobutyric acid transporter 1 [GAT1], γ-aminobutyric acid transporter 4, γ-aminobutyric acid A receptor subunit α 1 and γ-aminobutyric acid A receptor subunit α 2) were carried out in FG-treated mice. We also performed double-blind sleep recordings of human subjects given FG or placebo.
Setting:
A university-based sleep laboratory.
Patients or Participants:
Sixteen healthy male volunteers (aged 20.69 ± 0.44 years) were observed in the human study.
Interventions:
At the end of administration, 2 consecutive all-night polysomnography recordings were performed. Subjects also completed psychological questionnaires, and urine and saliva samples were taken to analyze stress-sensitive markers.
Measurements and Results:
The light-dark transition test demonstrated that FG had some anxiolytic effect in mice, but other anxiety measures were unaffected. The hippocampal mRNA expression showed a decrease of Abat and GAT1 suggesting an increase of GABA. Other regions (amygdala and cerebellum) showed no differences. Furthermore, there was some evidence (using simple pairwise comparisons but not supported in the full ANOVA model) that administration of FG tended to diminish decreases in total sleep time and sleep efficiency (seen as first night effects in the placebo group) without affecting sleep architecture.
Conclusions:
Our results suggest the administration of FG could improve the FNE in humans. The improvement may be related to an anxiolytic effect of FG which acts via GABAergic modification.
Citation:
Kitaoka K; Uchida K; Okamoto N; Chikahisa S; Miyazaki T; Takeda E; Séi H. Fermented ginseng improves the first-night effect in humans. SLEEP 2009;32(3):413–421.
Keywords: First-night effect, anxiety, ginseng, GABA, human
SLEEP STRUCTURE IS DISTURBED DURING SLEEP RECORDING IN A LABORATORY, PARTICULARLY ON THE FIRST NIGHT. IT IS PRIMARILY CHARACTERIZED BY shorter total sleep time (TST), reduced sleep efficiency, prolonged sleep latency, more awaking time after sleep onset, a larger percentage of stage 1 sleep, and a delay in the onset of the first period of REM sleep on the initial all-night polysomnography (PSG) recording when compared to recordings in subsequent nights. This phenomenon is known as the first-night effect (FNE).1,2 The FNE is induced by the stressful conditions of the sleep-recording environment, such as discomfort caused by the numerous electrodes, limitation of movement by gauges and cables, monitoring by experimenters, and the novelty of the recording laboratory.3 Many studies have reported that anxiety and stress disorders enhance FNE.4–6 Therefore, FNE can be considered to be general response induced by transient and/or chronic stress in humans.
Ginseng (Panax ginseng, C. A. Meyer, Araliaceae) is one of the most popular herbs in oriental countries such as Korea, China, and Japan. The main ingredients of ginseng are ginsenosides, glycosides containing an aglycone (protopanaxadiol or protopanaxatriol) with a dammarane skeleton. Numerous researchers have contributed to the accumulation of evidence that ginsenosides are responsible for the pharmacological effects of ginseng including anti-stress or anxiolytic effects in animals7–10 and humans.11–13 Ginseng is orally ingested; therefore, its ingredients must meet gastric juices and digestive and bacterial enzymes in the intestines. Active ingredients thought to be involved in the sedative action of ginseng are protopanaxadiol-type ginsenosides like Rb1, Rb2, Rc and Rd.14 Orally ingested ginsenosides pass through the stomach and small intestine without decomposition by either gastric juices or liver enzymes into the large intestine, where ginsenoside is hydrolyzed by colonic bacteria followed by transit to the circulation: colonic bacteria cleave the oligosaccharide connected to the aglycone stepwise from the terminal sugar to generate the major metabolites, 20S-protopanaxadiol 20-O-beta-D-glucopyranoside (M1) and 20S-protopanaxatriol (M4).15,16 Accumulating evidence strongly suggests that the metabolites are the active molecules in the body.16 However, metabolite-producing potential of intestinal bacteria differ among individuals.17,18 During the course of screening bacteria for metabolite-producing potential, we discovered that Lactobacillus paracasei A22119 was successful in producing fermented ginseng (FG), including a rich source of M1. Thus, we hypothesized that FG may constitute a more efficient means of administration and may provide a more stable anxiolytic or anti-stress effect.
The final goal of this study was to clarify whether FG administration can improve the FNE and therefore act as a useful functional herb. We performed chronic administration studies in both animal and human subjects because many human studies associated with anti-stress or anxiolytic effects of ginseng have been carried out chronically.11–13 Firstly, we confirmed whether FG has more of an anxiolytic effect than ginseng with behavioral testing in mice with chronic administration. To clarify the anxiolytic mechanism, we also quantified the mRNA expression related to GABAergic neurotransmission in the mouse brain. In human subjects, we then carried out 2 consecutive double-blind sleep recordings after one-week administration of FG or placebo. Before and after administration, subjects were completed psychological questionnaires, and samples were taken to analyze stress-sensitive markers.
METHODS
Fermenting Organism
The fermenting organism was L. paracasei A221, a homo-fermentative lactic acid bacterium isolated from a traditional fermented food.19 Its 16S rRNA sequence was deposited in the GenBank database under accession number AB126872. The genus Lactobacillus bacteria are used as starters for fermented foods, including yogurt and cheese. Their safety as probiotics has been traditionally established.20 L. paracasei A221 hydrolyzed plant glycosides including ginsenoside, glycyrrhizin (Glycyrrhizae Radix), and soy isoflavone glycoside (Glycine max). As for ginsenoside, L. paracasei A221 hydrolyzed ginsenosides Rb1, Rb2, Rc, and Rd (protopanaxadiol-type), and also ginsenosides Rg1 and Re (protopanaxatriol-type). L. paracasei A221 was seeded in a culture medium, which was used as a starter for ginseng fermentation.
Production of Fermented Ginseng
FG was produced by fermentation of a culture medium including 15% ginseng mixture (ginseng [aged 5 years, harvested in Jilin province, China] 84%; yeast extract [Asahi Food – Healthcare Co., Ltd, Japan] 6.5%; soybean peptide [Fuji Oil Co., Ltd, Japan] 3%' and calcium carbonate 6.5%) at 28°C for 10 days. Monitoring of the M1 level in the ginseng culture revealed that 10-day fermentation was necessary for maximal accumulation of M1 in FG. Following fermentation, the cultured medium was sterilized (at 121°C for 10 min) and spray-dried. Under these conditions, no variability of dammarane ingredients occurred, which was verified by thin layer chromatography analysis. The contents of ginsenosides and their metabolites M1 and M4 in FG are shown in Table 1, together with data on ginseng.
Table 1.
Contents (% w/w) of Ginsenosides and their Metabolites in Ginseng and FG
| Protopanaxadiol-type |
Protopanaxatriol-type | Metabolite |
|||||
|---|---|---|---|---|---|---|---|
| Rb1 | Rb2 | Rc | Rd | Rg1 | M1 | M4 | |
| Ginseng | 2.67 | 1.70 | 3.13 | 1.08 | 0.40 | ND | ND |
| FG | ND | 0.06 | 0.42 | 0.13 | 0.10 | 1.42 | 0.10 |
FG: fermented ginseng; ND: Not detectable.
Quantification of Anxiety and Gene Expression in Mice
Subjects
Seven-week-old C57BL/6 male mice were used. The animals were maintained on a 12:12 h light: dark cycle (lights on at 08:00) at an ambient temperature (25 ± 1°C in our animal facility), and had free access to food and water. These mice were divided into control (normal diet feeding), ginseng and FG-containing diet groups. Each ginseng was contained in powder diet, and the intake of the ginseng was set as 50 mg/kg/day. After 20 days of continuous feeding of these diets, behavioral tests and mRNA quantification were performed. All behavioral testing was completed between 13:00 and 17:00, and mice were used only once for each type of behavioral test. The experiments were approved by the Animal Study Committee of Tokushima University (No. 06007) and carried out according to the guidelines for the Care and Use of Animals approved by the Council of the Physiological Society of Japan.
Behavioral Testing
Light-Dark Transition
A chamber divided equally into 2 compartments (22 cm × 24 cm × 30 cm) was used for the light-dark transition test. The light compartment consisted of a white floor and transparent walls and lid. The dark compartment consisted of a black floor, walls, and lid and was completely enclosed except for a small (15 cm × 5 cm) opening to allow movement between the dark and light compartments. Mice were placed in the dark compartment, and the latency to go into the light compartment for the first time was recorded as an assessment of anxiety. The percentage of time spent and the number of entries into the light field were also recorded for 5 min. A greater amount of time spent and number of entries into the light side of the chamber have been shown to be an index of lowered anxiety behavior.21
Elevated Plus Maze
Mice were placed in the center of an apparatus consisting of 2 opposing runways. One of the runways contained the closed arms (6 cm × 30 cm) of the maze, which had walls 15 cm high. The other runway consisted of the open arms (7 cm × 30 cm) of the maze, which had no walls. The maze was elevated to 70 cm above the floor. Behavior of the mice in the maze was monitored for 5 min. The path taken by the mouse was recorded automatically. The percentage of distance traveled, time spent, and the number of entries into the open arms were recorded automatically as an index of lowered anxiety behavior.22
mRNA Expression in Mouse Brain
After behavioral tests, mice were decapitated and the brain was removed from the skull. The brain was sectioned by brain matrix (myNeuroLab, USA), and the hippocampus (Hi), amygdala (Am) and cerebellum (Cb) were extracted from the section by fine tweezers, frozen rapidly in liquid N2, and stored at −80°C. The total RNA was extracted with TRIzol reagent (Invitrogen, USA), and 2-step quantitative real-time RT-PCR was performed. Reverse transcription of total RNA was carried out with a first strand cDNA synthesis kit (Invitrogen, USA), and the amount of cDNA generated was quantified with the SYBR Pre Mix Ex Taq (TAKARA, Japan) using the Light Cycler system (Roche Diagnostics, USA) with 50 reaction cycles. The endogenous glyceraldehyde 3-phosphate dehydrogenase (GAPDH) gene was used to normalize quantification of mRNA target, and nonspecific amplifications were verified by a dissociation curve. The quantified gene and the specific primer sequences used in this study are shown in Table 2.
Table 2.
Quantified Genes and their Primer Sequence Used in this Study
| Gene | Accession number | Sense | Anti-Sense | ||
|---|---|---|---|---|---|
| glutamic acid decarboxylase 1 (GAD1) | NM_008077 | 208-227 | 5′-cagtcctccaagaacctgct-3′ | 405-386 | 5′-ggtggagcgatcaaatgtct-3′ |
| γ-aminobutyrate aminotransferase (Abat) | NM_172961 | 565-584 | 5′-ttctccaaagaggagctgga-3′ | 759-740 | 5′-atatttcagccgtgggaatg-3′ |
| γ-aminobutyric acid transporter 1 (GAT1) | NM_178703 | 1376-1395 | 5′-gcttgctgttcctggttttc-3′ | 1573-1554 | 5′-ccatggtgagtggtgtcatc-3′ |
| γ-aminobutyric acid transporter 4 (GAT4) | NM_172890 | 440-459 | 5′-cgtgggccatcttctaccta-3′ | 636-617 | 5′-gccatcggatatagccaaga-3′ |
| γ-aminobutyric acid A receptor subunit α 1 (Gabra1) | NM_010250 | 24-43 | 5′-tgactatctttgggcctgga-3′ | 222-203 | 5′-ggtgacgaaaatgtcggtct-3′ |
| γ-aminobutyric acid A receptor subunit α 2 (Gabra2) | NM_008066 | 1028-1047 | 5′-cttgggacgggaagagtgta-3′ | 1220-1201 | 5′-gcttcagctggcttgttctc-3′ |
Statistics
Results are presented as the mean ± standard deviation (SD). Behavioral tests were analyzed by Kruskal-Wallis test, followed by the post hoc multiple Mann-Whitney U test. Gene expressions were analyzed by analysis of variance (ANOVA), followed by the Scheffe post hoc test. For all comparisons, the criterion for significance was P < 0.05.
SLEEP RECORDINGS IN HUMANS
Participants
Sixteen healthy male volunteers (aged 20.69 ± 0.44 years) were studied. All subjects had regular sleep and wake habits, did not drink alcohol and/or smoke in their daily life, and had no psychiatric disorders as determined by preliminary questionnaire. All volunteers signed informed consent forms prior to entering the study. They were randomly divided into 2 groups: FG group and placebo group. Their body constitution and customary sleep patterns were obtained from a preliminary questionnaire as shown in Table 3. No significant differences, estimated by unpaired t-tests, were seen between the 2 groups. Each group was administrated FG or placebo for 8 days. FG was encapsulated. For placebo, microcrystalline cellulose was used instead of FG. The intake of FG was 1845 mg/day (One capsule contains 205 mg FG, and 3 capsules were taken 3 times per day after meals). On the 8th day, the experimenter checked the accuracy of administration by counting residual capsules and verbal inquiry.
Table 3.
Body Constitution and Customary Sleep of Study Participants Preliminary Questionnaire
| Variable | FG (n = 8) |
Placebo (n = 8) |
||||
|---|---|---|---|---|---|---|
| mean | SD | mean | SD | P-value | ||
| age | (y) | 20.13 | 1.13 | 21.25 | 2.19 | NS |
| weight | (kg) | 66.44 | 6.48 | 62.53 | 6.87 | NS |
| height | (cm) | 176.54 | 3.92 | 169.00 | 9.26 | NS |
| BMI | 21.33 | 2.10 | 22.00 | 3.01 | NS | |
| bedtime | (AM) | 00:37 | 00:31 | 00:15 | 00:42 | NS |
| sleep time | (h) | 7.06 | 0.68 | 6.88 | 0.64 | NS |
Data are given as mean and SD. FG: fermented ginseng; BMI: body mass index; NS: not significant.
This human study was performed in double-blind fashion and was approved by the ethics committee of Tokushima University Hospital (No. 467), which conforms to the principal outline by the Declaration of Helsinki.
PROCEDURE
During the 8 days, participants were administrated FG or placebo. They were advised to maintain their usual sleep-wake habits (their daily wake-sleep time and sleep duration) and were instructed to refrain from excessive alcohol consumption, unusual physical exercise, and taking naps. On the 7th and 8th day, all-night PSG recordings were obtained between 23:00 (light off) and 07:00 (light on). These recordings were performed in individual, temperature-controlled and electrically shielded rooms within the laboratory, using a Neurofax PSG system (Nihon Koden, Japan). Thus, the total time in bed was fixed. The administration was continued until the second PSG recording night.
PSG Recordings
Electroencephalograms (EEG) were recorded from C4-A1 and C3-A2 as in the international 10-20 system. Electrooculograms (EOG) were recorded from the right and left outer canthus and electromyograms (EMG) from the chin muscles. Electrocardiogram, respiratory movement, and arterial oxygen saturation were recorded simultaneously. Electrode impedance was kept below 5 kΩ. The sampling rate was 200 Hz. The EEG and EOG recordings were amplified with a bandwidth from 0.5 Hz to 60 Hz. The EMG was band-pass filtered between 5 Hz and 60 Hz. On-line monitoring was performed on the Neurofax in 30-sec periods successively, as displayed on the screen. After recordings, EEGs were scored manually into sleep stages for every 30-sec epoch according to the criteria of Rechtschaffen and Kales,23 using the Polysmith sleep analysis program (Neurotronics, USA).
Sleep Architecture and Variables
TST was the amount of actual sleep time within the total recording. Sleep latency was estimated by the time from the initiation of recording to the first epoch of stage 2. REM latency was defined as the time from the first epoch of stage 2 to the first REM period which continued for more than 3 min. Wake after sleep onset (waking time excludes the time from the initiation of recording to the first epoch of stage 2, WASO) and the number of awakenings referred to the arousals to wakefulness during the total sleep period. WASO and the number of awakenings show the amounts and frequency of sleep interruption respectively. The sleep efficiency index was calculated by dividing TST by the total time in bed (fixed in our study) multiplied by 100. Sleep stages 1, 2, 3, 4, REM and wake were expressed in minutes.
Assessment of Subjective Sleep Quality
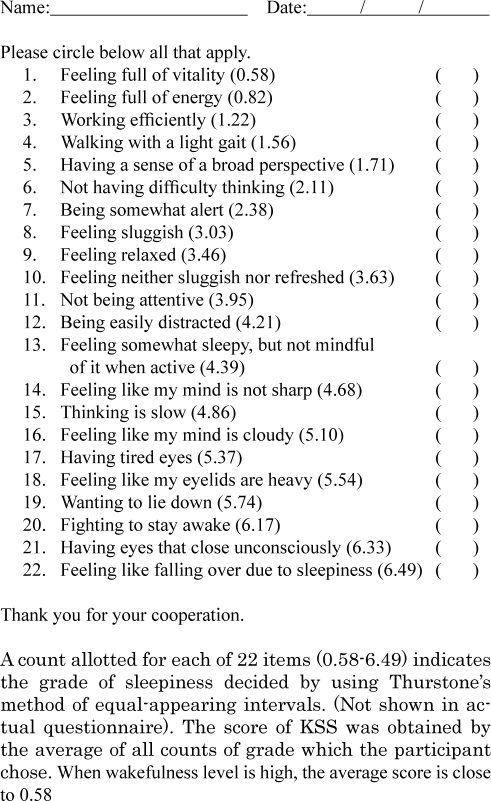
After waking, subjects completed the Kwansei-gakuin sleepiness scale (KSS), an assessment scale for the evaluation of subjective sleep and waking quality. The KSS consists of 22 Japanese sentences and is a newly developed measure for Japanese researchers based on the Stanford Sleepiness Scale (Supplement 1). The participant was instructed to choose any items that agreed with his feelings within the 22 sentences. A count was allotted for each of the 22 items (0.58-6.49) as the grade of sleepiness. The count of grade was decided by using Thurstone's method of equal-appearing intervals. The score of KSS was obtained by the average of all counts of grade chosen by the participant.24 When wakefulness level is high, the average score is close to 0.58, and when wakefulness level is low, the score is close to 6.49.
Supplement 1.
English translation of Kwansei-gakuin sleepiness scale (KSS)
Sampling of Stress-Sensitive Substances and Psychological Questionnaires
The Japanese version of the Profile of mood state (POMS, Kanekoshobo, Japan) and State-trait anxiety inventory (STAI, Jitsumukyoiku-shuppan, Japan) questionnaires were completed to measure psychological stress just before and after the administration week. The results of POMS are shown in the total mood disturbance score and can be calculated by summing scores across all subscales (vigor-activity is scored negatively) (−32 to 200). The results of STAI are shown in the total score (40 to 160). Simultaneously, saliva and urine were collected to estimate the salivary cortisol, secretory immunoglobulin A (SIgA), and urinary 8-hydroxydeoxyguanosine (8-OHdG). Salivary cortisol was quantified by radioimmunoassay (GammaCoat Cortisol, Japan Schering, Japan). SIgA was estimated by enzyme immunoassay (EIA s-IgA test, Medical and Biological Laboratories, Japan). Urinary 8-OHdG was measured by ELISA (New 8-OHdG Check, Nikken SEIL, Japan). The collection time was fixed between 16:00-18:00.
Statistics
Results are presented as the mean ± standard deviation (SD). A 2 × 2 mixed model ANOVA (groups × nights) was used for the PSG data. When ANOVA was significant, a Scheffe post hoc test was performed. The effects of administration on the stress-sensitive markers and questionnaires were analyzed by using the Wilcoxon signed rank test because of their wide dispersion. P < 0.05 was considered statistically significant.
RESULTS
Quantification of Anxiety and mRNA Expression in Mice
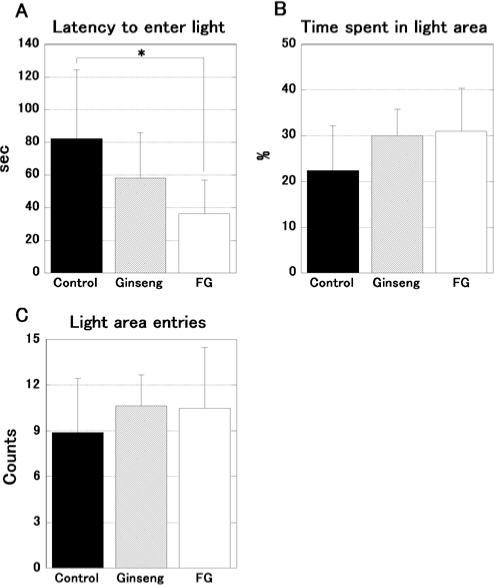
Twenty-four mice were tested on the light-dark transition test. The results are shown in Figure 1. The Kruskal-Wallis test showed a significant difference in the latency to enter the light side of the apparatus (H = 6.805, P < 0.05, Figure 1A). The post hoc test indicated that the administration of FG induces a shorter latency than the control (P < 0.05). The percentage of time spent (H = 2.899, P = 0.236, Figure 1B) and the number of entries (H = 1.085, P = 0.588, Figure 1C) into the light were not significantly different.
Figure 1.
Results of the light-dark transition test in FG and ginseng treated mice. The data represent the mean ± SD. FG-treated mice (open bars; n = 8) showed a significantly shorter latency to move from the dark into the light area than control (filled bars; n = 8, A). Ginseng-treated mice (hatched bars; n = 8, A) did not show a significant difference. There was no significant difference in the time spent in the light area (B) and entry times in light field (C). *P < 0.05.
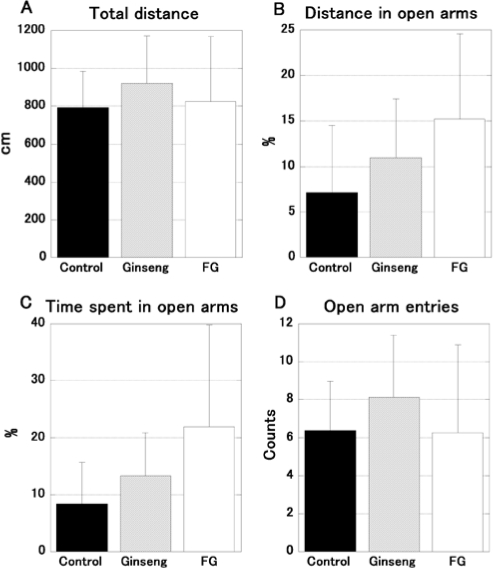
Figure 2 shows the results of the elevated plus maze, using 24 mice. The percentage of distance traveled (H = 4.854, P = 0.088, Figure 2B) and time spent (H = 4.998, P = 0.082, Figure 2C) in the open arms was close to the level of significance. The total distance traveled (H = 1.236, P = 0.539, Figure 2A) and the entry times into the open arms (H = 2.100, P = 0.348, Figure 2D) were not statistically different.
Figure 2.
The results of the elevated plus maze test in FG and ginseng treated mice. The data represent the mean ± SD. FG-treated mice (open bars; n = 8) showed a tendency towards an increased running distance (B) and more time spent (C) in the open arms in comparison to control (filled bars; n = 8); however, this was not significant. The tendency of ginseng-treated mice (hatched bars; n = 8) was weaker than FG-treated mice. The total running distance (A) and entry times in open arms (D) were not significantly different.
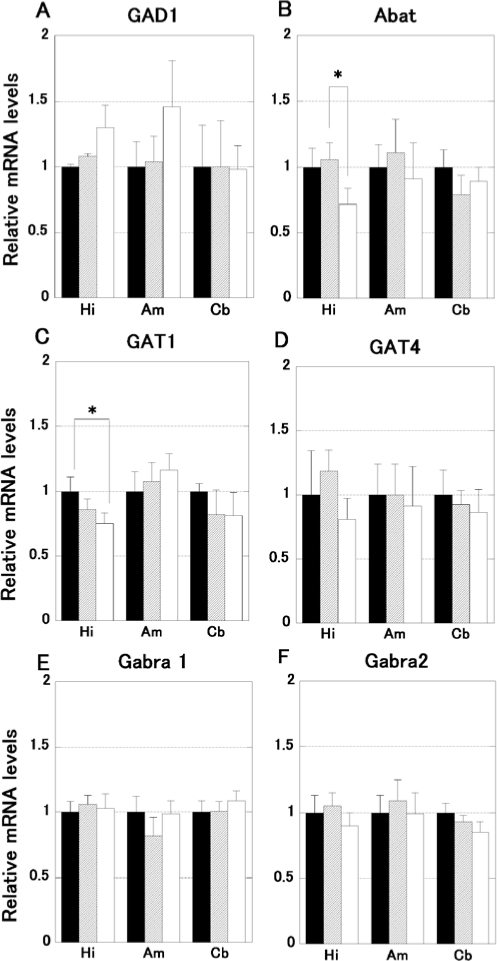
The mRNA expression of GABAergic factors is shown in Figure 3. Twelve mice were quantified. One-way ANOVA demonstrated a significant difference in Abat (F2,3 = 5.634, P < 0.05, Figure 3B) and GAT1 (F2,3 = 5.108, P < 0.05, Figure 3C) expression in the hippocampus. The post hoc test clarified that the FG-treated mice exhibit smaller Abat and GAT1 expression than the ginseng and control group (P < 0.05). Other genes and regions were not significantly different.
Figure 3.
The expression of mRNA associated with GABAergic neuromodulation (glutamic acid decarboxylase 1; GAD1, γ-aminobutyrate aminotransferase; Abat, γ-aminobutyric acid transporter 1; GAT1, γ-aminobutyric acid transporter 4; GAT4, γ-aminobutyric acid A receptor subunit α 1;Gabra1, γ-aminobutyric acid A receptor subunit α 2; Gabra2) in FG and ginseng treated mice brain (hippocampus; Hi, amygdala; Am, cerebellum; Cb). The data represent the mean ± SD. Only the hippocampus of FG-treated mice (open bars; n = 4) showed a significantly smaller expression in GABA catabolic enzyme (Abat, B) and predominant neuronal GABA transporter (GAT1, C) in comparison to ginseng (hatched bars; n = 4) and control (filled bars; n = 4), respectively. No significant differences were seen in other genes or regions examined.
Sleep Recordings in Human Subjects
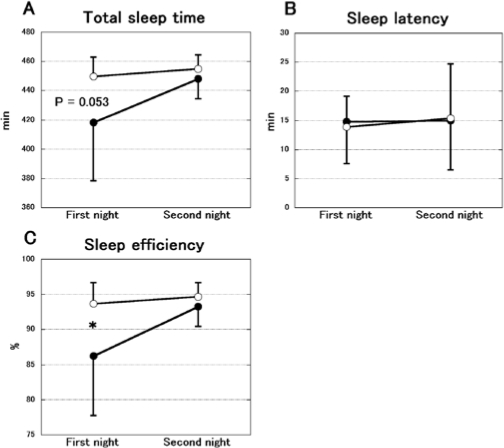
Figure 4 shows the changes of TST, sleep latency and sleep efficiency between the first and second nights in the FG and placebo group. The TST was significantly different between the FG and placebo groups (groups: F1,14 = 5.713, P < 0.05, nights: F1,14 = 4.769, P < 0.05, interaction: F1,14 = 2.378, P = 0.145, Figure 4A). The post hoc test showed a tendency in the first night (P = 0.053). Sleep efficiency differed significantly between the 2 groups (groups: F1,14 = 6.169, P < 0.05, nights: F1,14 = 6.107, P < 0.05, interaction: F1,14 = 3.385, P = 0.087, Figure 4C). The post hoc test revealed a significant difference in the first night (P < 0.05). No significant difference was observed in sleep latency (groups: F1,14 = 0.008, P = 0.928, nights: F1,14 = 0.093, P = 0.765, interaction: F1,14 = 0.055, P = 0.818, Figure 4B).
Figure 4.
The change of total sleep time (A), sleep latency (B) and sleep efficiency (C) during 2 consecutive nights in the FG (open circles; n = 8) and placebo groups (filled circles; n = 8). The data represent the mean ± SD. Total sleep time and sleep efficiency were significantly increased during the first night in the FG group. However, no significant difference was observed in sleep latency. *P < 0.05.
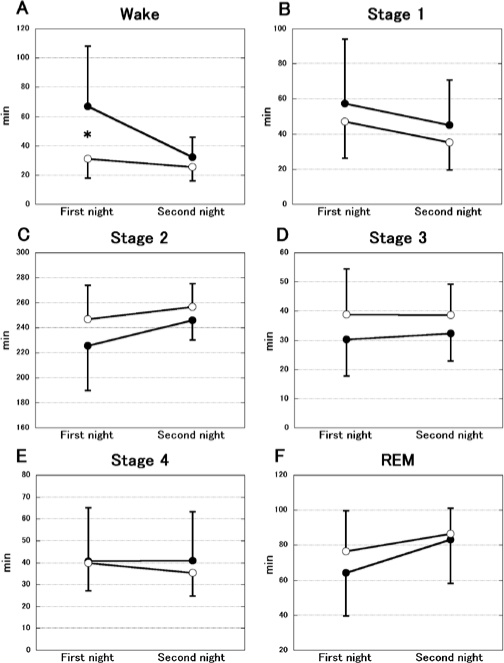
The changes in sleep structure are demonstrated in Figure 5. A significant difference was shown in wake (groups: F1,14 = 6.171, P < 0.05, nights: F1,14 = 6.662, P < 0.05, interaction: F1,14 = 3.446, P = 0.084, Figure 5A). The post hoc test indicated a significant difference in the first night (P < 0.05). In other states, significant differences were not observed (Stage 1; groups: F1,14 = 0.805, P = 0.385, nights: F1,14 = 3.597, P = 0.079, interaction: F1,14 = 0.001, P = 0.977, Figure 5B, Stage 2; groups: F1,14 = 2.884, P = 0.112, nights: F1,14 = 2.945, P = 0.108, interaction: F1,14 = 0.378, P = 0.549, Figure 5C, Stage 3; groups: F1,14 = 2.773, P = 0.118, nights: F1,14 = 0.052, P = 0.823, interaction: F1,14 = 0.084, P = 0.776, Figure 5D, Stage 4; groups: F1,14 = 0.149, P = 0.705, nights: F1,14 = 0.251, P = 0.625, interaction: F1,14 = 0.330, P = 0.575, Figure 5E, REM; groups: F1,14 = 0.651, P = 0.433, nights: F1,14 = 7.879, P < 0.05, interaction: F1,14) = 0.767, P = 0.540, Figure 5F).
Figure 5.
The change of sleep structure during 2 consecutive nights in the FG (open circles; n = 8) and placebo groups (filled circles; n = 8). The data represent the mean ± SD. A significant decrease in wake state (incorporating both wake after sleep onset and latency to fall asleep) was shown on the first night in the FG group (A). Other states (Stage 1–4, REM) did not change (B–F). The amounts were estimated by total time. *P < 0.05.
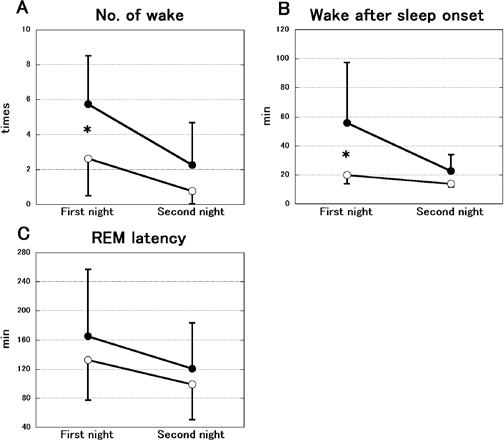
Figure 6 demonstrates the change in the number of awakenings, WASO and REM latency. The number of awakenings was significantly different between the FG and placebo groups (groups: F1,14 = 5.993, P < 0.05, nights: F1,14 = 26.577, P < 0.01, interaction: F1,14 = 2.429, P = 0.141, Figure 6A). The post hoc test showed a significant difference in the first night (P < 0.05). WASO also differed significantly between the 2 groups (groups: F1,14 = 7.486, P < 0.05, nights: F1,14 = 6.909, P < 0.05, interaction: F1,14 = 3.339, P = 0.089, Figure 6B). The post hoc test revealed a significant difference in the first night (P < 0.05). REM latency was not significantly different (groups: F1,14 = 0.867, P = 0.367, nights: F1,14 = 5.694, P < 0.05, interaction: F1,14 = 0.112, P = 0.743, Figure 6C).
Figure 6.
The change in the number of awakenings (A), wake after sleep onset (WASO, B) and REM latency (C) between 2 consecutive nights in the FG (open circles; n = 8) and placebo groups (filled circles; n = 8). The data represent the mean ± SD. The number of awakenings and WASO were significantly decreased on the first night in the FG group. However, REM latency was not significantly different. *P < 0.05.
The results of the psychological questionnaires and stress-sensitive substances are shown in Table 4. Significant decreases were observed in the total STAI (z = 2.100, P < 0.05) and KSS score (z = 1.960, P < 0.05) in the FG group. No significant differences were observed in POMS or any of the stress-sensitive substances monitored.
Table 4.
Psychological Questionnaires and Stress-Sensitive Substances
| Variable | FG (n = 8) |
Placebo (n = 8) |
|||||||||
|---|---|---|---|---|---|---|---|---|---|---|---|
| Before administration | SD | After administration | SD | P-value | Before administration | SD | After administration | SD | P-value | ||
| STAI | 100.5 | 15.82 | 93.63 | 17.47 | < 0.05 | 87.63 | 10.26 | 84.25 | 11.37 | NS | |
| POMS | 56.17 | 36.92 | 49.63 | 41.54 | NS | 44.25 | 26.86 | 34.5 | 26.46 | NS | |
| Cortisol | (µg/dL) | 0.26 | 0.07 | 0.30 | 0.08 | NS | 0.43 | 0.26 | 0.39 | 0.16 | NS |
| SIgA | (µg/mL) | 400.78 | 302.53 | 283.15 | 124.22 | NS | 169.61 | 82.23 | 202.29 | 56.59 | NS |
| 8-OHdG | (ng/mL) | 15.54 | 9.57 | 17.53 | 10.97 | NS | 14.53 | 7.58 | 10.89 | 10.2 | NS |
| Variable | First night | SD | Second night | SD | P-value | First night | SD | Second night | SD | P-value | |
| KSS | 4.38 | 0.57 | 3.61 | 0.91 | < 0.05 | 4.05 | 0.81 | 4.01 | 1.11 | NS | |
Data are given as mean and SD. FG: fermented ginseng; STAI: State-trait anxiety inventory; POMS: Profile of mood state; SIgA: secretory immunoglobulin A; 8-OHdG: 8-hydroxydeoxyguanosine; KSS: Kwansei-gakuin sleepiness scale; NS: not significant.
DISCUSSION
In the human study, 8-day administration of ginseng fermented by food-derived lactic acid bacteria tended to diminish (using simple pairwise comparisons made in the absence of statistically significant Group by Night interaction terms in the full ANOVA models) the decrease of TST and sleep efficiency that was observed as part of the FNE in the placebo group. These results, although not meeting stringent statistical criteria for efficacy, suggested that the administration of FG could attenuate the FNE in humans. With respect to sleep latency, however, a difference was not observed between the 2 groups. In a previous study of a large healthy subject sample,4 the value of sleep latency on the first night was greater than that observed in our placebo subjects (19.1 vs. 14.8). Suetsugi et al. have reported that placebo administration improved the FNE in healthy young subjects,25 and in our study placebo administration may have improved FNE. Significant differences were observed in the amount of time spent awake, the number of awakenings, and WASO, but the amounts of stage 1–4 and REM sleep were not significantly different. These data indicate that the attenuation of the FNE observed in our study was the result of reduction of WASO.
In the psychological questionnaires, the STAI score was significantly reduced at the end of the trial in the FG group. Also, the score on KSS was significantly reduced between the first night and second night. In the mouse study, the light-dark transition test demonstrated that FG has more of an anxiolytic effect than a control or ginseng diet. The elevated plus maze test also indicated the same tendency. Furthermore, we confirmed that chronic administration of FG decreased the mRNA expression of GABA catabolic enzyme (Abat) and neuronal GABA transporter (GAT1) in mouse hippocampus, which suggests that there is an increase of GABA concentration in the hippocampal synaptic cleft. These GABAergic modifications may be a main factor underlying the anxiolytic effect of FG. Our results suggest that the administration of FG induces some anxiolytic and/or anti-stress effect as reported in other studies7–13 via GABAergic function. It is possible that these effects are followed by the attenuation of the FNE observed in our human study.
Both in vivo and in vitro studies have provided evidence that ginsenosides modify GABAergic neurotransmission. Carr et al. suggested that GABAergic neuromodulation, especially the GABA-benzodiazepine-chloride channel receptor complex is involved in the anxiolytic effect of ginseng,9 and Naval et al. reported that extract of ginseng induced the release of GABA in cultured neurons.26 Additionally, Yuan et al. demonstrated that the extract of American ginseng (Panax quinquefolium L.) suppresses the unit activity in the nucleus tractus solitarius via GABAergic neurotransmission.27 However, dopaminergic inhibition has also been reported, as Kim et al. demonstrated that intraperitoneal injection of ginsenoside Rb1 and Rg1 in mice inhibits the hyperactivity and conditioned place preference induced by methamphetamine and cocaine.28,29 The same group also reported that ginsenoside Rb1, Rc, Re, and Rg1 noncompetitively inhibit the activity of tyrosine hydroxylase in bovine adrenal.30 Furthermore, Cho et al. reported that ginsenoside Rb1 activates estrogen receptor α and β in cultured cells31 and it is known that the estrogen receptor β has an anxiolytic effect.32 Although we have clarified that the administration of FG induces GABAergic modification, the results do not exclude the involvement of other mechanisms such as dopaminergic neurotransmission and nuclear receptors. The anxiolytic function of FG might be induced by activation of a number of, or all of the pathways described. Therefore, further investigation is needed for the full elucidation of this mechanism.
On the other hand, in stress-sensitive substances (Salivary cortisol, SIgA and urinary 8-OHdG), administration of FG did not induce a significant difference. Tode et al. reported a decrease in plasma cortisol concentration following 30-day administration of Korean red ginseng (6 g/day) in post menopausal women with climacteric syndromes.13 Lee et al. also showed a decrease in the plasma level of 8-OHdG following 4-week administration of red ginseng (1.8 g/day) in smokers.33 However, the duration and/or amount of ginseng administered in their studies was greater than in our human study. It may be considered that the duration and/or dose of FG in our study was smaller than the effective duration and dose for stress-sensitive substances. In addition, differences in the criteria for selecting subjects may also contribute to the different results observed. In the previous studies, participants who had some stressful state (climacteric syndromes or smoking) were used, but in our study the participants were healthy young male nonsmokers.
We did not investigate the acute effect of FG in sleep architecture in this study. Our study setting emphasized the effects of chronic administration of FG because many human studies associated with anti-stress or anxiolytic effects of ginseng have been carried out utilizing chronic administration.11–13 It is likely that the chronic effect of FG does not differ from the acute one because our present animal studies demonstrated chronic administration of FG has an anxiolytic effect similar to previous acute studies.7–10 However, the possibility that acute administration of FG disrupts sleep cannot be eliminated in the present study. Further acute studies may be needed to fully clarify the efficacy of FG on the FNE.
In conclusion, chronic administration of FG showed some preliminary evidence of improving the FNE. This anti-stress or anxiolytic effect may be induced, at least partially, by the modification of GABAergic neurotransmitters. The present results suggest that FG may be an effective functional herb for coping with stress and/or anxiety.
DISCLOSURE STATEMENT
This was not an industry supported study. Toshitsugu Miyazaki is in charge of research and development for Nagase – Co., Ltd., Kobe, Japan, importer/exporter and domestic sales of chemicals, plastics, electronic materials, cosmetics, health foods, and medical equipment. The other authors have indicated no financial conflicts of interest.
ACKNOWLEDGMENTS
This work was supported by a Grant-in-Aid for Scientific Research from the 21st Century COE Program, Human Nutritional Science on Stress Control, Tokushima, Japan. We thank Dr. Ryuji Kaji and Dr. Ryo Urushihara (Department of Neurology, The University of Tokushima Graduate School) for great assistance in carrying out this study.
REFERENCES
- 1.Rechtschaffen A, Verdone P. Amount of dreaming: effect of incentive, adaptation to laboratory, and individual differences. Percept Mot Skills. 1964;19:947–58. doi: 10.2466/pms.1964.19.3.947. [DOI] [PubMed] [Google Scholar]
- 2.Agnew HW, Jr, Webb WB, Williams RL. The first night effect: an EEG study of sleep. Psychophysiology. 1966;2:263–6. doi: 10.1111/j.1469-8986.1966.tb02650.x. [DOI] [PubMed] [Google Scholar]
- 3.Le Bon O, Staner L, Hoffmann G, et al. The first-night effect may last more than one night. J Psychiatr Res. 2001;35:165–72. doi: 10.1016/s0022-3956(01)00019-x. [DOI] [PubMed] [Google Scholar]
- 4.Toussaint M, Luthringer R, Schaltenbrand N, et al. First-night effect in normal subjects and psychiatric inpatients. Sleep. 1995;18:463–9. doi: 10.1093/sleep/18.6.463. [DOI] [PubMed] [Google Scholar]
- 5.Saletu B, Klosch G, Gruber G, Anderer P, Udomratn P, Frey R. First-night-effects on generalized anxiety disorder (GAD)-based insomnia: laboratory versus home sleep recordings. Sleep. 1996;19:691–7. [PubMed] [Google Scholar]
- 6.Woodward SH, Bliwise DL, Friedman MJ, Gusman FD. First night effects in post-traumatic stress disorder inpatients. Sleep. 1996;19:312–7. doi: 10.1093/sleep/19.4.312. [DOI] [PubMed] [Google Scholar]
- 7.Park JH, Cha HY, Seo JJ, Hong JT, Han K, Oh KW. Anxiolytic-like effects of ginseng in the elevated plus-maze model: comparison of red ginseng and sun ginseng. Prog Neuropsychopharmacol Biol Psychiatry. 2005;29:895–900. doi: 10.1016/j.pnpbp.2005.04.016. [DOI] [PubMed] [Google Scholar]
- 8.Lee SH, Jung BH, Kim SY, Lee EH, Chung BC. The antistress effect of ginseng total saponin and ginsenoside Rg3 and Rb1 evaluated by brain polyamine level under immobilization stress. Pharmacol Res. 2006;54:46–9. doi: 10.1016/j.phrs.2006.02.001. [DOI] [PubMed] [Google Scholar]
- 9.Carr MN, Bekku N, Yoshimura H. Identification of anxiolytic ingredients in ginseng root using the elevated plus-maze test in mice. Eur J Pharmacol. 2006;531:160–5. doi: 10.1016/j.ejphar.2005.12.014. [DOI] [PubMed] [Google Scholar]
- 10.Wei XY, Yang JY, Wang JH, Wu CF. Anxiolytic effect of saponins from Panax quinquefolium in mice. J Ethnopharmacol. 2007;111:613–8. doi: 10.1016/j.jep.2007.01.009. [DOI] [PubMed] [Google Scholar]
- 11.Wiklund I, Karlberg J, Lund B. A double-blind comparison of the effect on quality of life of a combination of vital substances including standardized ginseng G115 and placebo. Curr Ther Res. 1994;55:32–42. [Google Scholar]
- 12.Neri M, Andermarcher E, Pradelli JM, Salvioli G. Influence of a double blind pharmacological trial on two domains of well-being in subjects with age associated memory impairment. Arch Gerontol Geriatr. 1995;21:241–52. doi: 10.1016/0167-4943(95)00659-9. [DOI] [PubMed] [Google Scholar]
- 13.Tode T, Kikuchi Y, Hirata J, Kita T, Nakata H, Nagata I. Effect of Korean red ginseng on psychological functions in patients with severe climacteric syndromes. Int J Gynaecol Obstet. 1999;67:169–74. doi: 10.1016/s0020-7292(99)00168-x. [DOI] [PubMed] [Google Scholar]
- 14.Shibata S. Chemistry and cancer preventing activities of ginseng saponins and some related triterpenoid compounds. J Korean Med Sci. 2001;16(Suppl):S28–37. doi: 10.3346/jkms.2001.16.S.S28. [DOI] [PMC free article] [PubMed] [Google Scholar]
- 15.Hasegawa H, Sung JH, Matsumiya S, Uchiyama M. Main ginseng saponin metabolites formed by intestinal bacteria. Planta Med. 1996;62:453–7. doi: 10.1055/s-2006-957938. [DOI] [PubMed] [Google Scholar]
- 16.Hasegawa H. Proof of the mysterious efficacy of ginseng: basic and clinical trials: metabolic activation of ginsenoside: deglycosylation by intestinal bacteria and esterification with fatty acid. J Pharmacol Sci. 2004;95:153–7. doi: 10.1254/jphs.fmj04001x4. [DOI] [PubMed] [Google Scholar]
- 17.Hasegawa H, Sung JH, Benno Y. Role of human intestinal Prevotella oris in hydrolyzing ginseng saponins. Planta Med. 1997;63:436–40. doi: 10.1055/s-2006-957729. [DOI] [PubMed] [Google Scholar]
- 18.Hasegawa H, Sakamoto M, Benno Y. Bacteroides uniformis as the dominant bacterial species involved in activation of ginseng protopanaxadiol saponins in humans intestines. J Trad Med. 2007;24:140–3. [Google Scholar]
- 19.Hasegawa H, Benno Y. Clinical evaluation of probiotic Lactobacillus paracasei A221 for standardizing ginseng-hydrolyzing potentials of human intestinal bacteria. J Trad Med. 2006;23:42–6. [Google Scholar]
- 20.Holzapfel WH, Haberer P, Geisen R, Bjorkroth J, Schillinger U. Taxonomy and important features of probiotic microorganisms in food and nutrition. Am J Clin Nutr. 2001;73(Suppl):365S–373S. doi: 10.1093/ajcn/73.2.365s. [DOI] [PubMed] [Google Scholar]
- 21.Bourin M, Hascoet M. The mouse light/dark box test. Eur J Pharmacol. 2003;463:55–65. doi: 10.1016/s0014-2999(03)01274-3. [DOI] [PubMed] [Google Scholar]
- 22.Lister RG. The use of a plus-maze to measure anxiety in the mouse. Psychopharmacology (Berl) 1987;92:180–5. doi: 10.1007/BF00177912. [DOI] [PubMed] [Google Scholar]
- 23.Rechtschaffen A, Kales A. Los Angeles: Brain information Service, University of California; 1968. A manual of standardized terminology, technique and scoring system for sleep stages of human subjects. [Google Scholar]
- 24.Ishihara K, Saito T, Miyata Y. Sleepiness scale and an experimental approach [Article in Japanese] Shinrigaku Kenkyu. 1982;52:362–5. [PubMed] [Google Scholar]
- 25.Suetsugi M, Mizuki Y, Yamamoto K, Uchida S, Watanabe Y. The effect of placebo administration on the first-night effect in healthy young volunteers. Prog Neuropsychopharmacol Biol Psychiatry. 2007;31:839–47. doi: 10.1016/j.pnpbp.2007.01.019. [DOI] [PubMed] [Google Scholar]
- 26.Naval MV, Gomez-Serranillos MP, Carretero ME, De Arce C. Value of high-performance liquid chromatographic analysis of amino acids in the determination of Panax ginseng radix extract effect in cultured neurons. J Chromatogr A. 2006;1121:242–7. doi: 10.1016/j.chroma.2006.04.051. [DOI] [PubMed] [Google Scholar]
- 27.Yuan CS, Attele AS, Wu JA, Liu D. Modulation of American ginseng on brainstem GABAergic effects in rats. J Ethnopharmacol. 1998;62:215–22. doi: 10.1016/s0378-8741(98)00066-x. [DOI] [PubMed] [Google Scholar]
- 28.Kim HS, Hong YT, Oh KW, et al. Inhibition by ginsenosides Rb1 and Rg1 of methamphetamine-induced hyperactivity, conditioned place preference and postsynaptic dopamine receptor supersensitivity in mice. Gen Pharmacol. 1998;30:783–9. doi: 10.1016/s0306-3623(97)00330-3. [DOI] [PubMed] [Google Scholar]
- 29.Kim HS, Kim KS, Oh KW. Inhibition by ginsenosides Rb1 and Rg1 of cocaine-induced hyperactivity, conditioned place preference, and postsynaptic dopamine receptor supersensitivity in mice. Pharmacol Biochem Behav. 1999;63:407–12. doi: 10.1016/s0091-3057(99)00020-9. [DOI] [PubMed] [Google Scholar]
- 30.Kim HS, Zhang YH, Fang LH, Lee MK. Effects of ginsenosides on bovine adrenal tyrosine hydroxylase. J Ethnopharmacol. 1999;66:107–11. doi: 10.1016/s0378-8741(98)00238-4. [DOI] [PubMed] [Google Scholar]
- 31.Cho J, Park W, Lee S, Ahn W, Lee Y. Ginsenoside-Rb1 from Panax ginseng C.A. Meyer activates estrogen receptor-alpha and -beta, independent of ligand binding. J Clin Endocrinol Metab. 2004;89:3510–5. doi: 10.1210/jc.2003-031823. [DOI] [PubMed] [Google Scholar]
- 32.Bodo C, Rissman EF. New roles for estrogen receptor beta in behavior and neuroendocrinology. Front Neuroendocrinol. 2006;27:217–32. doi: 10.1016/j.yfrne.2006.02.004. [DOI] [PubMed] [Google Scholar]
- 33.Lee BM, Lee SK, Kim HS. Inhibition of oxidative DNA damage, 8-OHdG, and carbonyl contents in smokers treated with antioxidants (vitamin E, vitamin C, beta-carotene and red ginseng) Cancer Lett. 1998;132:219–27. doi: 10.1016/s0304-3835(98)00227-4. [DOI] [PubMed] [Google Scholar]


