Abstract
Extrapolation from studies of chemical carcinogenicity in rodents, at high doses, to humans, at the typically low doses to which we are exposed, has been one of the most controversial issues in toxicology. Many chemical carcinogenesis experiments currently are evaluated on a linear scale for dose. Log dose has been the standard for decades in pharmacology and toxicology for noncancer toxicities and there is no reason to think that it should not apply to chemical carcinogenesis. Furthermore, log dose is consistent with fundamental principles of chemistry. Direct comparisons of linear and logarithmic scales for dose illustrate the deceptive nature of linear plots for dose; low doses, which is where our interest lies in comparing human exposures, are compressed beyond evaluation by a linear scale. Unequivocal thresholds for carcinogenicity are shown when the dose-response curves for animal studies done at high doses are evaluated on a log scale for dose. This observation now raises the issue of the relevance to human exposures of these high-dose experiments in animals. Studies analyzed by this log dose to linear response procedure demonstrate that the thresholds from animal experiments can be used to calculate safety factors for human exposure and that humans are more resistant than animals to carcinogenesis from chemicals.
Keywords: dose response, chemical carcinogenesis, extrapolation, risk assessment, thresholds
INTRODUCTION
The shapes of dose-response curves were first analyzed critically by Gaddum (1945) when he recognized empirically that dose should be plotted on a logarithmic scale for a linear quantal response. Pharmacologists have been plotting dose on a logarithmic scale ever since that publication. Toxicologists have also used that scale for noncancer experiments but, for some unexplained reason, most authors of chemical carcinogenesis experiments have instead preferred a linear scale for dose. Gaddum did not offer a basic scientific reason for the logarithmic scale, but Waddell (2002) proposed that this was consistent with the concept of chemical potential and the law of mass action and that it should apply to all quantal responses, including chemical carcinogenesis. The linear plot for dose is very deceptive and compresses low doses so that evaluation in that range is impossible; however, this has not heretofore been clearly recognized. This paper is an attempt to demonstrate that deception and the difficulty in evaluating effects at low doses. More complete demonstrations of thresholds for carcinogenesis are presented in previous publications (Waddell, 2002, 2003a, 2003b, 2003c, 2003d). The Rozman scale (Rozman, et al., 1996) was used in all these analyses because it is ideally suited for evaluation of chemical carcinogenesis. The thresholds that are demonstrated from the animal experiments can be used to calculate safety factors for human exposure. In some instances human exposures are at or very near the thresholds in animal experiments (Waddell, 2003d). This indicates that humans are more resistant to the carcinogenic effect of at least some chemicals.
METHODS
SlideWrite Plus, Version 6, from Advanced Graphics Software, Encinitas, California, was used for all of the calculations and graphs, except of course the figures reproduced from the original ED01 report. Data from the ED01 (Littlefield et al., 1980) and the Peto et al. (1991) reports were used to plot the percent liver and esophageal tumors, respectively, against dose on either a linear (as was done in the original reports) or a logarithmic scale. The Rozman et al. (1996) scale is ideal for the abscissa; it was used for the logarithmic scale for three reasons. First, it is logarithmic for dose and linear for effect, which is consistent with fundamental principles of chemistry (Waddell and Bates, 1969). Second, it is continuous down to one molecule, which allows comparison of all doses. And third, it uses molecules per kilogram instead of mg/kg, ppm, and so forth, which allows direct comparison of compounds with different molecular weights.
RESULTS
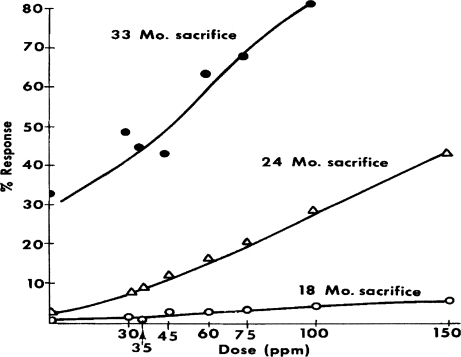
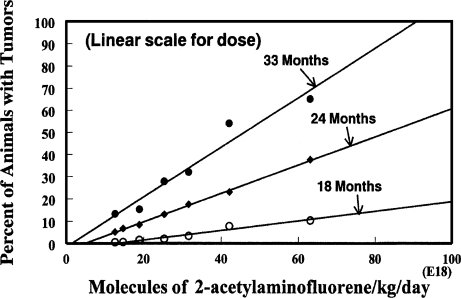
Figure 1 is reproduced from Figure 4 of the Littlefield et al. (1980) publication to show how the original results of the ED01 study on 2-acetylaminofluorene for liver neoplasms were presented for evaluation. Note that both abscissa and ordinate are linear scales and that the values for tumors in the unexposed animals are shown at zero dose. Figure 2 shows the same data, on the same scales, after subtracting the number of tumors in each of the control groups. The linear extrapolations for each of the three time intervals do indeed appear to be pointed in the general direction of the 0, 0 origins; however, it should be noted carefully that the lines do not extend exactly to those origins. Figure 3 shows the range of doses that were studied in the ED01 report; it also indicates how the extrapolations lie in the narrow space for doses approximately at or below 1019. This is, of course, where our interest lies for extrapolation to doses to which humans likely might be exposed. Figure 4 shows the same doses that were used in the ED01 study plotted on the logarithmic scale of Rozman et al. (1996) which demonstrates how much the linear scale compressed the doses below 1019 and made it virtually impossible to discern the exact value of their intercepts. Figure 5 shows the same data that were presented in Figure 2, but now plotted on the logarithmic scale for dose. With this plot all doses are placed in perspective and the intercepts with the abscissa are readily evaluated.
FIGURE 1.
The prevalence of liver neoplasms in sacrificed mice in respect to dose of 2-acetyl-aminofluorene in the ED01 study. Reproduced by permission from Figure 4 of Littlefield et al. (1980).
FIGURE 4.
Doses administered in the ED01 study plotted as molecules/kg/day on a log scale.
FIGURE 2.
Liver neoplasms in sacrificed mice from 2-acetylaminofluorene. Same data as in Figure 1 but minus control values.
FIGURE 3.
Doses administered in the ED01 study plotted as molecules/kg/day on a linear scale.
FIGURE 5.
Liver neoplasms in sacrificed mice at 18, 24, and 33 months from 2-acetylaminofluorene. Same data as in Figure 2.
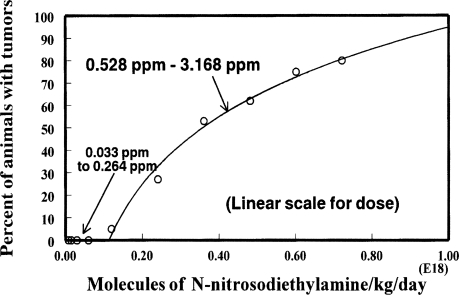
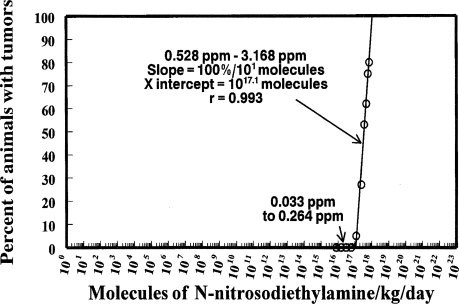
Figure 6 shows the data from Table 3 of the Peto et al. (1991) publication for the percent esophageal tumors produced in rats from N-nitrosodiethylamine in the drinking water. The data are plotted on linear scales for both the abscissa and the ordinate as was done in the Peto et al. article. This demonstrates how compression of the low doses deceptively suggests that the extrapolation may indicate that there is no threshold for tumor production from the chemical. Indeed, that was the conclusion of those authors. However, careful inspection does show an intercept of the line on the abscissa above zero. It is the compression of the scale, for low doses that is deceptive. Figure 7 shows the same data plotted on the logarithmic scale, where all doses are placed in perspective and the intercept of the extrapolation with the abscissa well above a single molecule is clearly shown.
FIGURE 6.
Esophageal tumors from N-nitrosodiethylamine in male rats plotted on a linear scale for dose. Data are from Table 3 of Peto et al. (1991).
FIGURE 7.
Same data as Figure 6 but plotted on a log scale for dose.
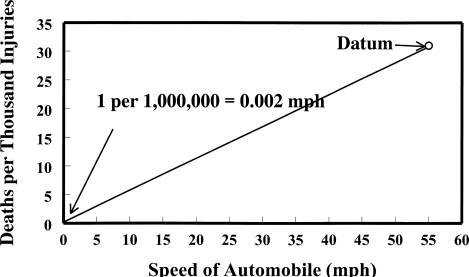
Figure 8 shows a hypothetical chemical that produces tumors in 3.1% of the animals when administered 55 mg/kg/day. The extrapolation is based on the assumption that the data extend linearly to the 0, 0 origins. With this same interpretation, in order to have only one tumor in a million individuals, the dose would be 0.002 mg/kg/day. Figure 9 illustrates how the same numbers could be used to extrapolate to one in a million deaths from actual data on highway deaths in the United States per thousand injuries at a speed of 55 mph (Baker et al., 1992). This same thinking would set the speed limit at 0.002 mph.
FIGURE 8.
Data illustrating the basic assumption in the linearized multistage procedure with linear extrapolation of data from animal experiments forced through 0, 0 origins.
FIGURE 9.
Extrapolation of deaths per thousand injuries at 55 mph by same procedure as that used in the linearized multistage. Data at 55 mph are from Baker et al. (1992).
DISCUSSION
The precise relationship of the dose of a chemical to its effect on biological systems has always been important to pharmacologists and toxicologists. Indeed, it is the basis of the distinction between pharmacology and toxicology. The transition from a useful, therapeutic, or pharmacological effect to an adverse or toxic effect depends on the dose, and the nature of that transition is described by the dose-response curve. Gaddum (1945) was the first to recognize and describe, based merely on empirical observations, that biological measurements (and in particular dose of a chemical) should be considered on a logarithmic scale in order to effect a linear quantal response. He further introduced the additional statistical correction for normal distributions by incorporating the standard deviation into his “log-normal distribution” graphs or probit plots. Pharmacologists have used probit paper to obtain linear correlations between doses of chemicals and effects for decades. There seems to be no criticism of this time-honored relationship. Toxicologists have also considered this relationship as standard for all noncancer adverse effects. However, it is curious that, when carcinogenesis is under discussion, dose is usually considered on a linear scale. Perhaps this arose from the notion that a single molecule might produce cancer and that just a few molecules were important; consequently, logarithmic notation was considered unnecessary.
This “linear-dose” thinking has predominated in the analysis of chemical carcinogenesis and, in particular, in extrapolation from experiments in animals to risk assessment in humans. The principle of this thinking presumes that any dose or doses that cause a statistical increase in tumors in experimental animals can be assumed to decrease linearly, with dose on a linear scale, to zero dose. This assumes that, in a sufficiently large population, zero tumors will be produced only with a zero dose of the chemical. Humans are being exposed to an increasing number of chemicals that have been shown to be carcinogenic in animals, and epidemiological studies frequently do not concur that there is an increase in cancer in humans exposed to these same chemicals. Consequently, many observers have questioned this assumption of a linear extrapolation to zero dose (e.g., to cite but a few, Waddell 1993, 1996, 2003d; Rozman et al., 2001).
Although Gaddum (1945) recognized empirically that dose on a logarithmic scale effected a linear quantal response, he apparently did not recognize the fundamental principle that explained it. The logarithmic relationship of dose to any quantal response emanates from basic principles of chemistry. The chemical potential of a substance, when its chemical potential in the standard state is zero, may be stated as follows: μ = RT ln a, where μ is the chemical potential whose activity is represented by a, R is the gas constant, and T is the absolute temperature. Alternatively, differences in chemical potential between two activities (concentrations) are directly proportional to the logarithm of the ratios of the activities: μ1 – μ2 = RT ln a1 – RT ln a2 or μ1 – μ2 = RT ln (a1/a2). Another consideration is the law of mass action: A + B ⇔ C + D, where A, B, C, and D represent concentrations of reactants and products, respectively. The displacement from equilibrium, or steady state, of this reaction by the addition of an additional quantity of A will depend on the concentration of A at the initial equilibrium (or steady state). For example, the addition of 1 mmol of A will have a greater effect on the reaction if the concentration of A is 1 mmol at initial equilibrium than it will if the initial concentration of A is 100 mmol.
The direct comparisons of dose on linear and logarithmic scales in this paper are intended to demonstrate the artifactual problem with the linear plot. Not only is it not consistent with the basic principles of chemistry, but it makes discernment of events in the low-dose range impossible.
Previous publications using the Rozman scale for the analysis of chemical carcinogenesis experiments in animals mostly show thresholds in animals well above doses to which humans are exposed (Waddell, 2002, 2003d). In these cases a safety factor can be shown. In other studies, human exposures are at or very near the animal thresholds, yet no human cancers are seen at these doses (Waddell, 2003d). This is interpreted to indicate that humans are more resistant to the carcinogenic effect of these chemicals and gives some reassurance of safety even when humans are exposed to the threshold dose in animals.
Figures 8 and 9 are merely intended to illustrate the severe flaw in a linear extrapolation that forces the line through the 0, 0 origins. By ignoring information in the low-dose (or low-mph) range, absurd results are obtained. For example, the number of deaths at only 1 or 2 mph may already be zero without extension to 0.002 mph. The shape of the dose-response, or deaths at different highway speeds, curves needs to be determined without forcing the response through the 0, 0 origins.
REFERENCES
- Baker SP, O’Neill B, Ginsburg MJ, Li G. The Injury Fact Book. 2nd ed. New York: Oxford University Press, Inc; 1992. p. 252. [Google Scholar]
- Gaddum JH. Lognormal distributions. Nature. 1945;156:463. [Google Scholar]
- Littlefield NA, Farmer JH, Gaylor DW, Sheldon WG. Effects of dose and time in a long term low dose carcinogenic study. J Environ Path Tox. 1980;3:17–34. [PubMed] [Google Scholar]
- Peto R, Gray R, Brantom P, Grasso P. Effects on 4080 rats of chronic ingestion of N-nitrosodiethylamine or N-nitrosodimethylamine: A detailed dose-response study. Cancer Research. 1991;51:6415–6451. [PubMed] [Google Scholar]
- Rozman KK, Kerecsen L, Viluksela MK, Österle D, Deml E, Viluksela M, Stahl BU, Greim H, Doull J. A Toxicologist’s View of Cancer Risk Assessment. Drug Metab Rev. 1996;28:29–52. doi: 10.3109/03602539608993990. [DOI] [PubMed] [Google Scholar]
- Rozman KK, Doull J, Hayes WJ., Jr . Dose, time and other factors influencing toxicity. In: Krieger R, editor. Handbook of Pesticide Toxicology. Vol. 1. San Diego: Academic Press; 2001. pp. 1–93. [Google Scholar]
- Waddell WJ. Human risk factors to naturally occurring carcinogens: Thresholds, inhibitors and inducers. J Toxicol Sci. 1993;18:73–82. doi: 10.2131/jts.18.73. [DOI] [PubMed] [Google Scholar]
- Waddell WJ. Reality versus extrapolation: An academic perspective of cancer risk regulation. Drug Metab Rev. 1996;28:181–195. doi: 10.3109/03602539608993998. [DOI] [PubMed] [Google Scholar]
- Waddell WJ. Thresholds of carcinogenicity of flavors. Tox Sci. 2002;68:275–279. doi: 10.1093/toxsci/68.2.275. [DOI] [PubMed] [Google Scholar]
- Waddell WJ. Thresholds of carcinogenicity in the ED01 study. Tox Sci. 2003a;72:158–163. doi: 10.1093/toxsci/kfg004. [DOI] [PubMed] [Google Scholar]
- Waddell WJ. Threshold of carcinogenicity of nitrosodiethylamine for esophageal tumors in rats. Food Chem Tox. 2003b;41:739–741. doi: 10.1016/s0278-6915(02)00330-7. [DOI] [PubMed] [Google Scholar]
- Waddell WJ. Thresholds in chemical carcinogenesis: What are animal experiments telling us? Tox Path. 2003c;31:260–262. doi: 10.1080/01926230390204405. [DOI] [PubMed] [Google Scholar]
- Waddell WJ. Comparison of human exposures to selected chemicals with thresholds from NTP carcinogenicity studies in rodents. Hum Exp Toxicol. 2003d;22:501–506. doi: 10.1191/0960327103ht374oa. [DOI] [PubMed] [Google Scholar]
- Waddell WJ, Bates RG. Intracellular pH. Physiol Rev. 1969;49:285–329. doi: 10.1152/physrev.1969.49.2.285. [DOI] [PubMed] [Google Scholar]


