

Abstract
Motivation: To efficiently analyze the ‘native ensemble of conformations’ accessible to proteins near their folded state and to extract essential information from observed distributions of conformations, reliable mathematical methods and computational tools are needed.
Result: Examination of 24 pairs of structures determined by both NMR and X-ray reveals that the differences in the dynamics of the same protein resolved by the two techniques can be tracked to the most robust low frequency modes elucidated by principal component analysis (PCA) of NMR models. The active sites of enzymes are found to be highly constrained in these PCA modes. Furthermore, the residues predicted to be highly immobile are shown to be evolutionarily conserved, lending support to a PCA-based identification of potential functional sites. An online tool, PCA_NEST, is designed to derive the principal modes of conformational changes from structural ensembles resolved by experiments or generated by computations.
Availability: http://ignm.ccbb.pitt.edu/oPCA_Online.htm
Contact: lwy1@iam.u-tokyo.ac.jp
Supplementary information: Supplementary data are available at Bioinformatics online.
1 INTRODUCTION
Principal Component Analysis (PCA) is a widely used technique to retrieve dominant patterns and representative distributions from noisy data (Jolliffe, 2002). The idea is to map the investigated complex system from a multidimensional space to a reduced space spanned by a few principal components (PCs), thus elucidating the principal/dominant features underlying the observed data. In structural biology, the ensembles of structures accessible to a given biomolecule form such complex data, which upon suitable analyses may provide information on conformational motions (Amadei et al., 1993; Garcia 1992; Hayward et al., 1993; Kitao et al., 1991). Studies such as the quasi-harmonic analysis of molecular dynamics (MD) (Hayward et al., 1993; Kitao et al., 1991; Kitao et al., 1998) or Monte Carlo (MC) trajectories (Kenzaki and Kikuchi, 2008), the essential dynamics analysis of MD runs (Amadei et al., 1993), the analyses of the ensembles generated by non-Newtonian approaches (Barrett et al., 2004), the definition of human Major Histocompatibility Complex supertypes (Doytchinova et al., 2004) and the clustering of NMR ensembles of structural models determined by Nuclear Magnetic Resonance (NMR) (Howe, 2001) are just a few examples of PCA applications. Despite its widely recognized utility, a user-friendly, high-throughput online PCA tool that takes as input experimentally determined (e.g. X-ray, NMR) or theoretically generated (e.g. by MD, MC or comparative modeling) structural ensembles to yield functionally relevant information is lacking.
The PCA of the native ensemble of structures accessible to a given biomolecule is shown in the present study to provide information on functional dynamics and biomolecular design features. Calculations performed for NMR ensembles of structures show that, in 20 out of 24 examined proteins, the conformational differences Δ{Φ} observed between the NMR structures and their X-ray counterparts are consistent with the principal modes of motion identified by PCA and supported by the physics-based anisotropic network model (ANM; Atilgan et al., 2001; Eyal et al., 2006) (Section 3.1). These ‘robust modes’, insensitive to model parameters and methods, point to directions of conformational changes that are energetically favored by the particular topology of native contacts. We argue that the molecules are designed to so move for functional reasons (Alexandrov et al., 2005; Bahar and Rader, 2005; Ma, 2005; Tama and Brooks, 2006; Yang and Chng, 2008). Evidence is given here that catalytic residues of 12 examined enzymes are shown to occupy highly constrained, ‘immobile’, positions along the dominant PC profiles (Section 3.2). Notably, the residues identified to be highly constrained in these robust PC modes are verified to be evolutionarily conserved, further supporting the utility of the PCA of structural ensembles for identifying potential functional sites (PFSs).
Finally, we will present in Section 3.3 a new web resource, PCA_NEST (PCA of Native Ensembles of STructures), which uses as input ensembles of protein and/or polynucleotide structures accessible under native state conditions, and releases the corresponding principal modes of structural changes and PFSs via a user-friendly interface.
2 THEORY AND METHOD
2.1 Ensembles of structures
In the present study, the term ‘ensemble’ refers to a collection of structures sampled under native state conditions by a given biomolecule, namely a protein, a polynucleotide, or a complex (Fig. 1a). The members of the ensemble are referred to as conformations, structural frames or simply ‘models’. The flow diagram in Figure 2 describes how PCA results are generated for a given set of input data. The input can be an ensemble of NMR models (>7000 such ensembles have been deposited in the PDB as of February, 2008) or a collection of X-ray structures for the same protein (or those having high sequence identity). The PDB presently contains >5987 such non-single-member families (Qi et al., 2005) that share >90% sequence identity. Alternatively, MD or MC snapshots may be used as structural models. Finally, models predicted from sequence data using ab initio or comparative modeling methods may serve as input.
Fig. 1.

An ensemble of conformations and corresponding variations in residue positions. (a) An ensemble of NMR models (teal) for ubiquitin (1xqq; Lindorff-Larsen et al., 2005) and corresponding X-ray structure (1ubq; yellow), are optimally superimposed as described in Method (left). The mean structure of the NMR ensemble (gray) moves towards its X-ray counterpart (yellow) along the first PC mode, v(1), indicated by the blue arrows (right). (b) Per residue RMSD, <(Δqi)2>1/2 [based on α-carbons; see Equation (2)] as a function of residue index i, derived from the NMR ensemble shown in (a). (c) Difference, Δ{Φ}i (blue, solid curve) in the position of residue i, between the average NMR and the X-ray structures and comparison with the first PC mode |vi(1)| (red, dotted curve).
Fig. 2.

Flow diagram of PCA_NEST. The ensemble of native structures is subjected to PCA at two levels, atomic (left column) and CG (right column). See the text for more details.
2.2 Optimal superimposition of structural frames
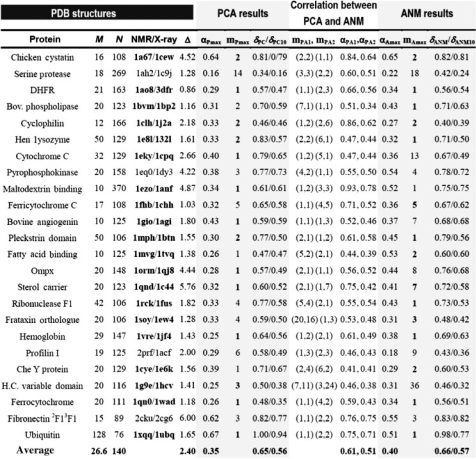
Our main interest is to analyze the internal motions. We remove the contributions from rigid-body translations and rotations by optimal alignment of the models using Kabsch (1976) algorithm. This algorithm gives a unique solution that minimizes the root-mean-square deviation ( ) between the examined models. Each model f is represented by a 3N-dimensional vector
| (1) |
where qfi=[xfi yfi zfi] is the position vector of atom i in model f for a protein of N atoms (or residues in the coarse-grained (CG) representation where Cα atom coordinates are used for each residue position). The RMSD, <(Δqi)2>1/2, in the position of atom i is found from
 |
(2) |
where 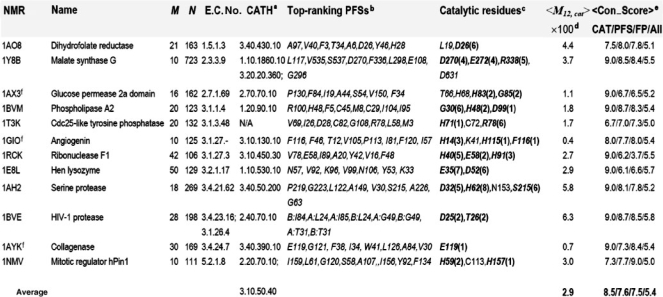 is the position vector of the i-th atom averaged over the ensemble of M models. Figure 1b displays the <(Δqi)2>1/2 profile for ubiquitin, deduced from the NMR models shown in Figure 1a, for example. The
  averaged over all atoms is written as
 |
(3) |
A best-fitting procedure is iterated until the RMSD between successive average frames is converged (see flow diagram in Fig. 2).
2.3 Principal Component Analysis (PCA)
For an ensemble containing M frames (1≤f≤M) and N heavy atoms (or CG-nodes) (1≤i≤N) per frame, we build a covariance matrix
| (4) |
Here Q is a matrix of M columns consisting each of 3N-dimensional vectors of N super-elements (3D vectors). The corresponding i-th super-element
| (5) |
describes the deviation of atom i from its mean position  . C can be decomposed as
| (6) |
where V is the matrix of the 3N-dimensional eigenvectors v(k) (1≤k≤M) associated with the M non-zero PC modes, and Σ1/2 is the diagonal matrix of the square root ξk1/2 of the corresponding eigenvalues, obtained from the singular value decomposition (SVD) of Q. The 3N-elements of v(k) describe the variations in the positions of the N nodes associated with PC mode k, each given by a 3D vector vi(k)(1≤i≤N) (see the arrows in Figs 1a (right) and 3a) and the ξk1/2 represents the weight of the mode k, the modes being rank-ordered as ξ1≥ξ2≥…≥ξM. The largest contributions to conformational variations come from the top-ranking PC modes. For a system of M<3N frames, the decomposition of C yields M non-zero modes. U is the M × M PC coordinates matrix (UUT=I) that maps the frames in the PC space back to their original coordinate system, as may be inferred from Equation (6). The SVD of QT is computationally faster than the eigenvalue decomposition of C when M<3N, which is the case for NMR models; hence the use of SVD in our web implementation.
Fig. 3.

PCA_NEST outputs and interfaces, illustrated for HIV-1 protease (PDB code: 1bve). (a) Conformational changes along the first PC mode. The diagram represents a snapshot from a JMol animation describing the conformational fluctuations favored by this particular mode. The arrows refer to the elements of the first eigenvector v(1); they describe the directions of the movements of each CG-node, and their lengths are proportional to the magnitude of the fluctuations. Active sites Asp25 and Thr26 are shown in spheres. (b) Residue–residue correlation map for the first PC mode (see Supplementary Material for details) (c) M12,i profiles [see Equation (8)] for monomers A and B of HIV-1 protease. The minima in the profile are further analyzed (with regard to the solvent exposure and spatial clustering of the corresponding residues) to identify PFSs. (d) Ribbon diagram illustrating the PCA_NEST-defined dynamic domains. Different colors indicate substructures subject to opposite direction (anticorrelated) movements in the first PC mode. We note that active sites are located near the interface between the dynamic domains in the center of the molecule. (e) Decoys along the PC mode 1. Decoys are created in pairs (along the positive and negative directions of the first PC), and they are automatically submitted to DynDom (Hayward and Berendsen, 1998) for dynamic domain analysis. (f) Distribution of the 128 NMR frames deposited for ubiquitin (1xqq) on the conformational subspace spanned by PC modes 1 and 2. Such projection onto a reduced space allows for clustering structures based on their dominant conformational features.
2.4 Correlation between structural changes and PC modes
The conformational change between two conformations for a given protein is given by a 3N-dimensional vector Δ{Φ}. The elements of Δ{Φ} are the x-, y- and z-components of the changes in the position vectors of the N atoms (or nodes in the CG model). The correlation, αP,k, between Δ{Φ} and the k-th PC mode v(k) is defined as
| (7) |
where • designates the dot product, and the bars denote the magnitudes. The cumulative contribution of M PC modes, δPC is evaluated from δPC=(∑αP,i2)1/2(1≤i≤M). Alternatively, the summation over M′ (≤M) modes gives the cumulative contribution δPC,M′ of M′ modes (see the footnote of Table 1). Similar expressions apply to the correlations with ANM modes.
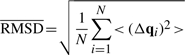
Table 1.
Identification of the PC and ANM modes that dominate experimentally observed conformational changesa
 |
aPDB codes for 24 pairs of homologous NMR and X-ray structures are listed in the column ‘NMR/X-ray’. M and N are the available number of NMR models and the number of residues for a given protein respectively. Δ is the RMSD (Å) between the average NMR structure and the corresponding X-ray structure. The mPmax is the index of the PC mode that shows maximal correlation with Δ{Φ}, and αP,max is the corresponding correlation (Equation 7 with k=mPmax). δPC is the cumulative contribution of all PC modes, δPC=(∑αP,i2)1/2(1≤i≤M). The δPC10 is the counterpart of δPC based on the first 10 modes (1≤i≤10). The mAmax is the index of the ANM mode that shows the highest correlation with Δ{Φ}. The corresponding correlation is αA,max. Bold-faced mpmax/mAmax values correspond to the 20 cases where robust modes describe most of observed conformational changes (see main text). δANM is the ANM counterpart of δPC. The highest and second highest correlations observed between pairs of PC- and ANM-modes are αPA1 and αPA2 respectively. The corresponding pairs of mode numbers are mPA1 and mPA2, respectively.
2.5 Potential Functional Sites (PFSs)
In accord with our previous study (Yang and Bahar, 2005), PFSs are found from minima in the mobility profiles
| (8) |
reflecting the weighted sum of the top-ranking two PC modes (1≤i≤N). Minima of interest are based on groups of five sequential nodes, with the center being lower than the first two neighbors on each side. We also require that the M12,i value of the PFSs to be <10% of that exhibited by the most mobile node in the structure. Figure 3c illustrates the M12,i profile for HIV-1 protease.
2.6 Minima-screening algorithm to rank-score the PFSs
Not all the PFSs (or minima) have equal functional importance. We further score those PFSs based on their relative solvent accessibility and spatial clustering properties (see Supplementary Material for details). The algorithm, referred to as minima-screening algorithm, depends merely on inter-residue contact topology. The top-scoring eight (or less) PFSs for the examined proteins are listed at the bottom of the ‘Potential Functional Sites’ page of PCA_NEST.
2.7 Residue conservation
Residue conservation scores are assigned using the Consurf server (Landau et al., 2005) and used for examining the degree of sequence conservation at the PFSs. Conservation scores range from 1 (highly diverse) to 9 (highly conserved).
2.8 Residue correlations and dynamic domains
The residue–residue correlation map generated by PCA_NEST is a color-coded covariance matrix of N × N dimension, the ij-th element of which is defined as
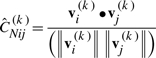 |
(9) |
The covariance values vary in the range [−1, 1]. Positive values refer to pairs of residues moving in the same direction along mode k, and negative values refer to those moving in opposite directions. Moreover, The plus and minus signs of the values in the most dominant eigenvector, obtained from SVD of ĈNij(k), classifies the nodes into two motional subsets, which can be used to define the dynamic domains (see Supplementary Material).
3 RESULTS
The results are organized in three subsections. First, we show how the top-ranking PC modes satisfactorily describe the structural difference between X-ray- and NMR-characterized conformers. Second, we focus on particular enzymes to demonstrate how the PCA-predicted PFSs correlate with catalytic residues and/or evolutionarily conserved sites. Third, we present an overview of the newly designed resource, PCA_NEST, and its visualization and comparative analyses features.
3.1 Robust PC modes explain the conformational change between NMR and X-ray conformers
The top-ranking PC modes derived from a given NMR ensemble convey information on the most probable changes in conformations sampled by the examined molecule. We will explore the existence of a correlation between these conformational variations and a physical-model (ANM) derived dynamics. Also, due to the ease of moving along soft PC modes, we will examine to what extent the differences Δ{Φ} in the NMR and X-ray conformers relate to reconfigurations along these PC modes.
3.1.1 Do structural differences Δ{Φ} between NMR and X-ray conformers correlate with PC modes derived from NMR models?
The results for the examined 24 proteins are presented in Table 1, organized in three sets of columns: PCA results, ANM results and their correlations. We identified in each case the PC mode (mPmax) that exhibits the highest correlation (αPmax) with the experimentally observed conformational change Δ{Φ} [see Equation (6)]. Notably, a correlation coefficient of 0.35 is achieved by this single mode, averaged over all examined cases (last row in Table 1), while in some cases the value can be above 0.6 (e.g. 1a67, 2cku and 1xqq). The single mode that exhibits the highest correlation is the first mode in 11/24 of the cases, the second mode in 5/24 and the third in 3/24 cases. Column 8 lists the cumulative correlation (δPC) resulting from all M modes. The corresponding average over all proteins is <δPC>=0.65 between the PC modes and Δ{Φ}. Note that this correlation is achieved by a small subset (∼6%) of the accessible 3N-6 modes (see the average M and N in the last row of Table 1; <M>/(3<N>−6)≈6%).
3.1.2 How does the physics-based model ANM describe Δ{Φ}?
CG normal mode analysis with ANM (Eyal et al., 2006; Yang and Chng 2008), using a 15Å cutoff, shows that it is possible to identify a single ANM mode for each protein, which also yields a comparable average correlation (<αAmax>=0.40) with Δ{Φ}. That ‘single mode’ is again amongst the lowest frequency modes (first ANM mode in 9/24 cases, second in 4/24), although this tendency is not as pronounced as the PC modes. The cumulative effect of the slowest M modes (out of a total of 3N-6 ANM modes) amounts to approximately the same average value <δANM>, 0.67.
3.1.3 The modes that underlie the observed Δ{Φ} are shared between PC and ANM modes
A much higher correlation is observed between the PC modes and the ANM modes. Columns 8 and 9 list the mode numbers mPA1 and mPA2 corresponding to the most correlated PC and ANM mode-pairs, and their respective correlations, αPA1 and αPA2. The averages over the 24 proteins yield <αPA1>=0.61 and <αPA1>=0.51. The lack of an even higher correlation is attributed to the anharmonic effects present in the slow PC modes (Kitao et al., 1998). Interestingly, the PC–ANM mode-pairs that exhibit the highest and second-highest correlations coincide with the particular modes mPmax and/or mAmax that best describe Δ{Φ} in 20 out of 24 cases (PDB codes are written in boldface). In other words, the modes that are closely reproduced by the two different methods correlate with Δ{Φ}. For example, the seventh PC mode and the first ANM mode of bovine phospholipase (PDB code: 1bvm) are the most correlated pair while the first PC and the first ANM modes are the second most correlated. ANM mode 1 and PC modes 1 and 7 are therefore the most robust modes, confirmed by both PCA and ANM. Here, the first ANM mode explains Δ{Φ} the most, among any other modes. The conformational changes that take place along these ‘soft’ modes incur, by definition, the lowest energy increase, and therefore lie along the easiest paths of deformation.
Growing evidence has shown that biologically relevant motions are accessed via a few structure-encoded low-frequency modes (Nicolay and Sanejouand, 2006). However, to determine exactly which mode predominantly accounts for such motions remains a difficult task. Also, the above analysis shows that the correlation between a single PC mode and Δ{Φ} is usually low. Here, we propose to consolidate the NMR-derived PC modes by ANM analysis to identify the modes that significantly account for observed changes. The identified robust modes can be advantageously used in template-based structure refinement (Kidera and Gō 1992; Tama et al., 2004).
3.2 Potential Functional Sites (PFSs)
From the set of 64 NMR protein ensembles previously examined (Yang et al., 2007), we selected the subset of enzymes with known Enzyme Class (E.C.) numbers (from Enzyme Structures Database) and catalytic sites (from Catalytic Site Atlas (CSA; Porter et al., 2004) or literature). The M12,i profiles were examined for the resulting set of 12 enzymes. These profiles show that the catalytic sites exhibit a strong tendency to be positioned at the minima (Fig. 4), with an average mobility score of 2.9% over all enzymes (see Table 2; 100% for peak residues in the normalized M12,i profile; 0% for immobile residues), consistent with our earlier physics-based results (Yang and Bahar, 2005).
Fig. 4.

Fluctuation profiles induced by dominant PC modes. Four examples are displayed, which illustrate how the enzyme active sites (green squares) lie at the minima of the normalized M12,i profiles (ordinate) based on PC modes 1 and 2, drawn a function of residue index (abscissa). The ribbon diagrams in the insets show the literature- and CSA-reported (Porter et al., 2004) actives sites for ribonuclease F1 (1rck), hen lysozyme (1e8l), serine protease (1ah2) and HIV-1 protease (1bve) in green ball-and-stick representation. The structural regions predicted to be most critically positioned are colored pink. The two curves in the last panel (1bve) refer to the profiles of the two monomers.
Table 2.
Identification of PFSs based on the PCA of NMR ensembles
 |
aThe ensembles listed here are of distinct structure folds and topologies, based on their CATH number.
bPredicted by PCA_NEST (top scoring eight minima centers identified in the M12,i profile of the enzyme).
cExperimentally determined, accessible from the literature or from manually compiled databases (e.g., CSA; Porter et al., 2004). Residues in boldface are in top-ranking minima predicted by the minima-screening algorithm (rank is indicated in parentheses); those written in italic lie at the minima of the M12,i curve.
dPercent mobility of catalytic residues<M12,CAT> averaged over all catalytic residues for each protein.
eAverage sequence conservation score evaluated using Consurf (‘9’ for most conserved residues; ‘1’ for the least; Landau et al., 2005) for catalytic residues (CAT), for PCA-predicted potential functional sites (PFS), for the false positives predictions (FP) and for all residues (All). The score varies from 1 (most diverse) to 9 (most conserved).
fTruncated proteins. The respective first 13, 5 and 6 N-terminal residues of 1AX3, 1GIO and 1AYK were excluded.
We also note that the profiles contain many (local) minima, and not all of them contain catalytic residues. Toward a further screening of the PFSs for selecting the most probable functional sites, we score-ranked them based on their relative solvent accessibility and spatial clustering properties (Bartlett et al., 2002; Gutteridge et al., 2003). The algorithm, referred to as minima-screening algorithm, depends on inter-residue contact topology exclusively, irrespective of residue type or evolutionary information such as conservation scores (see details in the Supplementary Material). We were able to locate the majority of catalytic residues within the top-ranking 6–8 PFSs (see the ranks in parentheses in the column 8 in Table 2) by using this algorithm.
The aforementioned observations give insights into criteria underlying the design of active sites: (i) enzymes tend to locate their key catalytic power in mechanically constrained (low-mobility), but solvent accessible, positions and (ii) the catalytic sites spatially cluster, irrespective of their separation along the sequence.
As a further verification of the functional significance of PCA_NEST-predicted top-ranking PFSs (other than the catalytic residues), we examined their conservation properties. An average Consurf conservation score (Con_Score; last column of Table 2) of 7.6 was obtained for top-ranking PFSs as opposed to an understandably higher score, 8.5, for catalytic residues and 5.4 for an average residue (A). If we separate the top-ranking PFSs into two sets, the ‘true positives’ that overlap with the catalytic sites (CAT) and the FPs that do not match any reported catalytic residues but are predicted by PCA_NEST to be potentially significant, and reexamine the Con_Score for FPs only, surprisingly, we found an average Con_Score of 7.5! This result lends strong support to the biological significance of PCA_NEST-predicted top-ranking PFSs.
3.3 PCA_NEST: a web tool for analyzing ensembles of structures
PCA_NEST uses as input structural ensembles (proteins/peptides, RNA/DNA or their complexes), either experimentally characterized or computationally generated (see for example Fig. S5 in the Supplementary Material). The examined ensemble is first subject to an iterative best-fitting (see Fig. 2 and Table S1 in Supplementary Material) and then to PCA that renders a series of output data. The raw output data include two sets of results: CG and full atomic. CG nodes are centered at the Cα positions of the amino acids in proteins and at the phosphorus, sugar carbon C4* and base carbon C2 positions of the nucleotides in DNA/RNA structures (Yang et al., 2006). Each set of results contains the following information (Fig. S4): (i) general specifications of the examined set (e.g. the number of nodes or atoms, number of frames/models, average RMSD between models), (ii) predicted directions and relative sizes of the principal changes in conformation, given by the PC eigenvectors v(k) for 1≤k≤M (see Section 2), (ii) the PC eigenvalues ξk, in ascending order, starting from zero, which rescale the overall size of conformational change in each mode, (iv) newly reoriented models obtained after iterative best-fitting, (v) The average structural coordinates as well the particular model (among the members of the original ensemble) which is structurally closest to the computed mean structure, (vi) model coordinates in the space spanned by the PCs, ∑1/2UT (Section 2) and (vii) effective frequencies of PC modes (Equation S1).
Visualization modules that use animations, 2D-plots or 3D diagrams to comprehensibly present these data are available for assisting viewers as shown in Figure 3. Analyzers that utilize the aforementioned raw data for advanced analyses include four modules: (i) PFSs finder that lists the PFSs based on the two top-ranking PC modes and sorted after the minima-screening algorithms described in the Supplementary Material, (ii) cross-correlation maps (see Fig. 3b and Supplementary Material), (iii) decoy Generator and DynDom Analyzer (Fig. 3e) and (iv) computed order parameters that permit a fast evaluation of amide bond order parameters (S2) based on the best-fitted structural ensemble or selected conformers that suitably represent the conformational space sampled near native state (see Fig. S6 in the Supplementary Material).
4 DISCUSSION AND CONCLUSIONS
4.1 Native ensembles provide information on intrinsic dynamics
Overall our results suggest that the experimentally determined ensembles of conformers do exhibit features characteristic of the particular proteins' dynamics under native state conditions. Notably, the RMSD between NMR models and the difference Δ{Φ} between NMR and X-ray structures yield an average correlation of 0.70 (Table S1 in Supplementary Material). This observation is consistent with the recent finding that a handful of experimentally known conformers, or simply collections of structural homologs, satisfactorily reproduce NMR order parameters (Best et al., 2006). We further argue that the inferred motions are structure-induced properties ‘intrinsic’ to the examined proteins (Bahar et al., 2007; Gutteridge and Thornton, 2005; Lange et al., 2008), i.e. a dynamic signature of a given molecular topology, which can be described by physics-based analytical models (e.g. ANM). The dynamic significance of the native ensembles of structures was also suggested by our earlier study where the deviations from mean positions of residues within NMR ensembles were shown to be consistent with the equilibrium fluctuations predicted by the ANM (Yang et al., 2007). It should be noted that the NMR ensembles in the PDB are modeled by combining experimentally determined restraints (typically, inter-proton distances extracted from NOESY data and peptide torsional angles from measurements of three-bond J-couplings) with an empirical force field containing contributions from local and non-local interactions, including non-linear effects; and the deviations among the NMR models reflect the uncertainties in the atomic coordinates optimally assessed by this elaborate procedure. ANM modes, on the other hand, represent unique solutions, analytically derived based on a single representative structure; the predicted equilibrium dynamics is fully controlled by the 3N×3N Hessian matrix where uniform force constants are adopted for elastic springs that are assumed to connect spatially close residues. In view of these methods/approximations, the observed correlation of 0.61 between ANM and NMR–PCA modes (Table 1) essentially point to the dominant effect of the common component, inter-residue (ANM) or inter-atomic (NMR) contact topology inherently defining the robust modes of motions, in both cases.
4.2 X-ray structure is a conformational state along the dominant PCs derived from NMR models
Despite the structural (Andrec et al., 2007) and dynamic (Yang et al., 2007) differences in biomolecules independently determined by X-ray and NMR, these differences are shown here to be nonetheless explained by the M PC modes, with a correlation of 0.66 averaged over all examined protein pairs. A significant fraction of this correlation is usually contributed by a single mode (see Table 1, αPmax and αAmax values). Despite of the difficulty in predicting the conformational changes between NMR and X-ray structures, which originates from the nature of the structures as being characterized in distinct environments (temperature, buffer/ligand used and crystal forms, etc.), we have shown that the observed structural differences essentially reflect the changes in conformation along the most robust modes reproduced independently and consistently by PCA and ANM. Also, the positional covariance derived by PCA_NEST can serve as a guidance in iterative structure refinement (Tama et al., 2004) or ligand-induced conformation changes based on linear response theory (Ikeguchi et al., 2005).
4.3 The role of conformational dynamics in residue conservation
It has been known for more than half a century that amino acid side chains are critical to the functions of enzymes. Hence, it comes as a surprise that the PCA results based on CG-nodes (Cα atoms only) succeed in closely predicting the position of the enzyme active site. The high stability of the active site in the collective motions (low PC modes) suggests that enzymes are evolutionarily inclined to locate their functional residues at sites that enable a precise positioning necessary for the chemical reaction. These same sites coincide with, or closely neighbor, hinge sites corresponding to collective motions, which further suggest a possible coupling between local catalytic events to global (e.g. domain) motions.
Another interesting result was to observe the high level of conservation of the top-ranking PFSs (other than the known catalytic sites; see columns 7 and 10 (last) of Table 2) inferred from the PCA of native ensembles of structures. Overall, the PCA of native ensembles of proteins provides hypotheses about important sites to be further tested and established by experiments and/or more detailed computations.
4.4 When PCA_NEST does not work?
In general, if the ensemble of models does not provide an adequate sampling of the conformational space accessible to the examined protein, the results from PCA_NEST may be equally biased. Improper sampling is usually, but not necessarily, due to a small number of models. The Supplementary Material Section V presents and discusses the results from PCA using different ensembles of NMR models, applied to the prediction of order parameters from NMR relaxation experiments performed for ubiquitin. The ensembles containing smaller numbers of models lead to impaired predictions. However, a small number (as few as 12) of models may be sufficient to restore accuracy, provided that these models adequately sample the subspace spanned the first few PC modes.
4.5 Closing remarks
PCA_NEST provides a gateway for the PCA of collections of structures, determined experimentally or theoretically, for a given biomolecule, with supporting intuitive interfaces to best present various types of results. Our analyses herein exemplify how the web-based tool can be utilized to gain biologically and physically meaningful results. Notably, PCA_NEST offers standardized procedures to process ensembles such as iterative best-fitting, coarse-graining, PFS identification and other calculations that allow for comparing results on a common ground and drawing unbiased conclusions based on statistically meaningful data.
The robust modes shared by PCA and ANM indicate the directions of conformational changes which incur a minimal energy cost as the molecule travels in the neighborhood of its global energy minimum. The fact that such energetically favored reconfigurations correlate with the conformational mechanisms involved in biological function suggests that structures are designed to move so due to functional reasons. Particular structures survive in evolution by performing biologically correct movements, i.e. they set in motion certain domains/loops and arrest the movements in other parts (e.g. global hinges). Evidence is presented here that catalytic residues usually occupy positions that are highly constrained, almost ‘static’, in these robust modes that are conserved/selected. This is in support of the concept of structural predisposition of enzymes to enable the functional coupling between conformational mechanics and catalytic activity (Yang and Bahar, 2005). Finally, the residues identified to be immobile in these essential PC modes (both the global hinges and other sites) are noted to be evolutionarily conserved, closing the loop {structure → dynamics → function → structure}, i.e. structure induces dynamics, which enable function, which, in turn, selects/conserves the structure.
Supplementary Material
ACKNOWLEDGEMENTS
We thank Drs Guoying Qi and Steven Hayward for giving comments and providing crucial technical support on the PCA_NEST interlink with DynDom. We also thank Mr Christopher Jon Jursa for the help with the 2D plotter applets, Mr Shun Sakuraba for useful discussion on fundamentals on Kabsch's algorithm and Dr Choon-Peng Chng for providing MD trajectory files of flagellin. We thank Drs Scott Showalter and Robert Best for providing experimentally obtained (model-free based) order parameters of ubiquitin and HIV-1 protease, respectively. L.W.Y. also gives heartfelt thanks to Dr Kazuhiro Takemura for insightful discussions on order parameter calculations.
Funding: Japan Society for the Promotion of Science (fellowship and grant-in-aid to L.W.Y.); National Institutes of Health (grants 5R01GM086238-02 and 5R01LM007994-06 to I.B.).
Conflict of Interest: none declared.
REFERENCES
- Alexandrov V, et al. Normal modes for predicting protein motions: a comprehensive database assessment and associated web tool. Protein Sci. 2005;14:633–643. doi: 10.1110/ps.04882105. [DOI] [PMC free article] [PubMed] [Google Scholar]
- Amadei A, et al. Essential dynamics of proteins. Proteins. 1993;17:412–425. doi: 10.1002/prot.340170408. [DOI] [PubMed] [Google Scholar]
- Andrec M, et al. A large data set comparison of protein structures determined by crystallography and NMR: statistical test for structural differences and the effect of crystal packing. Proteins. 2007;69:449–465. doi: 10.1002/prot.21507. [DOI] [PubMed] [Google Scholar]
- Atilgan AR, et al. Anisotropy of fluctuation dynamics of proteins with an elastic network model. Biophys. J. 2001;80:505–515. doi: 10.1016/S0006-3495(01)76033-X. [DOI] [PMC free article] [PubMed] [Google Scholar]
- Bahar I, Rader AJ. Coarse-grained normal mode analysis in structural biology. Curr. Opin. Struct. Biol. 2005;15:1–7. doi: 10.1016/j.sbi.2005.08.007. [DOI] [PMC free article] [PubMed] [Google Scholar]
- Bahar I, et al. Intrinsic dynamics of enzymes in the unbound state, and relation to allosteric regulation. Curr. Opin. Struct. Biol. 2007;17:633–640. doi: 10.1016/j.sbi.2007.09.011. [DOI] [PMC free article] [PubMed] [Google Scholar]
- Barrett CP, et al. Dynamite: a simple way to gain insight into protein motions. Acta Crystallogr. 2004;D60:2280–2287. doi: 10.1107/S0907444904019171. [DOI] [PubMed] [Google Scholar]
- Bartlett G, et al. Analysis of catalytic residues in enzyme active sites. J. Mol. Biol. 2002;324:105–121. doi: 10.1016/s0022-2836(02)01036-7. [DOI] [PubMed] [Google Scholar]
- Best RB, et al. Relation between native ensembles and experimental structures of proteins. PNAS. 2006;103:10901–10906. doi: 10.1073/pnas.0511156103. [DOI] [PMC free article] [PubMed] [Google Scholar]
- Doytchinova IA, et al. Identifying human MHC supertypes using bioinformatic methods. J. Immunol. 2004;172:4314–4323. doi: 10.4049/jimmunol.172.7.4314. [DOI] [PubMed] [Google Scholar]
- Eyal E, et al. Anisotropic network model: systematic evaluation and a new interface. Bioinformatics. 2006;22:2619–2627. doi: 10.1093/bioinformatics/btl448. [DOI] [PubMed] [Google Scholar]
- Garcia AE. Large-amplitude nonlinear motions in proteins. Phys. Rev. Lett. 1992;68:2696–2699. doi: 10.1103/PhysRevLett.68.2696. [DOI] [PubMed] [Google Scholar]
- Gutteridge A, Thornton J. Conformational changes observed in enzyme crystal structures upon substrate binding. J. Mol. Biol. 2005;346:21–28. doi: 10.1016/j.jmb.2004.11.013. [DOI] [PubMed] [Google Scholar]
- Gutteridge A, et al. Using a neural network and spatial clustering to predict the location of active sites in enzymes. J. Mol. Biol. 2003;330:719–734. doi: 10.1016/s0022-2836(03)00515-1. [DOI] [PubMed] [Google Scholar]
- Hayward S, et al. Effect of solvent on collective motions in globular proteins. J. Mol. Biol. 1993;234:1207–1217. doi: 10.1006/jmbi.1993.1671. [DOI] [PubMed] [Google Scholar]
- Hayward S, Berendsen HJC. Systematic Analysis of Domain Motions in Proteins from Conformational Change: New Results on Citrate Synthase and T4 Lysozyme. Proteins. 1998;30:144–154. [PubMed] [Google Scholar]
- Howe PWA. Principal components analysis of protein structure ensembles calculated using NMR data. J. Biomol. NMR. 2001;20:61–70. doi: 10.1023/a:1011210009067. [DOI] [PubMed] [Google Scholar]
- Ikeguchi M, et al. Protein structural change upon ligand binding: linear response theory. Phys. Rev. Lett. 2005;94:078102–1-078102-4. doi: 10.1103/PhysRevLett.94.078102. [DOI] [PubMed] [Google Scholar]
- Jolliffe IT. Principal Component Analysis. 2. XXIX. New York: Springer; 2002. p. 487. [Google Scholar]
- Kabsch W. A solution for the best rotation to relate two sets of vectors. Acta Crystallogr. 1976;A32:922–923. [Google Scholar]
- Kenzaki H, Kikuchi M. Free-energy landscape of kinesin by a realistic lattice model. Proteins. 2008;71:389–395. doi: 10.1002/prot.21707. [DOI] [PubMed] [Google Scholar]
- Kidera A, Gō N. Normal mode refinement: crystallographic refinement of protein dynamic structure. I. Theory and test by simulated diffraction data. J. Mol. Biol. 1992;225:457–475. doi: 10.1016/0022-2836(92)90932-a. [DOI] [PubMed] [Google Scholar]
- Kitao A, et al. The effects of solvent on the conformation and the collective motions of protein: normal mode analysis and molecular dynamics simulation of melittin in water and in vacuum. Chem. Phys. 1991;158:447–472. [Google Scholar]
- Kitao A, et al. Energy landscape of a native protein: jumping-among-minima model. Proteins. 1998;33:496–517. doi: 10.1002/(sici)1097-0134(19981201)33:4<496::aid-prot4>3.0.co;2-1. [DOI] [PubMed] [Google Scholar]
- Landau M, et al. ConSurf 2005: the projection of evolutionary conservation scores of residues on protein structures. Nucleic Acids Res. 2005;33:W299–W302. doi: 10.1093/nar/gki370. [DOI] [PMC free article] [PubMed] [Google Scholar]
- Lange OF, et al. Recognition dynamics up to microseconds revealed from an rdc-derived ubiquitin ensemble in solution. Science. 2008;320:1471–1475. doi: 10.1126/science.1157092. [DOI] [PubMed] [Google Scholar]
- Lindorff-Larsen K, et al. Simultaneous determination of protein structure and dynamics. Nature. 2005;433:128–132. doi: 10.1038/nature03199. [DOI] [PubMed] [Google Scholar]
- Ma J. Usefulness and limitations of normal mode analysis in modeling dynamics of biomolecular complexes. Structure. 2005;13:373–380. doi: 10.1016/j.str.2005.02.002. [DOI] [PubMed] [Google Scholar]
- Nicolay S, Sanejouand YH. Functional modes of proteins are among the most robust. Phys. Rev. Lett. 2006;96:078104–1-078104-4. doi: 10.1103/PhysRevLett.96.078104. [DOI] [PubMed] [Google Scholar]
- Porter CT, et al. The Catalytic Site Atlas: a resource of catalytic sites and residues identified in enzymes using structural data. Nucleic Acids Res. 2004;32:D129–D133. doi: 10.1093/nar/gkh028. [DOI] [PMC free article] [PubMed] [Google Scholar]
- Qi G, et al. A comprehensive and non-redundant database of protein domain movements. Bioinformatics. 2005;21:2832–2838. doi: 10.1093/bioinformatics/bti420. [DOI] [PubMed] [Google Scholar]
- Tama F, Brooks CL. Symmetry, form, and shape: guiding principles for robustness in macromolecular machines. Annu. Rev. Biophys. Biomol. Struct. 2006;35:115–133. doi: 10.1146/annurev.biophys.35.040405.102010. [DOI] [PubMed] [Google Scholar]
- Tama F, et al. Flexible multi-scale fitting of atomic structures into low-resolution electron density maps with elastic network normal mode analysis. J. Mol. Biol. 2004;337:985–999. doi: 10.1016/j.jmb.2004.01.048. [DOI] [PubMed] [Google Scholar]
- Yang L-W, Bahar I. Coupling between catalytic site and collective dynamics: a requirement for mechanochemical activity of enzymes. Structure. 2005;13:893–904. doi: 10.1016/j.str.2005.03.015. [DOI] [PMC free article] [PubMed] [Google Scholar]
- Yang L-W, Chng CP. Coarse-grained models reveal functional dynamics - I. elastic network models – theories, comparisons and perspectives. Bioinfor. Biol. Insights. 2008;2:25–45. doi: 10.4137/bbi.s460. [DOI] [PMC free article] [PubMed] [Google Scholar]
- Yang L-W, et al. oGNM: a protein dynamics online calculation engine using the Gaussian Network Model. Nucleic Acids Res. 2006;34:W24–W31. doi: 10.1093/nar/gkl084. [DOI] [PMC free article] [PubMed] [Google Scholar]
- Yang L-W, et al. Insights into equilibrium dynamics of proteins from comparison of NMR and X-Ray data with computational predictions. Structure. 2007;21:741–749. doi: 10.1016/j.str.2007.04.014. [DOI] [PMC free article] [PubMed] [Google Scholar]
Associated Data
This section collects any data citations, data availability statements, or supplementary materials included in this article.