

Abstract
The segregation of initially intermingled left and right eye inputs to the dorsal lateral geniculate nucleus (DLGN) during development is thought to be in response to precise spatial and temporal patterns of spontaneous ganglion cell activity. To test this hypothesis, we disrupted the correlated activity of neighboring ganglion cells in the developing ferret retina through immunotoxin depletion of starburst amacrine cells. Despite the absence of this type of correlated activity, left and right eye inputs segregated normally in the DLGN. By contrast, when all spontaneous activity was blocked, the projections from the two eyes remained intermingled. Thus, certain features of normal neural activity patterns are not required for the formation of eye-specific projections to the DLGN.
In all species with highly developed binocular vision, the projections from the two eyes are segregated into separate layers within the DLGN (1). Early in development, however, retinogeniculate projections from the two eyes overlap (2, 3). For example, in the ferret, retinogeniculate inputs are intermingled extensively at birth and then gradually segregate into eye-specific layers by P10 (postnatal day 10) (4-6). During the period of eye-specific segregation, spontaneous “waves” of excitation periodically emerge and propagate across restricted domains of the retinal surface, inducing neighboring ganglion cells to fire synchronous bursts of action potentials (7-10). Because the bursts are correlated within each retina, spiking activity is highly synchronized within one eye and unsynchronized between eyes. This pattern of activity is thought to ensure that (i) neighboring ganglion cells “fire together” and thereby “wire together” onto the same DLGN neurons, and (ii) axons from ganglion cells in the two eyes that initially converge on the same DLGN cells are temporally uncorrelated in their firing, causing weakening and elimination of dual eye inputs to single DLGN neurons (11, 12).
Indeed, pharmacologic manipulations that eliminate all spontaneous retinal activity prevent the segregation of eye-specific inputs to the DLGN (6, 13), and altering the balance of retinal activity between the two eyes leads to an increase in the size of the terminal field arising from the more active eye, at the expense of the less active eye (13, 14). However, in every experiment where spontaneous retinal activity has been blocked, all retinal activity was abolished (6, 13, 14), and in the one experiment where retinal activity was elevated (14), correlated ganglion cell activity was maintained. Thus, although the relative level of activity in the two eyes is important for normal retinogeniculate development, it is not yet known whether normal spatiotemporal patterns of neural activity are necessary for eye-specific segregation.
During the period of eye-specific segregation, spontaneous retinal activity is driven by acetylcholine released from starburst amacrine cells (15, 16). To perturb this activity, we injected an immunotoxin that rapidly depletes these cells into the eye of P0 ferrets (Fig. 1) (17).
Fig. 1.
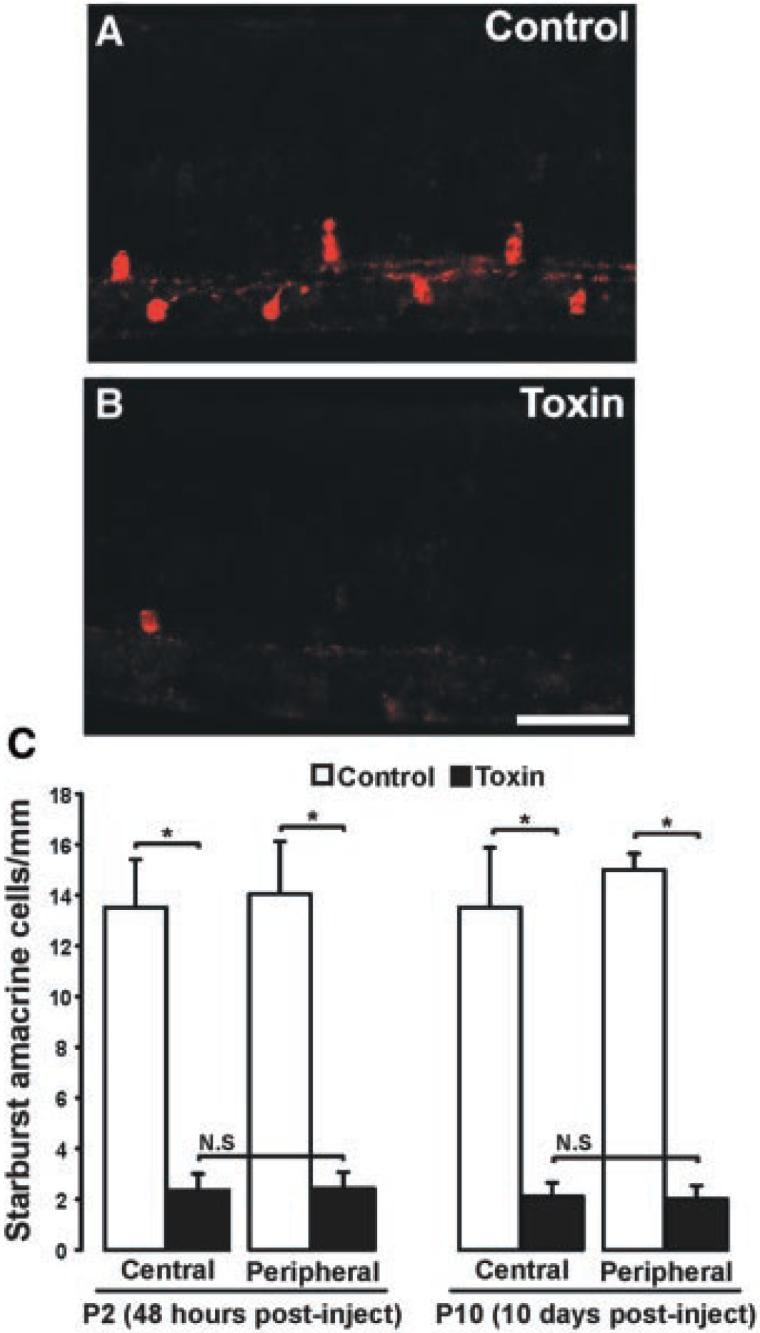
Ablation of starburst amacrine cells from the developing ferret retina. (A and B) Photomicrographs of P10 ferret retinas injected on P0 with saline (A) or toxin (B). Ganglion cell layer is to the bottom; photoreceptor layer is to the top. Scale bar, 100 μm. (C) Quantification of the number of starburst amacrine cells present at P2 (48 hours) and P10 (10 days) after an injection of saline (white bars) or immunotoxin (black bars) on P0. After both lengths of survival period, there is a significant reduction in the number of starburst cells in both the central and peripheral retina (*P < 0.01, unpaired t test, ±SEM; n = 12 control, n = 14 toxin-treated). N.S. = no significant differences between central and peripheral retinas within treatment group (48-hour survival, central versus peripheral: P = 0.95, t test, ±SEM; 10-day survival, central versus peripheral: P = 0.87, t test, ±SEM).
An efficient way to examine activity patterns across broad areas of the developing retina is to perform low-magnification optical recordings of intracellular calcium concentrations ([Ca2+]i) (15-17). In control (P3 to P7) ferret retinas, this revealed the presence of well-described propagating “waves.” Waves appeared largely normal in the youngest toxin-treated retinas (P3 to P5). However, their intensity diminished with age, and by P6, waves were barely visible by eye. To quantify calcium levels on a local scale, we measured the amplitude and frequency of calcium transients from a restricted area within each retinal quadrant. At all ages, calcium transients in normal retinas were robust and periodic (Fig. 2A) (n = 6/6) (17). In contrast, calcium transients were abnormal in the toxin-treated retinas; at the earliest ages examined (P3 to P5), calcium transients were absent in two of six cases and were significantly reduced in frequency and amplitude in the remaining four cases (Fig. 2, B and C). By P6, calcium transients were absent from most retinas examined (n = 5), except for one case in which reduced-frequency calcium transients were restricted to one retinal quadrant (Fig. 2, D and E). Because calcium imaging provides only an indirect measure of neural activity and cannot distinguish ganglion cells (which send axonal projections to the DLGN) from other retinal cells (which contribute to the calcium signal) (17), we next directly measured ganglion cell activity via patch-clamp recordings.
Fig. 2.
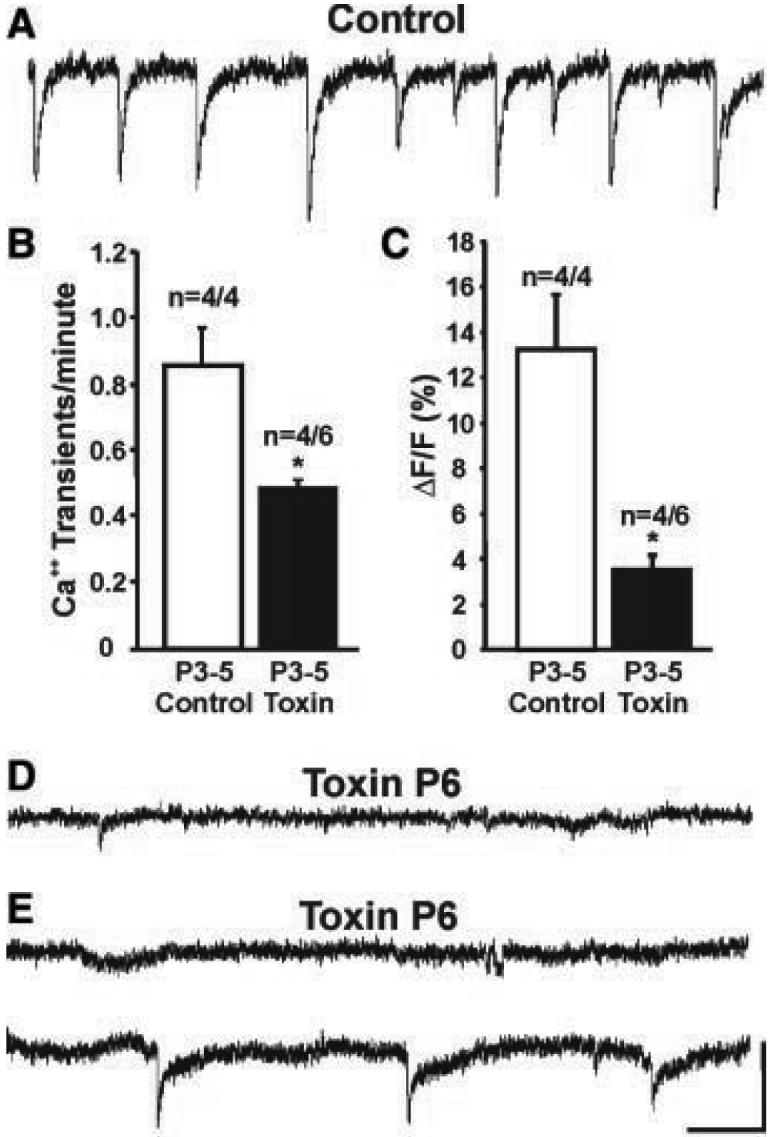
Starburst amacrine cell depletion perturbs spontaneous calcium transients in the developing retina. (A) Fluorescence intensity/time plots show changes in [Ca2+]i in a normal P3 retina; downward deflections indicate periodic increases in [Ca2+]i.(B and C) Frequency and amplitude of [Ca2+]i transients in control and toxin-treated P3-P5 retinas. Open bars, control retinas; black bars, toxin-treated retinas (*P < 0.05, t test; n = 4 control retinas, n = 4/6 toxin-treated retinas, ±SEM; 2/6 toxin-treated P3-P5 retinas showed no [Ca2+]i transients). (D) P6 toxin-treated retina. Spontaneous [Ca2+]i increases were absent from all quadrants in this retina. (E) A P6 toxin-treated retina. Spontaneous [Ca2+]i increases were absent from this retinal quadrant (top trace). However, reduced frequency and amplitude [Ca2+]i changes were present within a restricted region of a different quadrant (bottom trace). Horizontal scale in (A), (D), and (E) = 1 min, vertical scale = 5% change in fluorescence signal relative to baseline.
Patch-clamp recordings (17) indicated that 93% of recorded ganglion cells in control (P2 to P9) ferret retinas confined their spontaneous activity to periodic epochs (Fig. 3A) (17). Nearly two-thirds (32/46) of control cells exhibited periodic “bursts” (slow depolarizations crested by a train of action potentials) followed by an interval of inactivity (Fig. 3A, top two traces and inset). Of the remaining control cells, 11 periodically exhibited the slow depolarization component but did not spike (17); the remaining three cells showed bursts with occasional spiking activity between bursts (Fig. 3A, bottom two traces). A strikingly different pattern of activity was present in toxin-treated retinas (Fig. 3B). Of 44 toxin-treated cells, only 10 (23%) showed periodic activity (7 bursting, 3 depolarizing-only), and the frequency of these events was significantly reduced relative to controls (control mean = 1.04 bursts/min, SEM = 0.15; toxin mean = 0.39 bursts/min, SEM = 0.07; P < 0.01, unpaired t test) (Fig. 3B, top trace). A further 20 cells showed nonperiodic spiking activity (i.e., spikes not confined to bursts) (Fig. 3B, middle two traces). The remaining 14 cells were completely silent, exhibiting no slow depolarizations or spiking activity for the entire recording period (minimum recording period, 10 min) (Fig. 3B, bottom trace). Despite the marked perturbation in ganglion cell activity patterns caused by star-burst amacrine cell depletion, the mean firing rate of ganglion cells in the two treatment groups was not significantly different (control mean = 0.155 spikes/s, SEM = 0.05; toxin mean = 0.188 spikes/s, SEM = 0.06; P = 0.237, Mann-Whitney U test). Additionally, both groups exhibited similar distributions of firing rates (Fig. 3, C and D). Cells were filled with a fluorescent dye during the recording session to confirm the presence of an axon, a feature that distinguishes ganglion cells from displaced amacrine cells (Fig. 3E). Injections of depolarizing currents evoked discharge patterns characteristic of developing ganglion cells (Fig. 3F) (18, 19), which confirmed that all cells were capable of generating spikes.
Fig. 3.

Starburst amacrine cell depletion disrupts the normal pattern of spontaneous ganglion cell discharges. (A) Patch-clamp recordings (17) of spontaneous ganglion cell activity from normal (top three traces) and saline-injected (bottom trace) retinas. Inset: a typical “burst” showing slow depolarization crested by a train of action potentials [ages: P4, P4, P9, P7, top to bottom; resting potentials (Vm): -68 mV, -73 mV, -71 mV, -62 mV, top to bottom]. (B) Spontaneous firing patterns of retinal ganglion cells from toxin-treated ferrets. Top trace: This cell displayed bursts that are similar in duration to those seen in control retinas but significantly less frequent. Other toxin-treated ganglion cells (middle two traces) manifested nonperiodic spiking activity that was not confined to bursts. Bottom trace: This cell did not exhibit any spontaneous activity (ages = P3, P4, P7, P4, top to bottom; Vm: -67 mV, -70 mV, -62 mV, -72 mV, top to bottom). Scale bar: x = 1 min, y = 80 mV. (C and D) Histograms show the distribution of firing rates for (C) control and (D) toxin-treated ganglion cells. The mean firing rate of ganglion cells in the toxin-treated retinas was not significantly different from that observed in control retinas (control mean = 0.155 spikes/s, SEM = 0.05; toxin mean = 0.188 spikes/s, SEM = 0.06; P = 0.237, Mann-Whitney U test). (E) Ganglion cells were filled with a fluorescent dye (Alexafluor 568) during the whole-cell recordings. The morphology of normal (left panel) and toxin-treated (right panel) cells was similar. Arrowheads indicate the presence of an axon (arrows). Scale bar, 25 μm. (F) Current injections revealed the spike profile characteristic of developing ferret retinal ganglion cells. Responses to current injections of three different levels is shown (stimulus parameters are shown below). Note: Responses to current steps shown here are from the same toxin-treated P3 ganglion cell that exhibited no spontaneous activity [(B), bottom trace]. Scale bars: x = 250 ms; y (stimulus) = 0.5 nA; y (response) = 20 mV.
To assess the correlational structure of spontaneous ganglion cell activity after toxin treatment, we carried out dual patch-clamp recordings from neighboring ganglion cells in control and toxin-treated P2-P9 retinas (17) (soma-soma recording distance < 25 μm). In control retinas, neighboring ganglion cells exhibited highly correlated bursts as well as depolarizations and hyperpolarizations (Fig. 4, A and B) (n = 15 pairs). To quantify spike correlations in control and toxin-treated retinas, we carried out cross-correlation analysis of spiking activity for all pairs in which both cells exhibited spikes (17). Even in control retinas, not every pair showed spiking activity in both cells. In those cases, the depolarizations in nonspiking cells appeared correlated with the bursting activity of the neighboring cell. Therefore, we analyzed correlations in membrane potential for all cell pairs in which one cell did not spike. These two analyses showed that in control retinas, spontaneous spiking activity (Fig. 4C) (table S1) as well as membrane potential changes (Fig. 4D) (table S2) of neighboring ganglion cells were significantly correlated in every case. In marked contrast, the activity of ganglion cell pairs from toxin-treated retinas (n = 15) did not appear correlated, consisting of (i) spiking activity in both cells (Fig. 4F), (ii) spiking activity in one cell and infrequent spikes in the neighboring cell (Fig. 4G), or (iii) spiking activity in one cell and no spiking activity in the other cell. One toxin-treated pair showed no spiking or membrane fluctuations on either electrode for the duration of the recording. Cross-correlation analysis confirmed that, for all the toxin-treated pairs in which both cells spiked, their spiking activity was not significantly correlated; the resulting distribution was similar to a random-shuffle correlation of the same spike data (Fig. 4H) (table S1). For the toxin-treated pairs in which only one ganglion cell spiked, the membrane fluctuations of the nonspiking cell were not visibly correlated with the activity of the neighboring cell. Cross-correlation analysis of membrane potential in these pairs indicated that their activity was not significantly correlated (Fig. 4I) (table S2). As noted above, dye-filling was used to confirm that all recordings were from ganglion cells (Fig. 4, E and J), and responses to current steps (Fig. 3F) confirmed that all ganglion cells were capable of firing action potentials.
Fig. 4.

The normal pattern of neighboring ganglion cell activity is disrupted in toxin-treated retinas. (A and B) Examples of correlated activity from neighboring pairs of retinal ganglion cells in control retinas. Red trace, activity recorded from one ganglion cell; green trace, activity recorded from an adjacent ganglion cell (soma-soma recording distance <25 μm). (A) Patch-clamp recordings from a pair of neighboring ganglion cells, showing highly correlated bursts as well as hyperpolarizations (arrows indicate start of hyperpolarization for each cell); hyperpolarizations were seen in about half of the control cell pairs. These occurred at equal frequency in the toxin-treated retinas but were not correlated between neighboring cells (age shown = P4; Vm = -58 mV and -61 mV ). (B) Patch-clamp recordings from a different pair of neighboring ganglion cells in a control retina, again showing highly correlated bursting activity (age = P6; Vm = -66 mV and -68 mV). (C) Cross-correlation histograms of spiking activity for neighboring ganglion cells in two control retinas (left panel, P3 retina; right panel, P5 retina). Spiking activity is shown in blue; for comparison, a random-shuffle correlation of the same spike data is shown in red. Pearson correlation coefficient (r) values are shown on the y axis; time lag (in seconds) is shown on the x axis. Peaks are highly significant for these, as well as all other control ganglion cell pairs (table S1). Recording duration, 10 min. (D) Cross-correlation histograms of membrane potential for two neighboring ganglion cells in control retinas (ages = P3 and P4). Membrane correlation plot is shown in blue; for comparison, a random-shuffle correlation of the same data is shown in red. Pearson correlation coefficient (r) values are shown on the y axis; time lag (in seconds) is shown on the x axis. Highly significant peaks are evident near zero offset for these, as well as all the other control ganglion cell pairs in which only one cell spiked (table S2). (E) Control ganglion cells filled with Alexa dyes during a paired-patch-clamp recording session. Scale bar, 50 μm. (F and G) Patch-clamp recordings from pairs of neighboring ganglion cells in toxin-treated retinas. (F) High-frequency uncorrelated spiking activity was present in these two neighboring ganglion cells (age = P2; Vm = -60 mV and -59 mV). (G) Spontaneous activity in a pair of neighboring ganglion cells in a different toxin-treated retina. High-frequency activity was recorded in one cell, whereas very infrequent activity was recorded in an adjacent ganglion cell (age = P7; Vm = -67mV and -65 mV). Arrow indicates a single action potential. Horizontal scale in (A), (B), (F), and (G) = 1 min; vertical scale = 20 mV. (H) Cross-correlation histograms of spiking activity for two different toxin-treated pairs of neighboring ganglion cells (ages = P3 and P4). Spiking activity is shown in blue; a random-shuffle correlation of the same spike data is shown in red. Pearson correlation coefficient (r) values are shown on the y axis; time lag (in seconds) is shown on the x axis. The correlations for these as well as all other spiking pairs of ganglion cell pairs in toxin-treated retinas were not statistically significant (table S1); recording duration, 10 min. (I) Cross-correlation histograms of membrane potentials for two neighboring ganglion cells in a toxin-treated retinas (ages = P3 and P6). Membrane correlation plot is shown in blue; for comparison, a random-shuffle correlation of the same data is shown in red. Pearson correlation coefficient (r) values are shown on the y axis; time lag (in seconds) is shown on the x axis. In these as well as the other toxin-treated ganglion cell pairs in which only one cell spiked, correlations were not statistically significant (table S2). (J) Toxin-treated ganglion cells filled during a paired-patch-clamp recording session. Scale bar, 50 μm.
Visualization of retinogeniculate afferents (17) in control ferrets indicates that shortly after birth (P2), inputs from the two eyes overlap extensively in the DLGN (Fig. 5A), and that by P10, retinogeniculate projections are segregated into eye-specific layers (Fig. 5B) (6, 13). To determine whether the disruption of normal patterns of ganglion cell activity alters eye-specific segregation in the DLGN, we examined the pattern of retinogeniculate connections in P10 ferrets that received toxin injections on P0 (17). In every case, retinal projections in these animals were indistinguishable from those observed in control animals: There was a clear gap in the contralateral projection that was filled by the more circumscribed projection from the ipsilateral eye (compare Fig. 5, B and C). By contrast, complete blockade of retinal activity from P3 to P10 (17) prevented eye-specific segregation of retinogeniculate afferents (Fig. 6A). The degree of binocular overlap in the DLGN of activity-blocked P10 ferrets was the same as in normal P1-P2 ferrets (Fig. 6, B and C). In contrast, the degree of overlap for left and right eye projections observed in the toxin-treated P10 ferrets was normal (Fig. 6, B and C) (17).
Fig. 5.

Development of eye-specific layers in the DLGN of normal, control, and toxin-treated ferrets. Axons from the right eye are shown in green; axons from the left eye are shown in red. (A to C) Contralateral (top panels) and ipsilateral (middle panels) retinal inputs to the DLGN, and their merged representation (bottom panels), from (A) a normal P2 ferret, (B) a control P10 ferret, and (C) a P10 ferret that received binocular intravitreal injections of toxin on P0. Tissue sections are in the horizontal plane; rostral is to the top and medial is to the center of each panel. Arrows in (B) and (C) indicate eye-specific A, A1, and C layers in the DLGN of (B) control and (C) toxin-treated ferrets. Scale bars, 150 μm (A), 100 μm [(B) and (C)].
Fig. 6.

Blockade of all spontaneous retinal activity prevents eye-specific segregation in the DLGN. (A) Photomicrographs of retinogeniculate projections in a P10 ferret in which all spontaneous retinal activity was blocked from P3 to P10 by binocular application of epibatidine (17). Axons arising from the right eye projection are shown in green; axons from the left eye are shown in red. The contralateral eye projection (top panels) is found throughout the DLGN; the ipsilateral eye projection (middle panels) extends into the anterior portion of the nucleus. The overlay of the projections from the two eyes (bottom panels) reveals the complete absence of eye-specific segregation. Tissue sections are in the horizontal plane; rostral is to the top and medial is to the center of each panel. Scale bar, 100 μm. (B and C) Quantification (17) of the percentage of DLGN area in the four treatment groups occupied by (B) the ipsilateral eye projection and (C) overlapping axons from the two eyes. Open bars, normal P1-P2 ferrets (n = 8); hatched bars, control P10 ferrets (n = 12); black bars, P10 ferrets that received binocular injections of toxin on P0 (n = 14); cross-hatched bars, P10 ferrets that received binocular injections of epibatidine from P3 to P10 (n = 14). (***P < 0.0001, t test, +SEM).
Numerous experiments have shown that blocking spontaneous activity can prevent the formation of eye-specific retinogeniculate connections (6, 13, 14, 20-24), but none have tested the effect of altering the normal pattern of endogenous neural discharges without significantly changing activity levels. Our results show that if the normal patterns of spontaneous activity in individual and neighboring ganglion cells are disrupted, axons from the two eyes still segregate into nonoverlapping layers in the DLGN. When all spontaneous retinal activity was blocked, however, the projections from the two eyes remained intermingled. This indicates that the presence, but not the normal pattern, of spontaneous ganglion cell discharges is required for eye-specific retinogeniculate segregation.
In toxin-treated retinas, we observed calcium waves through P5. However, in every toxin-treated ganglion cell pair recorded from P2 to P9, normal spiking patterns were disrupted. A similar mismatch between propagating calcium activity and ganglion cell firing has been reported in ferret retinas treated with tetrodotoxin (in that study, waves persisted in the complete absence of ganglion cell action potentials) (25). Thus, the presence of calcium waves does not necessarily reflect the presence of normal ganglion cell activity (17).
Recently, it was proposed that molecular markers specify ocular dominance columns in the visual cortex (26, 27). Because our results indicate that the normal pattern of ganglion cell activity is not required for eye-specific segregation, it is possible that molecular cues direct sorting of binocular inputs into their stereotyped pattern of eye-specific layers in the DLGN. However, the requirement for retinal activity shown here and in previous studies (6, 13, 14, 20-24) indicates that if eye-specific cues are present, activity is required for ganglion cell axons to “read out” these cues.
Our results indicate that the normal pattern of ganglion cell activity is not necessary for the segregation process. Nonetheless, we cannot rule out the possibility that within-eye correlations not detected by our analysis might sustain normal segregation. Additionally, uncorrelated activity between the two eyes may be sufficient for segregation to occur, a condition likely met in the toxin-treated retinas. Further study is required to define the mechanisms that drive the formation of eye-specific domains in the mammalian visual system.
Supplementary Material
Footnotes
Supporting Online Material www.sciencemag.org/cgi/content/full/300/5621/994/DC1 Materials and Methods SOM Text Tables S1 and S2
References and Notes
- 1.Jones EG. The Thalamus. ed. 2 Plenum; New York: 1985. [Google Scholar]
- 2.Rakic P. Nature. 1979;261:5560. [Google Scholar]
- 3.Shatz CJ. J. Neurosci. 1983;3:3. doi: 10.1523/JNEUROSCI.03-03-00482.1983. [DOI] [PMC free article] [PubMed] [Google Scholar]
- 4.Linden DC, Guillery RW, Cucchiaro J. J. Comp. Neurol. 1981;203:2. doi: 10.1002/cne.902030204. [DOI] [PubMed] [Google Scholar]
- 5.Hahm JO, Cramer KS, Sur M. J. Comp. Neurol. 1999;412:4. doi: 10.1002/(sici)1096-9861(19991004)412:4<705::aid-cne11>3.0.co;2-d. [DOI] [PubMed] [Google Scholar]
- 6.Huberman AD, Stellwagen D, Chapman B. J. Neurosci. 2002;22:21. doi: 10.1523/JNEUROSCI.22-21-09419.2002. [DOI] [PMC free article] [PubMed] [Google Scholar]
- 7.Galli L, Maffei L. Science. 1988;242:4875. doi: 10.1126/science.3175637. [DOI] [PubMed] [Google Scholar]
- 8.Maffei L, Galli-Resta L. Proc. Natl. Acad. Sci. U.S.A. 1990;87:7. doi: 10.1073/pnas.87.7.2861. [DOI] [PMC free article] [PubMed] [Google Scholar]
- 9.Meister M, Wong RO, Baylor D, Shatz CJ. Science. 1991;252:5008. doi: 10.1126/science.2035024. [DOI] [PubMed] [Google Scholar]
- 10.Wong RO, Meister M, Shatz CJ. Neuron. 1993;11:5. doi: 10.1016/0896-6273(93)90122-8. [DOI] [PubMed] [Google Scholar]
- 11.Wong RO. Annu. Rev. Neurosci. 1999;22 doi: 10.1146/annurev.neuro.22.1.29. [DOI] [PubMed] [Google Scholar]
- 12.Feller MB. Neuron. 1999;22:4. doi: 10.1016/s0896-6273(00)80724-2. [DOI] [PubMed] [Google Scholar]
- 13.Penn AA, Riquelme PA, Feller MB, Shatz CJ. Science. 1998;279:5359. doi: 10.1126/science.279.5359.2108. [DOI] [PubMed] [Google Scholar]
- 14.Stellwagen D, Shatz CJ. Neuron. 2002;33:3. doi: 10.1016/s0896-6273(02)00577-9. [DOI] [PubMed] [Google Scholar]
- 15.Feller MB, Wellis DP, Stellwagen D, Werblin FS, Shatz CJ. Science. 1996;272:5265. doi: 10.1126/science.272.5265.1182. [DOI] [PubMed] [Google Scholar]
- 16.Zhou ZJ. J. Neurosci. 1998;18:11. doi: 10.1523/JNEUROSCI.18-11-04155.1998. [DOI] [PMC free article] [PubMed] [Google Scholar]
- 17.See supporting data on Science Online
- 18.Skaliora I, Scobey RP, Chalupa LM. J. Neurosci. 1993;13:1. doi: 10.1523/JNEUROSCI.13-01-00313.1993. [DOI] [PMC free article] [PubMed] [Google Scholar]
- 19.Wang G, Ratto GM, Bisti S, Chalupa LM. J. Neurophysiol. 1997;78:6. doi: 10.1152/jn.1997.78.6.2895. [DOI] [PubMed] [Google Scholar]
- 20.Sretavan DW, Shatz CJ, Stryker MP. Nature. 1988;336:6198. doi: 10.1038/336468a0. [DOI] [PubMed] [Google Scholar]
- 21.Shatz CJ, Stryker MP. Science. 1988;242:4875. doi: 10.1126/science.3175636. [DOI] [PubMed] [Google Scholar]
- 22.Cook PM, Prusky G, Ramoa AS. Vis. Neurosci. 1999;16:3. doi: 10.1017/s0952523899163107. [DOI] [PubMed] [Google Scholar]
- 23.Rossi FM, et al. Proc. Natl. Acad. Sci. U.S.A. 2001;98:11. doi: 10.1073/pnas.101120998. [DOI] [PMC free article] [PubMed] [Google Scholar]
- 24.Muir-Robinson G, Hwang BJ, Feller MB. J. Neurosci. 2002;22:13. doi: 10.1523/JNEUROSCI.22-13-05259.2002. [DOI] [PMC free article] [PubMed] [Google Scholar]
- 25.Stellwagen D, Shatz CJ, Feller MB. Neuron. 1999;24:3. doi: 10.1016/s0896-6273(00)81121-6. [DOI] [PubMed] [Google Scholar]
- 26.Crowley JC, Katz LC. Nature Neurosci. 1999;2:12. doi: 10.1038/16051. [DOI] [PubMed] [Google Scholar]
- 27.Crowley JC, Katz LC. Science. 2000;290:5495. doi: 10.1126/science.290.5495.1321. [DOI] [PubMed] [Google Scholar]
- 28.We thank D. van der List and A. Haines for data analysis and technical assistance, S. Sabo for advice on image quantification, B. Olshousen for consultation on the cross-correlation analysis/statistics, M. Feller and P. Pappone for use of their imaging equipment, and K. McAllister and M. Usrey for helpful comments on an earlier version of this manuscript. Supported by a Systems Neuroscience Training Fellowship (A.D.H.); National Eye Institute (NEI) grants EY13301 (G.-Y.W.), EY11369 (B.C.), and EY03991 (L.M.C.); and NEI core grant EY12576, NIH grant P20 MH6095 (funded by the National Institute of Mental Health and NSF), and a Research to Prevent Blindness Award (L.M.C.).
Associated Data
This section collects any data citations, data availability statements, or supplementary materials included in this article.