

Abstract
The establishment of appropriate neural circuitry depends upon the coordination of multiple developmental events across space and time. These events include proliferation, migration, differentiation, and survival - all of which can be mediated by hepatocyte growth factor (HGF) signaling through the Met receptor tyrosine kinase. We previously found a functional promoter variant of the MET gene to be associated with autism spectrum disorder, suggesting that forebrain circuits governing social and emotional function may be especially vulnerable to developmental disruptions in HGF/Met signaling. However, little is known about the spatiotemporal distribution of Met expression in the forebrain during the development of such circuits. To advance our understanding of the neurodevelopmental influences of Met activation, we employed complementary Western blotting, in situ hybridization and immunohistochemistry to comprehensively map Met transcript and protein expression throughout perinatal and postnatal development of the mouse forebrain. Our studies reveal complex and dynamic spatiotemporal patterns of expression during this period. Spatially, Met transcript is localized primarily to specific populations of projection neurons within the neocortex and in structures of the limbic system, including the amygdala, hippocampus and septum. Met protein appears to be principally located in axon tracts. Temporally, peak expression of transcript and protein occurs during the second postnatal week. This period is characterized by extensive neurite outgrowth and synaptogenesis, supporting a role for the receptor in these processes. Collectively, these data suggest that Met signaling may be necessary for the appropriate wiring of forebrain circuits with particular relevance to social and emotional dimensions of behavior.
Keywords: Met, HGF, forebrain, circuitry, autism, C57BL/6J
INTRODUCTION
The Met receptor tyrosine kinase is a pleiotropic, α,β-heterodimeric transmembrane protein that was first discovered as a proto-oncogene (Cooper et al., 1984), and soon after found to be involved in a number of normal physiological processes. The Met receptor and its endogenous ligand, hepatocyte growth factor (HGF), are expressed in the developing and adult nervous systems, and signal to mediate multiple neurodevelopmental and neurophysiological processes, including peripheral and central neuron survival (Hamanoue et al., 1996; Zhang et al., 2000), migration (Powell et al., 2001; Giacobini et al., 2007; Garzotto et al., 2008), axon guidance (Ebens et al., 1996; Caton et al., 2000; Powell et al., 2003), dendritic arborization (Gutierrez et al., 2004; Lim and Walikonis, 2008), and synapse maturation and activity (Akimoto et al., 2004; Tyndall and Walikonis, 2006; Tyndall et al., 2007). Deficits in any of these processes can yield pathological alterations in brain patterning and circuitry. It is of particular note, therefore, that the human orthologue, MET, is located on chromosome 7q31, a region implicated in autism spectrum disorder (ASD) (IMGSAC, 1998; Ashley-Koch et al., 1999; Barrett et al., 1999; Yonan et al., 2003), and a large family-based genetic analysis determined that an allelic variant in the 5′ promoter region of MET is associated with ASD, increasing risk approximately 2.25 fold (Campbell et al., 2006). Furthermore, postmortem tissue analyses revealed an approximately two-fold reduction in MET protein expression in the temporal neocortex of ASD subjects compared to unaffected controls (Campbell et al., 2007).
Roles for Met in the development of the diencephalon and telencephalon have been demonstrated in vitro. In the diencephalon, Met signaling is required for migration of gonadotropin hormone-releasing hormone-1 neurons from the nasal placode to the hypothalamus (Giacobini et al., 2007), and HGF has both growth-promoting and chemoattractive influences on axons from thalamic explants (Powell et al., 2003). In the telencephalon, Met disruption diminishes the elaboration of dendritic arbors in cortical organotypic cultures (Gutierrez et al., 2004), while HGF enhances dendritic outgrowth and excitatory synaptic development of dissociated hippocampal neurons (Tyndall and Walikonis, 2006; Nakano et al., 2007; Tyndall et al., 2007; Lim and Walikonis, 2008), and stimulates the motility of developing interneurons from basal forebrain explants (Powell et al., 2001).
These in vitro studies illustrate the developmental capacities of Met, but the extent to which they represent the neurodevelopmental roles of Met in vivo is unclear. To date, only two in vivo studies have attempted to examine the consequences of direct Met signaling manipulations in the context of mammalian forebrain development (Martins et al., 2007; Ohya et al., 2007). To place the human genetic studies in perspective and to advance our understanding of the putative neurodevelopmental influences of Met activation, we used complementary Western blotting, in situ hybridization and immunohistochemical approaches to comprehensively map Met transcript and protein expression throughout late embryonic and postnatal development of the mouse forebrain (E17.5– P35). We also examined protein expression patterns in mutant mice in which Met was conditionally deleted from structures originating from the dorsal pallium. We show here that Met is expressed by discrete subtypes of long-projecting neurons of the forebrain, particularly, though not exclusively, of dorsal pallial origin, and that Met protein is enriched in the developing axons of these cells. Moreover, we demonstrate that the peak of Met expression in these cell populations coincides with principal periods of axon outgrowth and synaptogenesis, supporting a functional role for Met signaling in the development of forebrain connectivity.
MATERIALS AND METHODS
Breeding and genotyping mice
C57BL/6J mice were purchased from the Jackson Laboratory (Bar Harbor, ME, USA). Conditional Met mutant mice (Emx1cre/Metfx/fx) were generated by mating mice homozygous for a Met allele, in which exon 16 is flanked by loxP sites (Huh et al., 2004) (Metfx/fx, courtesy of Dr. Snorri Thorgeirsson, NIH/Center for Cancer Research, Bethesda, MD) to Emx1-cre mice (Gorski et al., 2002) (courtesy of Dr. Kevin Jones, University of Colorado, Boulder, CO) that were also heterozygous for the floxed allele (Emx1cre/Metfx/+). Both Metfx/fx and Emx1cre/Metfx/+ breeding lines were back-crossed onto the C57BL/6J background for greater than 10 generations, and their progeny (i.e., Emx1cre/Metfx/fx and littermate control mice), were genotyped via polymerase chain reaction (PCR). The PCR primer sets were as follows: Emx1cre forward 5′-TTCGGCTATACGTAACAGGG-3′ and reverse 5′-TGCATGCAACGAGTGATGAG-3′; Metfx forward 5′-GCAACTGTCTTTTGATCCCTGC-3′ and reverse 5′-TGTCCAGCAAAGTCCCATGATAG-3′. For the Emx1cre reaction, DNA samples are submitted to an initial denaturation step of 5 minutes at 94°C, then 35 amplification cycles [(denaturation: 94°C for 45 seconds), (annealing: 55°C for 30 seconds), (elongation: 72°C for 1 minute)], and then a final elongation step of 5 minutes at 72°C. The expected PCR product size is 350 bp. For the Metfx reaction, DNA samples are submitted to an initial denaturation step of 5 minutes at 94°C, then 35 amplification cycles [(denaturation: 94°C for 45 seconds), (annealing: 60°C for 1 minute), (elongation: 72°C for 2 minutes)], and then a final elongation step of 5 minutes at 72°C. The expected PCR product size is 500 bp for the wild type Met allele and 580 bp for the Metfx allele.
A cross-sectional approach was employed to assess patterns of Met transcript and total Met protein expression in the developing mouse forebrain. For each experimental methodology described, forebrains from at least 3 mice from at least two independent litters were analyzed at each developmental time point of interest. In the case of immunohistochemical studies requiring comparisons of Emx1cre/Metfx/fx and littermates, at least 3 experimental pairs from independent litters were analyzed per time point.
All research procedures using mice were approved by the Institutional Animal Care and Use Committee at Vanderbilt University and conformed to NIH guide-lines. All efforts were made to minimize animal suffering and to reduce the number of animals used.
In situ hybridization
In situ hybridization was performed as previously described (Campbell and Levitt, 2003), with modification.
Two cDNA probe templates specific to the mouse Met gene were generated by RT-PCR: a 1,387 bp fragment corresponding to nucleotides 2665-4051 of NM_008591 and a 1,404 bp fragment corresponding to nucleotides 37-1440 of NM_008591. Antisense and sense cRNA probes were transcribed from these templates with incorporation of 35S-CTP.
Pregnant dams were deeply anesthetized with isofluorane, fetuses were harvested and the dissected brain rapidly removed, frozen in isopentane, and stored at -80° C until cryosectioning at 20 μm. Cryosections were thaw-mounted onto Superfrost Plus glass slides (Fisher) and stored at -80°C.
Slide-mounted sections were postfixed in buffered 4% paraformaldehyde for 15 minutes, washed in 0.1 M phosphate-buffered saline (PBS), pH 7.4, for 5 minutes, acetylated with 0.25% acetic anhydride in 0.1M triethanolamine-HCl/0.15 M NaCl with 0.16%HCl for 10 minutes, and washed in 2X standard saline citrate (SSC; 0.15 M NaCl, 0.015 M sodium citrate) for 1 minute. Tissue was then dehydrated in graded alcohols (50%, 70%, 95%, 100%; 1 minute incubation each), delipidated in chloroform (two 5 minute incubations), and incubated in 100% and 95% ethanol (1 minute each). Slides were dried at 37°C for at least 2 hours.
Each slide was hybridized with 3 ng radiolabeled probe in 100 μl hybridization buffer (50% formamide, 0.75 M NaCl, 20 mM 1,4-piperazine diethane sulfonic acid, 10 mM EDTA, 10% dextran sulfate, 5X Denhardt’s solution, 50 mM DTT, 0.2% sodium dodecyl sulfate, 100 μg/ml sonicated salmon sperm DNA, and 10 μg/ml yeast tRNA) per slide. Hybridization was performed at 55°C for 16 hours in a humid chamber.
Following hybridization, coverslips were removed in 4X SSC plus 390mM 2-mercaptoethanol and slides were incubated in this solution for 15 minutes at room temperature followed by 4X SSC without 2-mercaptoethanol for 15 minutes at room temperature. Sections were then treated with 1:1 formamide/buffer (0.6M NaCl, 40 mM Tris base, 2 mM EDTA, 0.06% HCl) at 60°C for 30 minutes and washed in room temperature 2X SSC for 5 minutes. Sections were then treated with 20ug/ml RNase A in 0.5 M NaCl, 10 mM Tris, pH 8.0, and 1 mM EDTA at 37°C for 30 minutes. The slides were then washed in graded salt solutions (2X, 1X, and 0.5X SSC each for 5 minutes at room temperature, and 0.1X SSC at 65°C for 30 minutes). Slides were cooled to room temperature in 0.1X SSC for 5 minutes and dipped in 60% ethanol with 0.33 M ammonium acetate. Slides were dried at 37°C for 3-6 hours and exposed to X-ray film (Biomax MR; Eastman Kodak, Rochester, NY) for 3-15 days. A subset of sections were prepared for emulsion dipping, following the protocol noted in (Campbell and Levitt, 2003) and exposed for 3-6 days prior to development.
Immunohistochemistry
The primary antibody used for Met immunohistochemical study was mouse anti-Met (Met, B-2; sc-8057; lot No. C2807; Santa Cruz Biotechnology, Santa Cruz, CA; immunogen: peptide corresponding to amino acids 1330-1379 of mouse Met (NCBI# NP 032617)). Using immunoblotting methods, the antibody recognizes the recombinant Met protein (Santa Cruz), and a minor band at 170 kD and a major band at 140 kD in brain tissue homogenates (see below). These bands represent pre-processed and processed forms, respectively, of the Met receptor. Only the pre-processed band was detected in homogenates prepared from mouse neocortex in which the Met gene was deleted from the dorsal pallium (data not shown). A mouse monoclonal antibody, 1G9, generated in the laboratory against adult mouse hippocampal homogenates, cross-reacts specifically with phosphorylated neurofilament-H (NF-H) (Pennypacker et al., 1991), and was used to stain developing axons.
Postnatal mice were deeply anesthetized with sodium pentobarbital (60 mg/kg i.p.) prior to transcardial perfusion with room temperature phosphate-buffered 4% paraformaldehyde (pH 7.3) containing 1.3% L-lysine and 0.24% sodium periodate. After postfixation overnight at 4°C, brains were cryoprotected via sequential 12-hour incubations in 10%, 20%, and 30% sucrose in PBS, pH 7.5. Fetal brains were harvested and immersion-fixed overnight at 4°C prior to cryoprotection.
Fetal and P0 fixed brains were frozen in embedding medium (Triangle Biomedical Sciences; Durham, NC) over liquid nitrogen vapors and stored at -80°C until sectioned with a cryostat at 20 μM. Sections were collected on gelatin-subbed slides and stored at -80°C until processed. Fixed brains from P7 through P35 were frozen, cut at 40 μM with a sliding microtome (Leica, Bannockburn, IL) and free-floating sections were stored in a cryopreservative solution at -20°C until processed. One series of sections from selected brains were stained with Cresyl Violet as previously described (Hockfield, 1993).
For Met immunohistochemical processing, both cryostat and free-floating sections were rinsed in PBS and then incubated for 5 minutes in 0.5% H202 in PBS to quench endogenous peroxidases. The sections were then rinsed in PBS before 25 min incubation in 0.1 M Tris-glycine (pH 7.4). Several more PBS rinses preceded a 1.5 hr incubation in unlabeled donkey anti-mouse IgG (Fab; Jackson Immunoresearch, West Grove, PA) to block endogenous mouse immunoglobulins. Sections were further blocked in several rinses of Blotto-T (4% Carnation dried milk in PBS containing 0.2% Triton-X-100). Blocked sections were incubated in primary mouse anti-Met antibody diluted 1:250 in Blotto-T. Cryosections were incubated for 2-4 hours at room temperature; free-floating sections were incubated for 48-72 hours at 4°C. Following washes in Blotto-T, sections were incubated for 1 hour at room temperature in 1:1000 biotin-SP-conjugated donkey anti-mouse IgG (Jackson Immunoresearch) diluted in Blotto-T. Sections then were rinsed several times in PBS and processed by the ABC Elite histochemical method (Vector, Burlingame, CA). Met-specific antibody complexes were visualized by incubating the sections for 2-4 minutes at room temperature in 0.5% 3′3′-diaminobenzidine (DAB) with 0.015% H202. The stained sections were rinsed in PBS, and free-floating sections were mounted on gelatin coated slides. Finally, sections were dehydrated with ethanol, cleared with xylene, and coverslipped in DPX (Fisher, Pittsburgh, PA) for microscopic analysis. Phosphorylated NF-H staining was performed using a similar immunohistochemical protocol for free-floating sections, but with the following specific parameters: 1) The 1G9 primary antibody was diluted 1:200 in Blotto-T, 2) biotin —SP-conjugated donkey anti-mouse IgM secondary antibodies were diluted 1:1,000 in Blotto-T, and 3) antigen/antibody complexes were visualized using standard ABC reagents (Vector), followed by DAB histochemistry.
Western blotting
The following primary antibodies were used for Western blotting studies: rabbit anti-Met (Met; # 07-283; lot No. 27208; Millipore (Upstate), Billerica, MA; immunogen: peptide corresponding to amino acids 1361-1379 of mouse Met (NCBI# NP 032617)), mouse anti-Met (Santa Cruz, sc-8057), mouse anti-alpha-tubulin loading control (alpha-tubulin, Ab-1; # CP06; lot No. D16509-5; Oncogene Research Products, San Diego, CA; immunogen: native chick brain microtubules), mouse anti-GAPDH loading control (GAPDH; #AM4300; lot No. 08608176A; Ambion, Austin, TX; immunogen: purified rabbit muscle GAPDH).
Mice were deeply anesthetized with sodium pentobarbital (60 mg/kg i.p.) prior to decapitation and brain removal. Harvested brains were immediately immersed in room temperature Hanks’ balanced salt solution (Sigma, Saint Louis, MO). With the aid of an MZ-6 stereozoom microscope (Leica), the cerebral cortex from each hemisphere was divided evenly midway along the antero-posterior axis to generate two tissue samples. The underlying striatum also was rapidly dissected before all samples were snap-frozen on liquid nitrogen and stored at -80°C.
P0 through >P90 cortical and striatal samples were prepared by homogenizing frozen tissue samples in a glass tissue homogenizer (Wheaton, Millville, NJ) with ice-cold homogenization buffer (50 mM Tris HCl, pH 8.0, 150 mM NaCl, 1% Nonidet P-40, 0.1% SDS, 0.5% deoxycholate, 0.5mM DTT , 2 mM EDTA, pH 8.0, 2 mM EGTA, 0.2mM PMSF) containing a protease inhibitor cocktail (Sigma), 50 mM activated Na3VO4, 100 nM microcystin, and 0.5 nM cypermethrin. E16 tissue was sonicated briefly in the same buffer. Tissue homogenates were cleared by a 16,000 × g centrifugation for 20 minutes at 4°C, and protein concentrations of the supernatants were determined using the Dc protein assay (Bio-Rad, Hercules, CA).
Protein samples (35 μg protein per lane) were fractionated by SDS-PAGE and transferred to supported nitrocellulose membranes. The membranes were then blocked for 1 hr at room temperature in Blotto (3% Carnation dried milk in PBS) before being incubated with primary antibodies. Polyclonal rabbit anti-Met antibodies and alpha-tubulin antibodies were diluted 1:2500 and 1:100,000, respectively, in Blotto containing 0.05% Tween-20. Monoclonal mouse anti-Met antibodies were diluted 1:500 in Blotto alone, and GAPDH antibodies were diluted 1:200,000 in Blotto + 0.02% Tween-20. The membranes were then rinsed repeatedly in PBS and incubated for 1.5 hr at room temperature with anti-rabbit and anti-mouse horseradish peroxidase-conjugated secondary antibodies (Jackson Immunoresearch). Following several more rinses in PBS, the membranes were reacted with enhanced chemiluminescence reagents (GE/Amersham ECL) and detected with autoradiography film (GE/Amersham hyperfilm). Autoradiographic films were imaged with a high resolution scanner and subjected to densitometric quantification using IMAGE-J.
Digital illustrations
Microscopy was performed with the aid of an Axioplan II microscope (Zeiss, Jena, Germany), and micrographs were acquired with a Zeiss AxioCam HRc camera (Zeiss) in Axiovision 4.1 software (Zeiss). No image alteration other than re-sizing was performed. Figures were prepared digitally in Microsoft Office Powerpoint 2003 (Microsoft Incorporated, Redmond, WA).
RESULTS
Temporal patterns of Met expression during forebrain development
Met signaling has been implicated in vitro in diverse neurodevelopmental processes in the forebrain, including cell migration (Powell et al., 2001; Giacobini et al., 2007; Garzotto et al., 2008), neurite outgrowth (Powell et al., 2003; Gutierrez et al., 2004; Lim and Walikonis, 2008), and synaptogenesis (Madhavan and Peng, 2006; Tyndall and Walikonis, 2006; Nakano et al., 2007), each of which occurs in vivo during well defined, though overlapping, temporal windows. As a first step in identifying the neurodevelopmental processes for which Met signaling may be most relevant in vivo, we utilized Western blotting to assess Met receptor protein expression levels in three forebrain regions across development. Anterior cortex, posterior cortex, and striatum exhibit strikingly similar temporal patterns of Met expression (Fig. 1). Total Met protein levels in these regions are relatively low from peak to late periods of neurogenesis (E16.5). There is a marked increase in expression levels during the perinatal period (P0), corresponding to a time when most cortical and striatal neurons have finished their migration and are actively extending both axonal and dendritic processes (Parnavelas and Uylings, 1980; Miller and Peters, 1981; Miller, 1986; Tepper and Trent, 1993; Tepper et al., 1998). Met protein expression increases dramatically between P0 and P7 (Fig. 1), peaking at a period coincident with extensive neurite outgrowth and the onset of synaptogenesis (Blue and Parnavelas, 1983; Micheva and Beaulieu, 1996; De Felipe et al., 1997). This is followed by a gradual decrease in Met expression during the peak period of synaptogenesis (Aghajanian and Bloom, 1967; Dyson and Jones, 1980; Blue and Parnavelas, 1983; Markus and Petit, 1987; Micheva and Beaulieu, 1996; De Felipe et al., 1997) (P14, P21). Met levels continue to decrease through the onset of puberty (P35) to reach a low baseline of expression in the adult (P90).
Fig. 1.
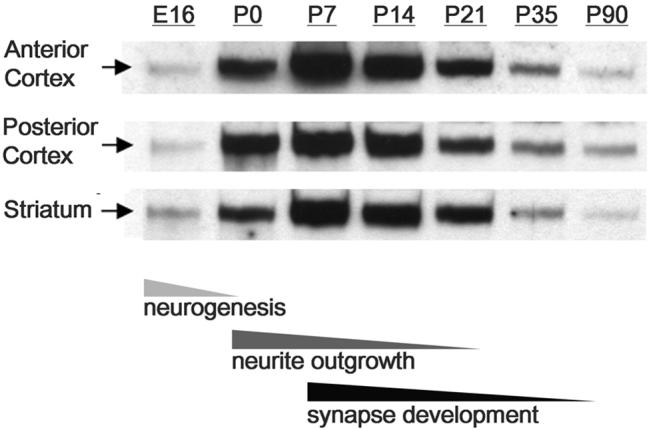
Western blotting analysis of Met protein expression during forebrain development in wild type mice. The temporal profile of Met expression is strikingly similar regardless of the forebrain region assayed: protein levels are relatively low embryonically (E16), but increase dramatically during perinatal development (P0) to reach a peak at P7. Levels remain high through the second postnatal week (P14), but decline dramatically thereafter (P21) to relatively low levels in the adolescent (P35) and adult (>P90). Note that peak periods of Met expression overlap with principal periods of neurite outgrowth and synaptogenesis in the mouse forebrain. Samples from each forebrain region were probed on separate blots and optimal film exposure times were independently determined.
The Western blotting data are consistent with a hypothesized role in vivo for Met signaling during multiple neurodevelopmental events, but especially neurite outgrowth and synaptogenesis. To gain complementary, spatially-resolved data regarding Met receptor expression, we undertook detailed in situ hybridization and immunohistochemistry studies. We also present immunohistochemical mapping data using tissue from Emx1cre/Metfx/fx mice, in which the targeted deletion preferentially ablates the processed, membrane-bound form of the Met receptor from all cells arising from the dorsal pallium, including the projection neurons of the cerebral cortex, hippocampus, and select amygdaloid nuclei, by E10.5 (Gorski et al., 2002). Unlike constitutive Met knockout mice, which exhibit early embryonic lethality (Bladt et al., 1995), Emx1cre/Metfx/fx mice are indistinguishable from wild type mice with regard to survival and reproductive capacity. Gross histological analyses also show Emx1cre/Metfx/fx mice to have normal cortical lamination, cortical thickness, and fiber tract development (Supplemental Fig. 1). Thus, this targeted deletion provides an opportunity to 1) establish Met antibody specificity and 2) define more accurately the cellular origin of Met expression in axons and neuropil elements. The results of the in situ hybridization and immunohistochemical mapping studies are organized by neuroanatomical region in two epochs: 1) during (E17.5-P16) and 2) after (P21-P35) the rise and peak of Met expression in the forebrain. By convention, and to distinguish between mRNA and protein products, we italicize when referring to the transcript (“Met”) and do not italicize when referring to the protein (“Met”).
Expression of Met in developing projection neurons of the cerebral cortex (E17.5-P16)
We readily observed Met transcript to be present in the somites as well as the primordial heart, kidney, and liver as early as E11.5. However, using the specific hybridization conditions noted above, we did not reliably observe Met in the forebrain until E15, when low levels in the cerebral cortex were first detected. Therefore, detailed Met expression analyses prior to E15 are most relevant to the periphery and extra-forebrain regions of the central nervous system, and thus, are beyond the focus of the present study. At all postnatal ages examined, there was little, if any, Met detected in developing or mature fiber tracts. In contrast, Met protein localization revealed dense staining of developing axons in forebrain tracts (see below).
At birth, Western blot analysis reveals a more than three-fold increase in the total level of Met protein in the posterior cortex compared to the anterior cortex (Fig. 2E). This finding is corroborated by both in situ hybridization and immunohistochemical staining (Fig. 2A,C). Thus, Met expression in the dorsal pallium exhibits a posterior (high) to anterior (low) gradient, which is most evident in the cortical plate. Met is also expressed in the subplate, but is relatively uniform throughout its posterior-anterior extent. Immunohistochemical staining reveals that Met expression in the cortex is localized to more posterior white matter tracts underlying the cortical plate (Fig. 2C). By P7, the posterior-anterior gradient of cortical Met expression abates (Fig. 2B,D,E).
Fig. 2.
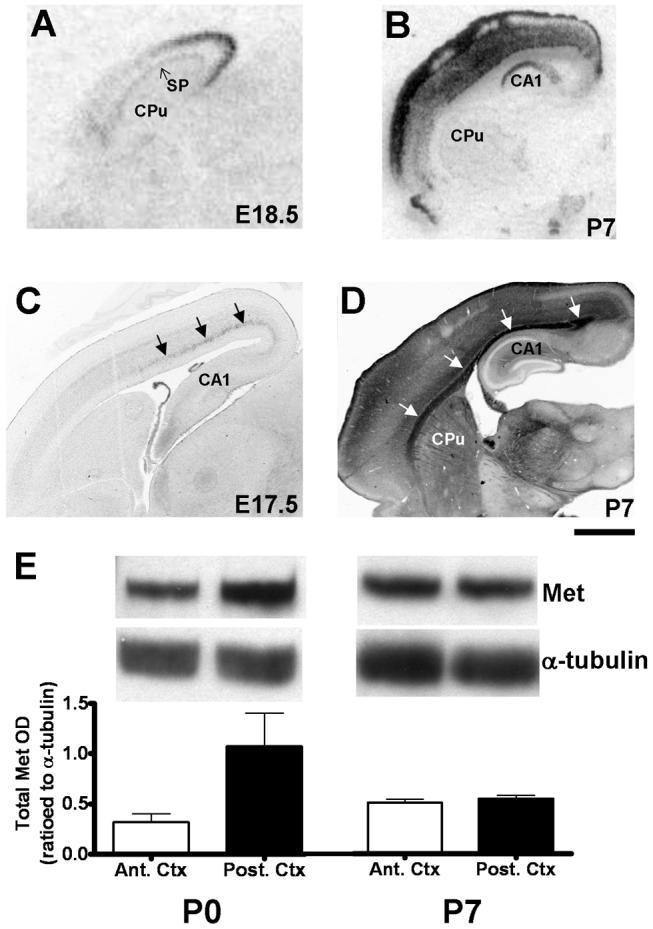
A transient tangential gradient of Met transcript and protein expression in the early postnatal neocortex. In situ hybridization analysis of Met in sagittal sections of wild type forebrain reveals a strong posterior (high) - anterior (low) gradient of signal in the neocortex, which is present at E18.5 (A), but normalizes by P7 (B). DIC photomicrographs of Met immunoreactivity in wild type sagittal sections show increased axonal labeling (arrows) in the posterior neocortex at E17.5 (C), but distributed axonal (arrows) and neuropil labeling throughout the anteroposterior extent by P7 (D). Semiquantitative Western blotting confirms the protein gradient revealed by immunohistochemistry; Met protein levels are found on average to be approximately three-fold greater in posterior versus anterior neocortex at P0 but not P7 (E). Error bars in E represent reflect standard error of the mean, N = 3 in each group. Scale bar = 925μm for A, 1.75mm for B, 550 μm for C and 1.1 mm for D.
The radial distribution of Met expression in the cortex can be observed more clearly in the coronal plane. At birth, there is an emerging bi-laminar pattern of labeling (Fig. 3A-C), which becomes more evident by P7 (Fig. 3D-F). At the transcript level, Met expression is most dense in layers II/III and in deeper layers V and VI, but essentially absent in layer IV (Fig. 3D,E). Met protein is also expressed in a bilaminar pattern, with maximal signal in the deepest portion of the cortex, where it appears to be localized to the coalescing fibers of subcortically and cortico-cortically projecting axons from throughout the cortex (Fig. 3F). The paucity of Met expression in layer IV is most evident in primary sensory cortices, particularly the somatosensory barrel fields; this is not surprising given the low levels of Met transcript in the dorsal thalamus (see below), and its absence in layer IV itself. Though the bilaminar pattern of Met transcript expression remains similar at P14 compared to P7, Met immunoreactivity at the later time point is substantially reduced (Fig. 3G-I).
Fig. 3.

Laminar patterning of Met transcript and protein expression in the neocortex. A, D, G: Autoradiographic images of Met transcript in coronal sections from wild type mice, scanned from film. B, E, H: DIC photomicrographs of coronal sections from wild type mice after processing for autoradiography and emulsion-dipping. C, F, I: DIC photomicrographs of Met immunoreactivity in coronal sections from wild type mice. At birth, low levels of Met transcript (A,B) and protein (C) are present throughout the extent of the neocortex, but a bi-laminar pattern of expression is emerging. By P7 (D,E,F), laminar patterning is apparent, with a distinct absence of Met signal in layer IV. This pattern of transcript expression is maintained at P14 (G,H), but immunohistochemical signal is reduced at this age (I). Scale bar = 1.55mm for A,D,G; 275μm for B,C,F,I; 550μm for E,H.
Cortically Projecting Fiber Tracts (P0 – P16)
Immunohistochemical analysis during the first two weeks postnatal reveals Met protein expression in several fiber tracts, including the corpus callosum, cingulum, anterior commissure, internal capsule, and external capsule, which arise from cerebral cortical neurons expressing Met transcript. The level of Met expression in these tracts is dynamic over this period, as described below.
Corpus Callosum
During the perinatal period, the corpus callosum exhibits intense Met staining, though expression is limited in its rostro-caudal extent (Fig. 4A,B). At the most anterior level, staining of callosal fibers is sparse, but increases in density posteriorly. At P7, the corpus callosum exhibits dense staining throughout its rostro-caudal extent (Fig. 4C,D). By P14, and even more evident at P16, Met immunoreactivity in this tract becomes less (Fig. 4E-H), and an additional pattern is observed; Met immunoreactivity is present in more dorsally situated axons at rostral levels (Fig. 4E,G), whereas stained fibers are localized ventrally at more caudal levels (Fig. 4F,H). These staining patterns may reflect unique patterns of maturation of distinct subpopulations of cortico-cortical projection neurons during this time period.
Fig. 4.
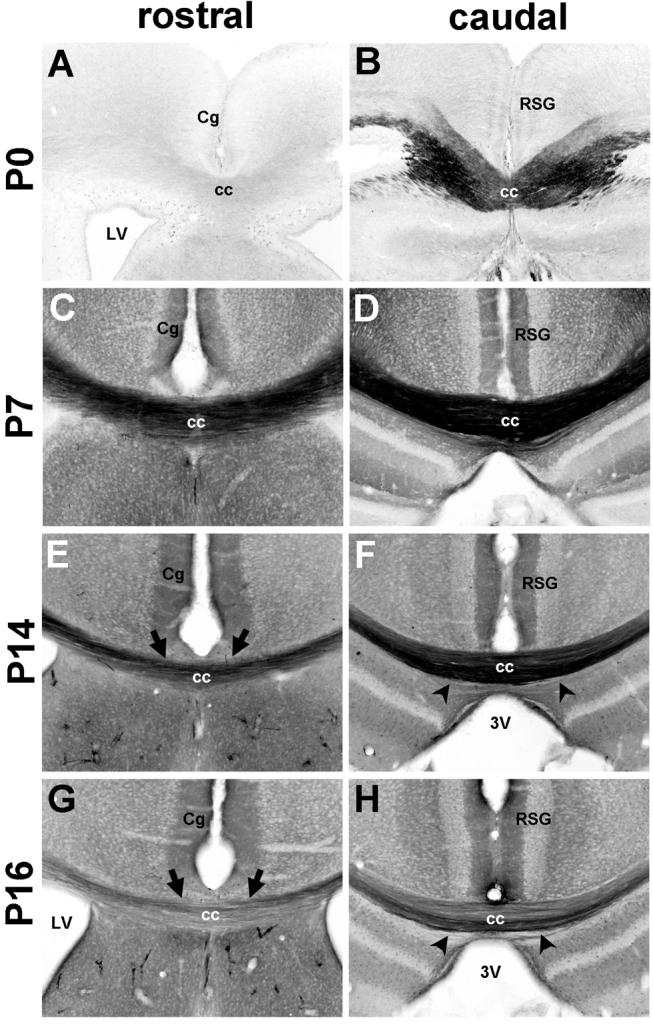
Met protein expression in the corpus callosum. DIC photomicrographs show Met immunoreactivity in coronal sections from wild type mice. At P0 (A, B), Met immunoreactivity is observed in the caudal portion of the corpus callosum, but not in the rostral region. By P7 (C, D), Met expression is intense throughout the rostro-caudal extent of the tract. Expression remains high, but gradually declines at P14 (E,F) and P16 (G,H). Note that at P14 and P16, Met immunoreactivity is enriched in dorsally situated axons at rostral levels (arrows) and ventrally situated axons at caudal levels (arrowheads). Scale bar = 275μm for all panels.
Cingulum
Met immunoreactivity is observed in the cingulum during postnatal development, particularly at P7 (Supplemental Fig. 2D). This tract contains corticothalamic and thalamocortical projections that originate and terminate, respectively, in the cingulate cortex, is a major pathway connecting the cingulate cortices and anterior thalamic nuclei to parahippocampal structures, and carries interhemispherically projecting axons of neurons in association cortices (White, 1959; Domesick, 1970; Mufson and Pandya, 1984; Shibata, 1993). Comparison of matched sections from wild type and Emx1cre/Metfx/fx conditional null mice reveals an absence of cingulum staining in the mutant mice (Supplemental Fig. 2E), indicating that cortical efferents, not afferents, express Met in this tract. This is consistent with Met transcript expression in neurons of the cingulate cortex (Supplemental Fig. 2A-C), and its absence in primary dorsal thalamic nuclei, throughout the same developmental period. As observed in the corpus callosum, there is reduced Met immunostaining in the cingulum at later ages (P16, Supplemental Fig. 2F).
Anterior Commissure
The anterior commissure and the neurons that give rise to its axons exhibit substantial Met protein and transcript expression, respectively (Fig. 5). Met immunohistochemical labeling is apparent in both the anterior and posterior limbs of the anterior commissure, though staining is much more intense in the posterior limb, as demonstrated in coronal sections (Fig. 5D-F). The heavily Met-expressing axons of the posterior limb can be seen in horizontal sections coursing out of the posterior temporal cortices (Supplemental Fig. 3A). Staining is much lighter in fibers of the anterior limb, which emanate from the olfactory bulbs and anterior temporal cortices (Supplemental Fig. 3B) (Gurdjian, 1925; Brodal, 1948; Jouandet and Hartenstein, 1983). Comparison of anterior commissure staining between wild type and Emx1cre/Metfx/fx mice confirms that the Met-expressing axons are mostly of dorsal pallial origin (Fig. 5D’-F’). We note, however, the presence of some residual Met-immunostained fibers in the P0 and P7 Emx1cre/Metfx/fx posterior limb (Fig. 5D’). These fibers likely originate in the ventral endopiriform cortex, a region in which Met is not deleted due to low rates of Emx1-driven Cre recombination (Gorski et al., 2002).
Fig. 5.

Met transcript and protein expression in the piriform cortex and anterior commissure. A-C: Autoradiographic images of piriform cortex at E18.5, P7, and P14 show Met transcript expression. DIC photomicrographs show Met immunoreactivity in coronal sections from wild type (D,E,F) and Emx1cre/Metfx/fx (D’, E’, F’) mice. In the wild type sections, Met is expressed in both the anterior and posterior limbs of the commissure, though the staining is more intense in the posterior limb. Met immunoreactivity is largely depleted in both limbs in the Emx1cre/Metfx/fx sections, owing to their dorsal pallial origin. We note residual staining in the P0 and P7 posterior limb (D’,E’), likely due to a contribution from fibers originating in the ventral endopiriform cortex in which Emx1-mediated Cre recombination rates are low. Scale bar = 825μm for A-C; 275μm for D-F and D’-F’.
Met staining in the anterior commissure is reduced dramatically by P16 (Fig. 5F), despite continued transcript expression in the piriform cortex (Fig 5C). Little, if any, protein is detected in the structure’s anterior limb, whereas low levels of expression persist in the posterior limb. Comparison between staining patterns in the wild type and Emx1cre/Metfx/fx tissue indicate that this residual expression in the posterior limb is authentic (Fig. 5F’).
Internal Capsule
From P0 through P7, Met protein expression is apparent in the fasciculated fibers of the internal capsule (Fig. 6A,C). The virtual absence of Met immunoreactivity in these fibers in Emx1cre/Metfx/fx mice at P0 and P7 (Fig. 6A’,C’), together with very low Met expression in primary sensory and motor nuclei in the dorsal thalamus, indicates that cortical efferents, rather than thalamocortical fibers, are labeled. Futhermore, in wild type animals, Met staining in the cerebral peduncle is minimal (Fig. 6B,D,G,H), suggesting that cortico-tectal, -bulbar and -spinal fibers contribute little to the Met staining. Therefore, corticothalamic and corticostriatal projections seem to comprise the greatest proportion of Met-immunoreactive axons in the internal capsule.
Fig. 6.

DIC photomicrographs illustrate Met immunohistochemistry in the internal capsule and cerebral peduncle in coronal sections from wild type and Emx1cre/Metfx/fx mice. Staining of internal capsule fibers is apparent in P0 and P7 wild type mice (A,C) but essentially absent in matched sections from Emx1cre/Metfx/fx mice (A’,C’). At P7, note the increase in Met immunoreactivity in the underlying striatal neuropil but the absence of such staining in the globus pallidus. By P14 (E) and P16 (F), the internal capsule fibers are nearly devoid of Met staining, but there is remaining immunoreactivity in the striatal neuropil. The paucity of Met labeling in the cerebral peduncle at all ages examined (P0, B; P7, D; P14, G; P16, H) suggests that cortico-tectal, -bulbar, and -spinal fibers contribute minimally to the Met immunoreactivity in the internal capsule. (Scale bar = 410μm for A,A’,B,C,C’,D; 550μm for E-H.
By P7, additional, moderately intense Met immunnostaining appears throughout the striatal and dorsal thalamic neuropil (Fig. 6C), coinciding with active periods of axon branching and collateralization of cortico-striatal and cortico-thalamic axons (Frassoni et al., 1995; Nisenbaum et al., 1998; Sheth et al., 1998). This neuropil staining remains (albeit at lower intensity) through P14 and P16 (Fig. 6E,F), although by this time the internal capsule fibers are devoid of Met staining. At all ages, Met expression is absent in the neuropil of the globus pallidus, consistent with the lack of Met transcript in the caudatoputamen, the primary contributor of afferents to this structure (Preston et al., 1980; Chang et al., 1981; Wilson and Phelan, 1982). Met-immunopositive fibers in the globus pallidus appear to be corticofugal fibers of passage.
External Capsule
The external capsule is a conduit for axons projecting between multiple cortical areas and the lateral, and other, subnuclei of the amygdaloid complex (Brothers and Finch, 1985; Faulkner and Brown, 1999; Weisskopf and LeDoux, 1999; Heinbockel and Pape, 2000; Szinyei et al., 2000). This tract contains fibers that are densely stained for Met during the first two postnatal weeks (Supplemental Fig. 4). As expected, there is a near-complete absence of Met expression in the external capsule in Emx1cre/Metfx/fx mice (Supplemental Fig. 4A’). By P16, consistent with a decrease in Met expression in both the cortex and amygdala, only low levels of Met staining are observed in the external capsule (Supplemental Fig. 4B).
Expression of Met in developing projection neurons of the hippocampus (E18.5-P16)
In the hippocampus, Met transcript is expressed by pyramidal cells of the subiculum, CA1 and a subdomain of CA3 from birth through P14 (Fig. 7A-C). As in the cerebral cortex, Met protein expression in hippocampal neurons is localized to long projection neurons. At P0 and P7, immunohistochemical staining of Met reveals intense labeling of axons in the alveus and fimbria/fornix (Fig. 7D,E), which are comprised in part of the extrinsically projecting axons of the hippocampus. Specifically, Met immunostaining is dense in the precommissural and postcommissural divisions of the fornix (Fig. 7J,K), which project to the septum and hypothalamus, respectively. The dorsal and ventral aspects of the hippocampal commissural division of the fornix also express Met protein (Fig. 7I,J). All fornix divisions in the Emx1cre/Metfx/fx mouse are devoid of Met protein (Fig. 7M,N,O), demonstrating that Met-expressing axons in this fiber tract originate from dorsally derived hippocampal pyramidal neurons, rather than from the various subcortical targets to which they are reciprocally connected.
Fig. 7.

Met transcript and protein expression in the hippocampus. A-C: Autoradiographic images of Met transcript in coronal sections from wild type mice, scanned from film. At all ages, autoradiographic signal is observed in the stratum pyramidale of the subiculum, CA1, and a subregion of CA3. Signal is absent in the dentate gyrus (DG). D-O: DIC photomicrographs of Met immunoreactivity in coronal sections from wild type (D-K) and Emx1cre/Metfx/fx (L-O) mice. D and E: DIC images of Met immunoreactivity from wild type mice show robust staining of the alveus and fimbria/fornix at P0 (D) and P7 (E), indicating that efferent axons of hippocampal pyramidal cells express Met. This staining decreases at later ages (P14, F; P16, G). Light staining in the strata oriens and radiatum and heavier staining in the stratum moleculare is observed in wild type (H), but not Emx1cre/Metfx/fx (L), mice at P7. Heavy Met staining is present in the dorsal hippocampal commissure (I), ventral hippocampal commissure (J), precommissural fornix (J), and postcommissural fornix (K). This staining is completely absent in corresponding axon tracts in the Emx1cre/Metfx/fx mouse (M, N, and O). Scale bar = 1mm for A-C; 275 μm for D-O.
Throughout development, Met transcript is conspicuously absent in the dentate granule neurons of the hippocampus (Fig. 7A-C). Consistent with this, axons projecting from these cells to CA3 via the mossy fiber pathway are not Met-immunoreactive. In contrast, Met immunolabeling is observed in the stratum moleculare of wild type (Fig. 7H), but not Emx1cre/Metfx/fx, mice (Fig. 7L), mostly likely representing perforant path fibers originating from layer II entorhinal cortex (Steward and Scoville, 1976; Dolorfo and Amaral, 1998; van Groen et al., 2002). The lighter immunostaining observed in the strata radiatum and oriens of CA1 and CA3 also is absent in Emx1cre/Metfx/fx mice (Fig. 7H,L), consistent with Met-expression in the terminal fields of a subpopulation of bilaterally projecting CA3 neurons (Gottlieb and Cowan, 1973; Swanson et al., 1978). We note, however, that this terminal axon Met staining cannot be differentiated from staining in the apical and distal dendrites of CA3, CA1, and subicular pyramidal neurons. Similar to the cerebral cortex, Met immunolabeling in the hippocampus and associated axon tracts is greatly reduced at P14 and P16 (Fig. 7F,G).
Expression of Met in developing projection neurons of the septum (E18.5-P16)
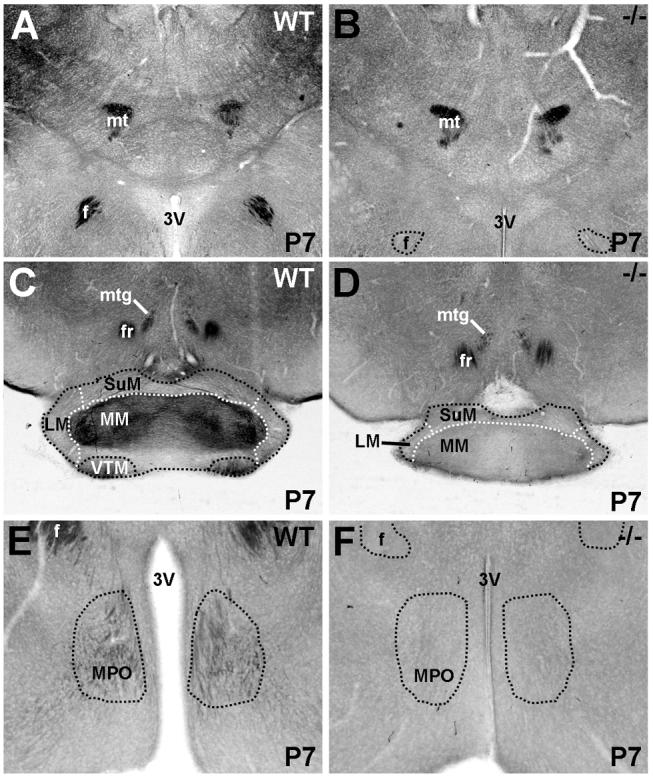
Met transcript expression in the septum is robustly detected perinatally (Fig. 8A), with dense labeling restricted to dorsolateral neurons and lighter labeling in the medial nucleus. This pattern persists throughout the first two postnatal weeks (Fig. 8B,C). Met immunolabeling in the dorsolateral septum is considerable, and the pattern of staining is equivalent in wild type and Emx1cre/Metfx/fx mice. This suggests localization to cell bodies or terminating afferent axons of a subpallial origin (Fig. 8H,L), but distinguishing between cell body and neuropil localization is difficult at the light microscopic level. In contrast, axonal Met immunoreactivity clearly predominates in the intermediate lateral and medial septal nuclei (Fig. 8I). This staining is greatly reduced in the Emx1cre/Metfx/fx mouse (Fig. 8M), consistent with a loss of Met-expressing septal afferents of a dorsal pallial origin. Axons of dorsally derived hippocampal pyramidal neurons innervate both dorsal and intermediate lateral nuclei, and, to a lesser extent, the medial septal nucleus (Swanson and Cowan, 1979; Staiger and Nurnberger, 1991; Phelan et al., 1996), and a substantial proportion of these axons express Met (Fig. 7). Therefore, Met-expressing hippocampal neurons may selectively target specific septal nuclei.
Fig. 8.

Met transcript and protein expression in the septum in coronal sections from wild type and Emx1cre/Metfx/fx mice. A-C: In situ hybridization analysis of Met in wild type septum across perinatal (E18.5, A) and early postnatal development (P7, B; P14, C). At all ages, autoradiographic signal is observed specifically in dorsolateral and medial subnuclei. D-G: DIC photomicrographs of Met immunoreactivity from wild type mice show labeling throughout the septum (outlined regions) at P0 (D) and P7 (E), which is decreased by P14 (F) and hardly detectable above background levels at P16 (G). At P7, all Met staining of the dorsolateral septum (H) and partial staining of the nucleus of the diagonal band (I) of wild type mice is preserved in Emx1cre/Metfx/fx mice (L and M). Stained afferents in the medial and intermediate septal nuclei (I) and the anteromedial hypothalamus (K) of wild type mice are absent in Emx1cre/Metfx/fx mice (M and O) at P7, indicating a dorsal pallial rather than septal origin for these fibers. Septo-habenular axons do not express Met as evidenced by a lack of staining in the stria medullaris in both wild type (J) and Emx1cre/Metfx/fx (N) mice at P7. Scale bar = 1.35mm for A-C; 550 μm for D-O.
Select septal efferents also express Met. For example, dorsolateral septum contributes a robust intra-septal projection to the nucleus of the horizontal diagonal band (Swanson and Cowan, 1979; Staiger and Nurnberger, 1991; Phelan et al., 1996), in which some terminal fibers appear to be Met-immunopositive in wild type mice. A lack of Met transcript labeling in the nucleus of the horizontal diagonal band, (see Fig. 8A,B,C) and a maintenance of Met-immunostained axons in the nucleus of the diagonal band in the Emx1cre/Metfx/fx mouse (Fig. 8M) are consistent with this observation. Neurons in the lateral and medial septal nuclei contribute descending projections to the medial preoptic area of the hypothalamus and ascending projections to the hippocampus, respectively (Swanson and Cowan, 1979; Chiba and Murata, 1985; Risold and Swanson, 1997), but Met-expressing axons in these regions are undetectable in Emx1cre/Metfx/fx mice (Figs. 8O and 7L). This suggests that the fibers originate from projection neurons of the Emx1-expressing lineage, and not septal neurons. Additionally, though septal neurons are known to contribute efferents to the habenula via the stria medullaris, these cells predominantly reside in the septofimbrial and triangular nuclei (Herkenham and Nauta, 1977; Swanson and Cowan, 1979; Kawaja et al., 1990), where Met transcript is not detected (data not shown). Axons in the stria medullaris are also devoid of Met protein expression in both wild type and Emx1cre/Metfx/fx mice (Fig. 8J,N).
Though some Met immunohistochemical signal is evident on afferent axons within the medial and intermediate lateral nuclei of the septum at P14 and P16 (Fig. 8F,G), in contrast to earlier ages (Fig. 8D,E), staining is difficult to distinguish from background. There is also a concomitant reduction of Met staining on axons likely to be dorsolateral septal efferents to the nucleus of the diagonal band (data not shown). This downregulation of axonal Met expression mirrors that observed in both cerebral cortical and hippocampal projection neurons after the second postnatal week.
Expression of Met in developing projection neurons of the amygdala (E18.5-P16)
Of the 13 commonly recognized nuclei within the amygdaloid complex (Aggleton, 2000), 5 express Met during postnatal development. From caudal to rostral, these are the posterior cortical amygdala, basal amygdala, lateral amygdala, medial amygdala, and the nucleus of the lateral olfactory tract. Met transcript is detected within these nuclei perinatally (Fig. 9A,B,C), at P7 (Fig. 9D,E,F), and at P14 (Fig. 9G,H,I). During this same period, Met protein expression is particularly dense in amygdalofugal axons of the stria terminalis.
Fig. 9.

In situ hybridization analysis of Met in the rostro-caudal extent of the amygdala during development. Autoradiographic images of E18.5 coronal sections show signal in the posterior cortical amygdala (A), the lateral, basal, and medial amygdala (B), and the nucleus of the lateral olfactory tract at the most rostral extent of the structure (C). Signal is observed in these same amygdaloid nuclei at both P7 (D, E, and F) and P14 (G, H, and I). Scale bar = 925μm for all panels.
At P7, there is intense Met immunostaining in the posterior cortical amygdaloid nucleus, from which Met-immunostained axons appear to project anteriorly via the stria terminalis (Canteras et al., 1992) (Fig. 10A,B). More rostrally, Met-expressing axons from the basal amygdaloid nucleus appear to join the stria terminalis (Fig. 10C) as it courses into the ventral forebrain to target the bed nucleus of the stria terminalis (Fig. 10E,F). Met-expressing axons in more medial aspects of the stria terminalis emanate from the medial amygdala (Fig. 10C), which contributes dense projections to the bed nucleus of the stria terminalis (Canteras et al., 1995). Intensely labeled axons are also present within the decussation of the stria terminalis, coursing beneath the precommissural fornix, directly superior to the anterior commissure (Fig. 10F). Therefore, in addition to ipsilateral projections, Met appears to be expressed on contralateral amygdalofugal projections to the bed nucleus of the stria terminalis, which most likely arise from the posterior cortical nucleus (Dong et al., 2001). The lateral amygdala, which contains Met-expressing neurons, projects to prefrontal cortex, other amygdaloid nuclei, and the nucleus accumbens (McDonald, 1991b; a; Aggleton, 2000). Of these, only the prefrontal cortex and posterior cortical amygdaloid nucleus exhibit robust Met immunostaining, which is lost in Emx1cre/Metfx/fx mice (Fig. 10A,A’, data not shown). However, because both of these regions receive numerous afferents of dorsal pallial origin, it is not possible to trace the origin of Met-expressing axons within these two regions to the lateral amygdala. Though likely, it is not absolutely certain that Met is expressed on efferents of the lateral amygdala.
Fig. 10.

DIC photomicrographs illustrate Met immunohistochemistry in coronal sections through the caudo-rostral extent of the amygdala and stria terminalis (st) in wild type (A, B, C, D, E, F) and Emx1cre/Metfx/fx (A’, B’, C’, D’, E’, F’) mice at P7. Met-expressing neurons in the posterior cortical amygdala (A) project labeled axons anteriorly in the st (B). More anteriorly, Met-expressing axons from the basal and medial amygdala (MeA) join the vertical limb of the st, course over the internal capsule (C, upper panel D, and E), and terminate in the ipsilateral bed nucleus of the stria terminalis (BST) and the contralateral BST via decussation at the midline (dashed line) (F). In Emx1cre/Metfx/fx mice, Met staining persists in a subset of st axons that originate from the MeA (arrows in C’, D’, E’, and F’). Met staining is also present in the nucleus of the lateral olfactory tract in the rostral extent of the amygdala in both wild type and Emx1cre/Metfx/fx mice (lower panel D and D’). Scale bar = 550 μm for all panels.
Based on recombination patterns in the Emx1-cre reporter mouse (Gorski et al., 2002), we expected only those Met-positive axons originating from medial amygdaloid neurons to remain immunoreactive in the stria terminalis of the Emx1cre/Metfx/fx mouse. Indeed, this appears to be the case (Fig. 10A’-F’). Interestingly, immunohistochemical analysis in the null mouse indicates that only a subpopulation of medial amygdaloid efferents express Met; although the medial amygdala projects to both the bed nucleus of the stria terminalis and the medial preoptic area of the hypothalamus (Canteras et al., 1995), only Met-stained axons in the latter are ablated in the Emx1cre/Metfx/fx mouse, indicating that these axons arise from neurons derived from the dorsal pallium rather than the medial amygdala (Fig. 8O).
At the most anterior extent of the amygdala, dense Met immunostaining is evident in the nucleus of the lateral olfactory tract in both wild type (Fig. 10D) and Emx1cre/Metfx/fx mice (Fig. 10D’). Thus, axonal staining in this nucleus likely arises from a non-Emx1-cre expressing subcortical or intra-amygdaloid region. Considering the data from anterograde labeling studies (Santiago and Shammah-Lagnado, 2004), and reported minor potential for Emx1-cre-mediated recombination within the nucleus of the lateral olfactory tract (Gorski et al., 2002), the staining pattern is consistent with the nucleus of the lateral olfactory tract receiving Met-immunoreactive input primarily from its contralateral counterpart.
Consistent with other forebrain areas, there is a significant decrease in Met expression in the amygdaloid complex after P7. Specifically, Met immunostaining is reduced between P14-16 in the stria terminalis (Supplemental Fig. 5E,F) and various targets of amygdaloid projections, including the bed nucleus of the stria terminalis (Supplemental Fig. 5G,H), the nucleus of the lateral olfactory tract (Supplemental Fig. 5C,D), and the posterior cortical amydaloid nucleus (Supplemental Fig. 5A,B).
Expression of Met in developing projection neurons of the diencephalon (P0-P16)
Met mRNA expression is evident in the thalamic reticular nucleus, but no other dorsal thalamic nuclei, at P7 (Fig. 11A) and P14 (Fig. 11B). However, Met protein is expressed in the neuropil in several thalamic nuclei, including the reticular, dorsolateral, ventrolateral, and anterior thalamic nuclei. In most regions, this immunostaining is virtually absent in the Emx1cre/Metfx/fx mouse (Fig. 11D), indicating corticofugal projections as the primary source of Met labeling. In contrast, Met immunostaining is equivalent in the anterior thalamic nucleus in wild type and Emx1cre/Metfx/fx mice (Fig. 11E,F), particularly in its anteroventral division, and appears to be localized to axons. Continued expression of Met in these processes in the Emx1cre/Metfx/fx mouse is somewhat unexpected, considering that Met is dramatically downregulated in Emx1cre/Metfx/fx cingulate cortical neurons, which send projections to the anterior nucleus of the thalamus (Supplemental Fig. 2D,E). However, the mammillary nuclei of the posteromedial hypothalamus also contribute a major population of afferents to this structure via the mamillothalamic tract, which, along with the mammillotegmental tract, heavily express Met protein (Fig. 12A,B). Moreover, Met immunoreactivity is present in the anteroventral, but not the anterodorsal subnuclei of the anterior thalamus (Fig. 11E,F), consistent with the selective patterns of innervation within this nucleus by the medial mammillary nuclei (Guillery, 1957; Cruce, 1975; Watanabe and Kawana, 1980; Seki and Zyo, 1984). The medial mammillary nuclei themselves receive prominent input from subicular projection neurons at the septal pole of the hippocampus (Swanson and Cowan, 1977; Allen and Hopkins, 1989; Gonzalo-Ruiz et al., 1992). These fibers course via the postcommissural division of the fornix to terminate specifically within the medial mammillary nuclei, and are Met-immunopositive in wild type (Fig. 12C), but not Emx1cre/Metfx/fx, mice (Fig. 12D). The dense axonal staining observed in the ventral tuberomammillary nucleus (Fig. 12C) may be contributed by projection neurons in infralimbic cortex, ventral CA1 or the subiculum (Ericson et al., 1991; Canteras and Swanson, 1992; Cenquizca and Swanson, 2006).
Fig. 11.
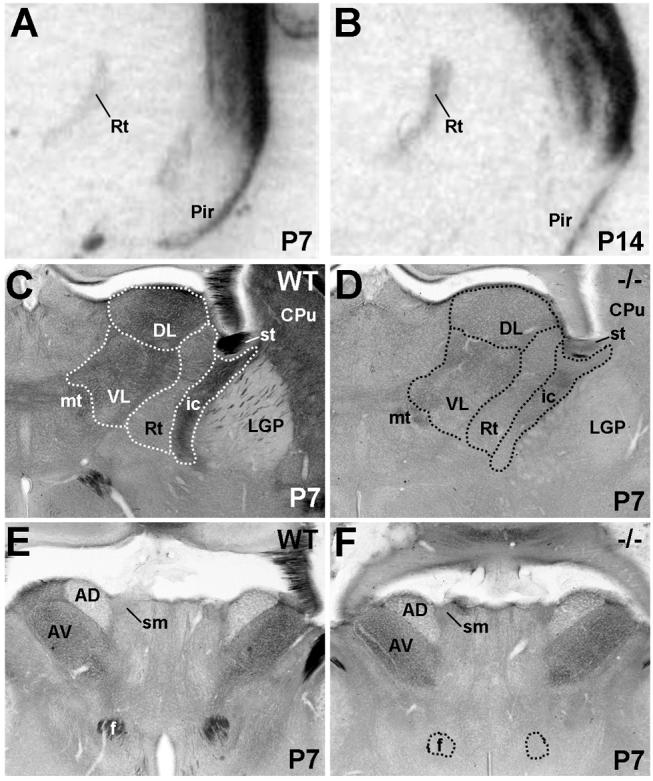
Met transcript and protein expression in the thalamus in coronal sections from wild type and Emx1cre/Metfx/fx mice. A and B: In situ hybridization analysis of Met in wild type thalamus at P7 (A) and P14 (B). Autoradiographic signal is detected specifically in the thalamic reticular nucleus (Rt) at these ages. DIC images of Met immunoreactivity at P7 show that neuropil staining in the Rt and dorsolateral and ventrolateral thalamic nuclei in wild type mice (C) is greatly reduced in corresponding regions of Emx1cre/Metfx/fx mice (D). Conversely, neuropil staining in specific anterior thalamic nuclei is equivalent in wild type (E) and Emx1cre/Metfx/fx (F) mice. Scale bar = 900μm for A,B; 550 μm for C, D, E, and F.
Fig. 12.
DIC photomicrographs illustrate Met immunoreactivity in coronal sections of the hypothalamus and associated axon tracts in wild type (A, C, and E) and Emx1cre/Metfx/fx (B, D, and F) mice at P7. Intense Met staining in the mammillothalamic and mammillotegmental tracts of wild type mice (A) is maintained at equivalent levels in Emx1cre/Metfx/fx mice (D). Notable Met staining on afferents within specific mammillary nuclei (C) and the medial preoptic nucleus (E) in wild type mice is absent in Emx1cre/Metfx/fx mice (D and F), indicating a dorsal pallial origin for these fibers. Scale bar = 550 μm for A, B, C, and D; 275 μm for E and F.
In the anterior hypothalamus, there is no Met expression in the anterodorsal or medial preoptic nuclei at any stage of postnatal development, but Met immunoreactivity is observed in a sparse, but notable, population of axons in both regions (Figs. 8K and 12E). This staining is ablated in the Emx1cre/Metfx/fx mouse (Figs. 8O and 12F). While the data do not definitively elucidate the sources of these Met-expressing fibers, likely candidates include CA1 and subicular pyramidal cells at the ventral pole of the hippocampus (Canteras and Swanson, 1992; Kishi et al., 2000; Cenquizca and Swanson, 2006). An intranuclear source for these stained axons is unlikely, as we do not detect Met mRNA in the anterodorsal nucleus or medial preoptic nucleus.
In the habenula, Met transcript and protein are expressed by projection neurons. In situ hybridization analysis from E18.5 to P14 reveals modest Met transcript expression of the medial, but not the lateral, nucleus (Fig. 13A,B). Over this period, the fasciculus retroflexus axons coursing between the habenula and interpeduncular nucleus (Akagi and Powell, 1968; Herkenham and Nauta, 1977) are also Met-immunoreactive (Fig. 13C,E). Light axonal staining in the habenular commissure is also observed (Fig. 13C). Consistent with the subpallial origin of the medial habenula, comparable levels of Met protein are observed in the fasciculus retroflexus, habenular commissure, and interpeduncular nucleus of the wild type and Emx1cre/Metfx/fx mice throughout postnatal development (Fig. 13D,F). In general, decreased axonal Met staining is observed throughout the diencephalon soon after the end of the second postnatal week (Supplemental Fig. 6), mirroring the decline in other forebrain regions. A notable exception, however, is the relative preservation of Met staining in the fasciculus retroflexus and interpeduncular nucleus (Supplemental Fig. 6C,D).
Fig. 13.
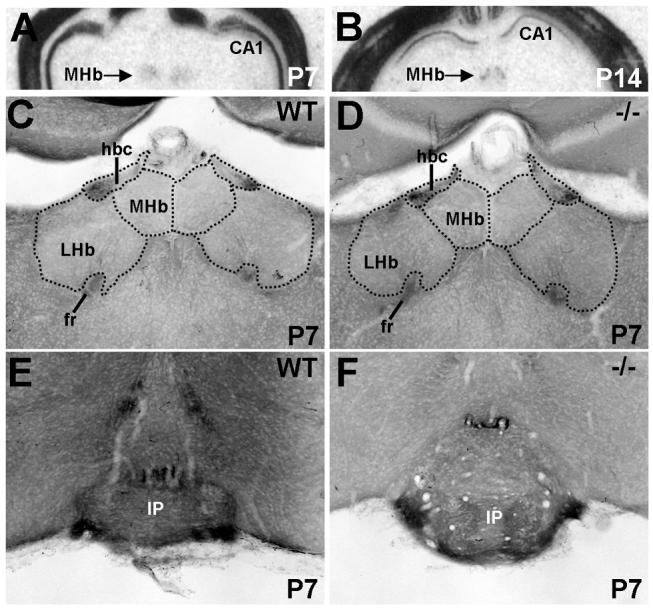
Met transcript and protein expression in the epithalamus in coronal sections from wild type and Emx1cre/Metfx/fx mice. A and B: In situ hybridization analysis of Met in wild type habenula at P7 and P14. Autoradiographic signal at both ages is specific to the medial but not the lateral habenula. DIC photomicrographs of Met immunoreactivity show equivalent, dense staining of axons in the habenular commissure and fasciculus retroflexus (fr) in wild type (C) and Emx1cre/Metfx/fx (D) mice at P7. Levels of axon staining also are equal within target areas of the fr, such as the interpeduncular nucleus, in wild type (E) and Emx1cre/Metfx/fx (F) mice at this age. Scale bar = 1.9mm for A,B; 275 μm for C, D, E and F.
Expression of Met (P21 – P35)
It is clear from in situ hybridization analysis that, after P21, Met transcript continues to be expressed in the forebrain, though at reduced intensity (Fig. 14A). Even more dramatic reductions in immunohistochemical staining are observed at these later postnatal ages, as demonstrated by a relative lack of differential staining in wild type and Emx1cre/Metfx/fx mice (Fig. 14B). This contrasts with the observation that Met protein is detected by Western blot analysis in wild type but not Emx1cre/Metfx/fx cortex (Fig. 14C), suggesting that the reduction in detectable Met protein expression in tissue sections at P21 may be due to technical limitations. For example, subcellular redistribution of Met may reduce local protein concentration to levels beneath the threshold for immunohistochemical detection.
Fig. 14.
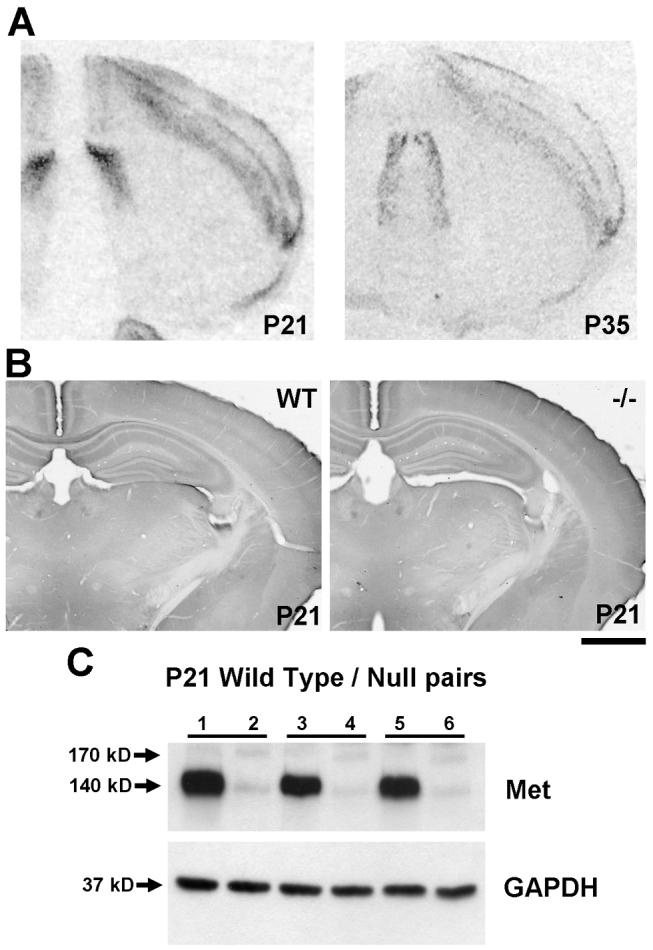
Analysis of Met transcript and protein expression in the developing mouse forebrain at P21 and P35. A: In situ hybridization analysis of Met in coronal sections from wild type mice at P21 and P35 shows equivalent patterns of expression to those observed in early postnatal development (P0 – P14). B: DIC photomicrographs of coronal sections from wild type (left) and Emx1cre/Metrx/fx (right) mice demonstrate that at P21 (shown here) and later, no differences in Met immunoreactivity are observed. C: Western blot analysis of total Met protein in P21 wild type and Emx1cre/Metfx/fx mice. Levels of Met in wild type mice (1,3,5) remain much higher than those in null mice (2,4,6) despite a lack of immunohistochemical staining as shown in B. Scale bar = 1.3 mm for both panels in A; 1.1 mm for both panels in B.
DISCUSSION
The data in the present study provide a comprehensive map of Met receptor mRNA and protein labeling in the developing mouse forebrain, revealing a surprisingly restricted pattern of expression in functionally related circuits. The in situ hybridization data are consistent with, but significantly extend, findings from previous mapping studies (Jung et al., 1994; Thewke and Seeds, 1999). Previous studies reporting Met immunohistochemistry in the forebrain have had a limited neuroanatomical and developmental scope (Thewke and Seeds, 1999; Korhonen et al., 2000; Sun et al., 2002; Ohya et al., 2007), and the antibody reagents used yielded suboptimal and nonspecific labeling in our hands. We employed a novel immunohistochemical approach to localize Met receptor protein, providing compelling evidence that Met is expressed in specific developing axonal projections that reach select terminal regions in the forebrain. Furthermore, our Met immunohistochemical analyses in the Emx1cre/Metfx/fx conditional knockout mouse provide an opportunity to attribute sources of Met labeling within a specific forebrain region as pallial or subpallial in origin.
Our complementary expression mapping tools allowed us to determine that Met receptor expression during forebrain development is restricted mainly to specific populations of projection neurons within the cortex and some classically defined limbic system components (Table 1). Moreover, Met protein is localized primarily to the axons of these cells during peak periods of axon growth and synapse formation, consistent with a putative role for Met in regulating these functions. These data suggest that circuitry underlying socio-emotional processing may be selectively vulnerable to disrupted Met signaling or expression during development. This is consistent with data demonstrating that a MET allelic variant increases risk for ASD, a disorder with core disruptions in social behavior (Campbell et al., 2006).
TABLE 1.
SUMMARY OF FOREBRAIN MET EXPRESSION
| Brain region or tract | Met mRNA expression |
Met protein expression |
|---|---|---|
| Neocortex layer II-III | yes | yes |
| Neocortex layer IV | nd | nd |
| Neocortex layer V-VI | yes | yes |
| Hippocampus -- Subiculum | yes | yes |
| Hippocampus -- CA1 | yes | yes |
| Hippocampus -- CA3 | yes | yes |
| Hippocampus -- Dentate gyrus | nd | nd |
| Caudatoputamen | nd | yes |
| Globus pallidus | nd | yes (fibers of passage) |
| Septum - Dorsolateral | yes | yes |
| Septum - Medial | yes | yes |
| Septum - Intermediate | nd | yes |
| Septum - Ventrolateral | nd | yes |
| Amygdala — NLOT | yes | yes |
| Amygdala — Medial | yes | yes |
| Amygdala — Lateral | yes | yes |
| Amygdala — Basal | yes | yes |
| Amygdala — Posterior cortical | yes | yes |
| Amygdala - Other | nd | yes |
| Thalamus - Reticular nucleus | yes | yes |
| Thalamus - Anterodorsal nucleus | nd | nd |
| Thalamus - Anteroventral | nd | yes |
| Thalamus - Dorsolateral | nd | yes |
| Thalamus - Ventrolateral | nd | yes |
| Hypothalamus - MPO | nd | yes |
| Hypothalamus - Mammillary bodies; lateral |
nd | nd |
| Hypothalamus — Mamillary bodies; medial | na | yes |
| Epithalamus — Medial habenula | yes | yes |
| Epithalamus — Lateral habenula | nd | nd |
| Corpus callosum | nd | yes |
| Cingulum | nd | yes |
| Anterior commissure | nd | yes |
| Internal capsule - Thalamocortical | nd | nd |
| Internal capsule - Corticothalamic | nd | yes |
| Internal capsule - Corticostriatal | nd | yes |
| Internal capsule - Corticobulbar | nd | yes (minimal) |
| Internal capsule - Corticospinal | nd | yes (minimal) |
| Internal capsule - Corticopontine | nd | yes (minimal) |
| External capsule | nd | yes |
| Precommissural fornix | nd | yes |
| Postcommissural fornix | nd | yes |
| Dorsal hippocampal commissure | nd | yes |
| Ventral hippocampal commissure | nd | yes |
| Mammillothalamic tract | nd | yes |
| Mammillotegmental tract | nd | yes |
| Stria terminalis | nd | yes |
| Stra medularis | nd | yes |
| Fasciculus retroflexus | nd | yes |
nd = not detected
na = not analyzed
Restricted cell types express Met in the developing forebrain
The present study identifies specific subsets of projection neurons expressing Met transcript and provides evidence that these developing neurons traffic Met protein predominantly to their axonal compartments. This is consistent with the reported growth-promoting and attractive nature of HGF/Met signaling on axons in the spinal cord and thalamus in vitro (Ebens et al., 1996; Powell et al., 2003). However, here we demonstrate in vivo that the peak of axonal Met expression occurs after the initial establishment of fiber pathways, suggesting that Met may play a preferential role in collateralization and terminal field growth, rather than axon guidance - a distinction that was previously unappreciated. This hypothesis is further supported by the appearance of Met immunoreactivity in the striatal and thalamic neuropil during periods of robust corticostriatal and corticothalamic axon collateralization (Frassoni et al., 1995; Nisenbaum et al., 1998; Sheth et al., 1998).
The general subsidence of Met protein expression in forebrain axons after the end of the second postnatal week coincides with a transition from axon outgrowth and elaboration to pruning and arbor refinement in most murine forebrain circuits (Stanfield et al., 1982; Stanfield et al., 1987; Gomez-Di Cesare et al., 1997; Portera-Cailliau et al., 2005). In the corpus callosum and stria terminalis, however, Met expression persists later and is detected through P21. This may reflect, relative to other axon tracts, more protracted periods of development, which, for the corpus callosum, have been determined by measurements of myelination (Jacobson, 1963; Tanaka et al., 2003; Vincze et al., 2008).
Though we found Met to be expressed predominantly by axons of projection neurons during forebrain development, our data do not preclude this receptor from being expressed at lower levels within dendrites and postsynaptic compartments, and even by other neuronal cell types. For example, though Met mRNA was not evident at any time in the ganglionic eminence and maturing striatum, Met protein labeling is seen on interneurons in explant cultures from the ganglionic eminence (Powell et al., 2001). Additionally, cultured dorsal thalamic neurons respond to HGF (Powell et al., 2003), indicating that either in vitro conditions may induce Met expression on neurons that normally do not express the transcript and protein during development, or the receptor is expressed below the limits of detection on certain cell types in vivo.
At the subcellular level, a shift to a predominantly synaptic localization after P14 may result in a more evenly distributed Met receptor population throughout the neuropil, which would be less readily detected by immunohistochemistry than axon fascicles and tracts, where protein levels are more concentrated. This may explain why, at P21, differential immunohistochemical labeling between wild type and Emx1cre/Metfx/fx mice remains observable only in a subset of axon tracts despite large differences in cortical Met protein expression detected at the biochemical level. This interpretation is consistent with electrophysiological, biochemical and immuno-electron microscopy studies in the hippocampus that indicate Met to be present and functional at excitatory synapses in mature animals (Akimoto et al., 2004; Tyndall and Walikonis, 2006). Furthermore, there is emerging evidence that Met plays a developmental role in synaptic organization, as recent in vitro studies have demonstrated that HGF/Met signaling results in the enhanced expression and clustering of synaptic components (Madhavan and Peng, 2006; Tyndall and Walikonis, 2006; Nakano et al., 2007).
By adolescence and into adulthood, Met protein expression is low throughout the forebrain. Despite this dramatic down-regulation, however, patterns of transcript expression remain similar across early and late postnatal development, suggesting that the same populations of forebrain projection neurons express Met even during late developmental periods. This may reflect additional roles for Met in response to stress. For instance, Met is dramatically upregulated in cortical and hippocampal axons in adult animals with genetically compromised astrocytic populations (Su et al., 2007). HGF and Met are also upregulated in the cerebral cortex subsequent to a transient ischemic insult, though it is not known if Met protein levels specifically increase in cortical axons in this case (Honda et al., 1995).
In addition, there are reports of Met expression by non-neuronal cells of the CNS, including astrocytes, oligodendrocytes and microglia. Many of these studies report expression by these glial subtypes in vitro (Machide et al., 2000; Yan and Rivkees, 2002) or in injury or disease states (Lalive et al., 2005; Kitamura et al., 2007; Shimamura et al., 2007), which may induce or enhance expression of the transcript and protein. In a developmental context, Ohya and colleagues report that striatal oligodendrocyte precursor cells (OPCs) express Met in vivo and respond to intrastriatal injections of HGF by remaining in a proliferative, immature state, delaying myelination (Ohya et al., 2007). However, we do not observe Met mRNA in cell bodies within either the gray matter or fiber tracts of the developing striatum, suggesting that the reported effects of HGF on OPC maturation may be axonally derived. While we cannot eliminate the possibility of Met expression by non-neuronal cells in the striatum and other forebrain regions, the patterns of labeling are not consistent with such expression during forebrain development.
Limbic system correlates of Met expression
While analysis of the spatio-temporal dynamics of Met expression provides insight into its cellular roles during development, analysis at the neural systems level lends insight into potential roles for Met signaling in the development of specific forebrain circuits. Patterns of Met expression overlap remarkably with classically defined limbic structures and their interconnecting fiber pathways (Broca, 1878; Papez, 1937; MacLean, 1955). It seems likely, therefore, that this receptor may be particularly important to the establishment of circuits that mediate social and emotional information processing. In the cortex, Met is expressed in multiple areas that have roles in processing limbic information, including the cingulate, prefrontal, orbitofrontal, temporal, and sensory association cortices. Additionally, Met is expressed in limbic structures involved in learning and memory, including the hippocampal formation and the mammillary bodies of the hypothalamus. Finally, Met is expressed in amygdaloid subnuclei, which attach emotional valence to the processes of learning and memory (Davis and Whalen, 2001; Phelps and LeDoux, 2005), and the septum, which has roles in emotional regulation and the control of impulses (Gray and McNaughton, 1982; Menard and Treit, 1999).
Substantial Met expression is also present in axon pathways interconnecting principal limbic circuit nodes. For example, Met is expressed heavily in the cingulum, fornix, mammillothalamic tract, and internal capsule, all considered to be classic limbic pathways (Broca, 1878; Papez, 1937; MacLean, 1955). Additionally, Met expression is observed in the anterior commissure, which transmits information between temporal cortical areas, and tracts connecting the amygdala to other forebrain areas including the external capsule and the stria terminalis. Temporally, expression of Met in these fibers coincides with the period of maximal axonal outgrowth and collateralization, suggesting that Met is involved in these processes, and, therefore, in the development of limbic connections. As a corollary, aberrant Met signaling would likely result in deficient formation and subsequent function of these circuits. This is consistent with the first reported association of MET with a human, brain-based disorder, ASD (Campbell et al., 2006).
A role for Met in neurodevelopmental and neuropsychiatric disorders
Given the prevalence of Met in the forebrain structures discussed above, we hypothesize that this protein, or elements of its signaling pathway, may play a role in the etiology and/or pathophysiology of neurodevelopmental and psychiatric disorders with socio-emotional valence. Three lines of evidence support this hypothesis. First, MET, the human homolog of Met, has been identified as an ASD susceptibility gene (Campbell et al., 2006). Second, MET protein expression is reduced in the superior temporal gyrus of individuals with autism (Campbell et al., 2007), whereas transcripts encoding other proteins in the MET signaling pathway are increased significantly. Third, an analysis of MET pathway genes reveals an association of an allelic variant of PLAUR with ASD (Campbell et al., 2008). PLAUR encodes the urokinase plasminogen activator receptor, which enhances HGF activation and signaling (Pepper et al., 1992; Mars et al., 1993).
At a cellular level, too, our findings suggest that disruption of MET may underlie or contribute to the pathophysiology of neuropsychiatric disorders. It has been suggested that many disorders, including ASD and schizophrenia, result from aberrant formation of neuronal connections during development (Rubenstein and Merzenich, 2003; Frith, 2004; Courchesne and Pierce, 2005; Geschwind and Levitt, 2007; Connors et al., 2008). The timing of expression, and the cellular compartmentalization of Met expression in the mouse suggests that the protein may have a larger than previously appreciated role in establishing and facilitating the maturation of appropriate connections. Consequently, errant Met signaling is likely to result in disruption of normal patterns of connectivity in the forebrain. Disrupted Met signaling could result from alterations in the regulation, timing, or levels of receptor expression. Ongoing analysis of the Emx1cre/Metfx/fx mouse and other models of disrupted Met signaling will help to elucidate the roles of Met in developing forebrain connectivity.
Supplementary Material
OTHER ACKNOWLEDGEMENTS
We thank Deborah Gregory, Donte Smith, Kate Spencer and Paula Woods for excellent technical assistance. We also thank Drs. Elizabeth Hammock, Shenfeng Qiu, and Barbara Thompson for helpful comments on the manuscript.
Grant sponsor: National Institutes of Health (NIH)/National Insitute of Mental Health (NIMH); Grant number MH67842 (PL); Grant Sponsor: NIH/National Institute of Child Health and Human Development; Grant number: P30 HD15052; Grant sponsor: NIH/NIMH; Grant number MH083474 (MYB); and Funds from the Annette Schaffer Eskind Endowed Chair (PL).
LITERATURE CITED
- Aggleton JP. The amygdala : a functional analysis. xiv. Oxford University Press; Oxford, OX ; New York: 2000. p. 690. [Google Scholar]
- Aghajanian GK, Bloom FE. The formation of synaptic junctions in developing rat brain: a quantitative electron microscopic study. Brain Res. 1967;6:716–727. doi: 10.1016/0006-8993(67)90128-x. [DOI] [PubMed] [Google Scholar]
- Akagi K, Powell EW. Differential projections of habenular nuclei. J Comp Neurol. 1968;132:263–274. doi: 10.1002/cne.901320204. [DOI] [PubMed] [Google Scholar]
- Akimoto M, Baba A, Ikeda-Matsuo Y, Yamada MK, Itamura R, Nishiyama N, Ikegaya Y, Matsuki N. Hepatocyte growth factor as an enhancer of nmda currents and synaptic plasticity in the hippocampus. Neuroscience. 2004;128:155–162. doi: 10.1016/j.neuroscience.2004.06.031. [DOI] [PubMed] [Google Scholar]
- Allen GV, Hopkins DA. Mamillary body in the rat: topography and synaptology of projections from the subicular complex, prefrontal cortex, and midbrain tegmentum. J Comp Neurol. 1989;286:311–336. doi: 10.1002/cne.902860303. [DOI] [PubMed] [Google Scholar]
- Ashley-Koch A, Wolpert CM, Menold MM, Zaeem L, Basu S, Donnelly SL, Ravan SA, Powell CM, Qumsiyeh MB, Aylsworth AS, Vance JM, Gilbert JR, Wright HH, Abramson RK, DeLong GR, Cuccaro ML, Pericak-Vance MA. Genetic studies of autistic disorder and chromosome 7. Genomics. 1999;61:227–236. doi: 10.1006/geno.1999.5968. [DOI] [PubMed] [Google Scholar]
- Barrett S, Beck JC, Bernier R, Bisson E, Braun TA, Casavant TL, Childress D, Folstein SE, Garcia M, Gardiner MB, Gilman S, Haines JL, Hopkins K, Landa R, Meyer NH, Mullane JA, Nishimura DY, Palmer P, Piven J, Purdy J, Santangelo SL, Searby C, Sheffield V, Singleton J, Slager S, et al. An autosomal genomic screen for autism. Collaborative linkage study of autism. American journal of medical genetics. 1999;88:609–615. doi: 10.1002/(sici)1096-8628(19991215)88:6<609::aid-ajmg7>3.3.co;2-c. [DOI] [PubMed] [Google Scholar]
- Bladt F, Riethmacher D, Isenmann S, Aguzzi A, Birchmeier C. Essential role for the c-Met receptor in the migration of myogenic precursor cells into the limb bud. Nature. 1995;376:768–771. doi: 10.1038/376768a0. [DOI] [PubMed] [Google Scholar]
- Blue ME, Parnavelas JG. The formation and maturation of synapses in the visual cortex of the rat. II. Quantitative analysis. J Neurocytol. 1983;12:697–712. doi: 10.1007/BF01181531. [DOI] [PubMed] [Google Scholar]
- Broca P. Anatomie comparee des circonvolutions cerebrales: le grand lobe limbique. Rev Anthropol. 1878;1:385–498. [Google Scholar]
- Brodal A. The origin of the fibers of the anterior commissure in the rat. Experimental studies. J Comp Neurol. 1948;88:157–205. doi: 10.1002/cne.900880202. [DOI] [PubMed] [Google Scholar]
- Brothers LA, Finch DM. Physiological evidence for an excitatory pathway from entorhinal cortex to amygdala in the rat. Brain Res. 1985;359:10–20. doi: 10.1016/0006-8993(85)91407-6. [DOI] [PubMed] [Google Scholar]
- Campbell DB, Levitt P. Regionally restricted expression of the transcription factor c-myc intron 1 binding protein during brain development. J Comp Neurol. 2003;467:581–592. doi: 10.1002/cne.10958. [DOI] [PubMed] [Google Scholar]
- Campbell DB, Sutcliffe JS, Ebert PJ, Militerni R, Bravaccio C, Trillo S, Elia M, Schneider C, Melmed R, Sacco R, Persico AM, Levitt P. A genetic variant that disrupts MET transcription is associated with autism. Proc Natl Acad Sci U S A. 2006;103:16834–16839. doi: 10.1073/pnas.0605296103. [DOI] [PMC free article] [PubMed] [Google Scholar]
- Campbell DB, D’Oronzio R, Garbett K, Ebert PJ, Mirnics K, Levitt P, Persico AM. Disruption of cerebral cortex MET signaling in autism spectrum disorder. Annals of neurology. 2007;62:243–250. doi: 10.1002/ana.21180. [DOI] [PubMed] [Google Scholar]
- Campbell DB, Li C, Sutcliffe JS, Persico AM, Levitt P. Genetic evidence implicating multiple genes in the MET receptor tyrosine kinase pathway in autism spectrum disorder. Autism Research. 2008;1:159–168. doi: 10.1002/aur.27. [DOI] [PMC free article] [PubMed] [Google Scholar]
- Canteras NS, Simerly RB, Swanson LW. Connections of the posterior nucleus of the amygdala. J Comp Neurol. 1992;324:143–179. doi: 10.1002/cne.903240203. [DOI] [PubMed] [Google Scholar]
- Canteras NS, Swanson LW. Projections of the ventral subiculum to the amygdala, septum, and hypothalamus: a PHAL anterograde tract-tracing study in the rat. J Comp Neurol. 1992;324:180–194. doi: 10.1002/cne.903240204. [DOI] [PubMed] [Google Scholar]
- Canteras NS, Simerly RB, Swanson LW. Organization of projections from the medial nucleus of the amygdala: a PHAL study in the rat. J Comp Neurol. 1995;360:213–245. doi: 10.1002/cne.903600203. [DOI] [PubMed] [Google Scholar]
- Caton A, Hacker A, Naeem A, Livet J, Maina F, Bladt F, Klein R, Birchmeier C, Guthrie S. The branchial arches and HGF are growth-promoting and chemoattractant for cranial motor axons. Development. 2000;127:1751–1766. doi: 10.1242/dev.127.8.1751. [DOI] [PubMed] [Google Scholar]
- Cenquizca LA, Swanson LW. Analysis of direct hippocampal cortical field CA1 axonal projections to diencephalon in the rat. J Comp Neurol. 2006;497:101–114. doi: 10.1002/cne.20985. [DOI] [PMC free article] [PubMed] [Google Scholar]
- Chang HT, Wilson CJ, Kitai ST. Single neostriatal efferent axons in the globus pallidus: a light and electron microscopic study. Science. 1981;213:915–918. doi: 10.1126/science.7256286. [DOI] [PubMed] [Google Scholar]
- Chiba T, Murata Y. Afferent and efferent connections of the medial preoptic area in the rat: a WGA-HRP study. Brain Res Bull. 1985;14:261–272. doi: 10.1016/0361-9230(85)90091-7. [DOI] [PubMed] [Google Scholar]
- Connors SL, Levitt P, Matthews SG, Slotkin TA, Johnston MV, Kinney HC, Johnson WG, Dailey RM, Zimmerman AW. Fetal mechanisms in neurodevelopmental disorders. Pediatric neurology. 2008;38:163–176. doi: 10.1016/j.pediatrneurol.2007.10.009. [DOI] [PubMed] [Google Scholar]
- Cooper CS, Park M, Blair DG, Tainsky MA, Huebner K, Croce CM, Vande Woude GF. Molecular cloning of a new transforming gene from a chemically transformed human cell line. Nature. 1984;311:29–33. doi: 10.1038/311029a0. [DOI] [PubMed] [Google Scholar]
- Courchesne E, Pierce K. Why the frontal cortex in autism might be talking only to itself: local over-connectivity but long-distance disconnection. Current opinion in neurobiology. 2005;15:225–230. doi: 10.1016/j.conb.2005.03.001. [DOI] [PubMed] [Google Scholar]
- Cruce JA. An autoradiographic study of the projections of the mammillothalamic tract in the rat. Brain Res. 1975;85:211–219. doi: 10.1016/0006-8993(75)90072-4. [DOI] [PubMed] [Google Scholar]
- Davis M, Whalen PJ. The amygdala: vigilance and emotion. Molecular Psychiatry. 2001;6:13–34. doi: 10.1038/sj.mp.4000812. [DOI] [PubMed] [Google Scholar]
- De Felipe J, Marco P, Fairen A, Jones EG. Inhibitory synaptogenesis in mouse somatosensory cortex. Cereb Cortex. 1997;7:619–634. doi: 10.1093/cercor/7.7.619. [DOI] [PubMed] [Google Scholar]
- Dolorfo CL, Amaral DG. Entorhinal cortex of the rat: topographic organization of the cells of origin of the perforant path projection to the dentate gyrus. J Comp Neurol. 1998;398:25–48. [PubMed] [Google Scholar]
- Domesick VB. The fasciculus cinguli in the rat. Brain Res. 1970;20:19–32. doi: 10.1016/0006-8993(70)90150-2. [DOI] [PubMed] [Google Scholar]
- Dong HW, Petrovich GD, Swanson LW. Topography of projections from amygdala to bed nuclei of the stria terminalis. Brain Res Brain Res Rev. 2001;38:192–246. doi: 10.1016/s0165-0173(01)00079-0. [DOI] [PubMed] [Google Scholar]
- Dyson SE, Jones DG. Quantitation of terminal parameters and their interrelationships in maturing central synapses: a perspective for experimental studies. Brain Res. 1980;183:43–59. doi: 10.1016/0006-8993(80)90118-3. [DOI] [PubMed] [Google Scholar]
- Ebens A, Brose K, Leonardo ED, Hanson MG, Jr., Bladt F, Birchmeier C, Barres BA, Tessier-Lavigne M. Hepatocyte growth factor/scatter factor is an axonal chemoattractant and a neurotrophic factor for spinal motor neurons. Neuron. 1996;17:1157–1172. doi: 10.1016/s0896-6273(00)80247-0. [DOI] [PubMed] [Google Scholar]
- Ericson H, Blomqvist A, Kohler C. Origin of neuronal inputs to the region of the tuberomammillary nucleus of the rat brain. J Comp Neurol. 1991;311:45–64. doi: 10.1002/cne.903110105. [DOI] [PubMed] [Google Scholar]
- Faulkner B, Brown TH. Morphology and physiology of neurons in the rat perirhinal-lateral amygdala area. J Comp Neurol. 1999;411:613–642. [PubMed] [Google Scholar]
- Frassoni C, Arcelli P, Regondi MC, Selvaggio M, De Biasi S, Spreafico R. Branching pattern of corticothalamic projections from the somatosensory cortex during postnatal development in the rat. Brain Res Dev Brain Res. 1995;90:111–121. doi: 10.1016/0165-3806(96)83491-2. [DOI] [PubMed] [Google Scholar]
- Frith C. Is autism a disconnection disorder? Lancet neurology. 2004;3:577. doi: 10.1016/S1474-4422(04)00875-0. [DOI] [PubMed] [Google Scholar]
- Garzotto D, Giacobini P, Crepaldi T, Fasolo A, De Marchis S. Hepatocyte growth factor regulates migration of olfactory interneuron precursors in the rostral migratory stream through Met-Grb2 coupling. J Neurosci. 2008;28:5901–5909. doi: 10.1523/JNEUROSCI.1083-08.2008. [DOI] [PMC free article] [PubMed] [Google Scholar]
- Geschwind DH, Levitt P. Autism spectrum disorders: developmental disconnection syndromes. Current opinion in neurobiology. 2007;17:103–111. doi: 10.1016/j.conb.2007.01.009. [DOI] [PubMed] [Google Scholar]
- Giacobini P, Messina A, Wray S, Giampietro C, Crepaldi T, Carmeliet P, Fasolo A. Hepatocyte growth factor acts as a motogen and guidance signal for gonadotropin hormone-releasing hormone-1 neuronal migration. J Neurosci. 2007;27:431–445. doi: 10.1523/JNEUROSCI.4979-06.2007. [DOI] [PMC free article] [PubMed] [Google Scholar]
- Gomez-Di Cesare CM, Smith KL, Rice FL, Swann JW. Axonal remodeling during postnatal maturation of CA3 hippocampal pyramidal neurons. J Comp Neurol. 1997;384:165–180. [PubMed] [Google Scholar]
- Gonzalo-Ruiz A, Alonso A, Sanz JM, Llinas RR. Afferent projections to the mammillary complex of the rat, with special reference to those from surrounding hypothalamic regions. J Comp Neurol. 1992;321:277–299. doi: 10.1002/cne.903210208. [DOI] [PubMed] [Google Scholar]
- Gorski JA, Talley T, Qiu M, Puelles L, Rubenstein JL, Jones KR. Cortical excitatory neurons and glia, but not GABAergic neurons, are produced in the Emx1-expressing lineage. J Neurosci. 2002;22:6309–6314. doi: 10.1523/JNEUROSCI.22-15-06309.2002. [DOI] [PMC free article] [PubMed] [Google Scholar]
- Gottlieb DI, Cowan WM. Autoradiographic studies of the commissural and ipsilateral association connection of the hippocampus and detentate gyrus of the rat. I. The commissural connections. J Comp Neurol. 1973;149:393–422. doi: 10.1002/cne.901490402. [DOI] [PubMed] [Google Scholar]
- Gray JA, McNaughton N. Comparison between the behavioural effects of septal and hippocampal lesions: a review. Neuroscience & Biobehavioral Reviews. 1983;7:119–188. doi: 10.1016/0149-7634(83)90014-3. [DOI] [PubMed] [Google Scholar]
- Guillery RW. Degeneration in the hypothalamic connexions of the albino rat. J Anat. 1957;91:91–115. [PMC free article] [PubMed] [Google Scholar]
- Gurdjian ES. Olfactory connections in the albino rat, with special reference to the stria medullaris and the anterior commissure. J Comp Neurol. 1925;38:127–163. [Google Scholar]
- Gutierrez H, Dolcet X, Tolcos M, Davies A. HGF regulates the development of cortical pyramidal dendrites. Development. 2004;131:3717–3726. doi: 10.1242/dev.01209. [DOI] [PubMed] [Google Scholar]
- Hamanoue M, Takemoto N, Matsumoto K, Nakamura T, Nakajima K, Kohsaka S. Neurotrophic effect of hepatocyte growth factor on central nervous system neurons in vitro. J Neurosci Res. 1996;43:554–564. doi: 10.1002/(SICI)1097-4547(19960301)43:5<554::AID-JNR5>3.0.CO;2-H. [DOI] [PubMed] [Google Scholar]
- Heinbockel T, Pape HC. Input-specific long-term depression in the lateral amygdala evoked by theta frequency stimulation. J Neurosci. 2000;20:RC68. doi: 10.1523/JNEUROSCI.20-07-j0002.2000. [DOI] [PMC free article] [PubMed] [Google Scholar]
- Herkenham M, Nauta WJ. Afferent connections of the habenular nuclei in the rat. A horseradish peroxidase study, with a note on the fiber-of-passage problem. J Comp Neurol. 1977;173:123–146. doi: 10.1002/cne.901730107. [DOI] [PubMed] [Google Scholar]
- Hockfield S. Molecular probes of the nervous system; selected methods for antibody and nucleic acid probes. xxii. Cold Spring Harbor Laboratory Press; Plainview, NY: 1993. p. 679. [Google Scholar]
- Honda S, Kagoshima M, Wanaka A, Tohyama M, Matsumoto K, Nakamura T. Localization and functional coupling of HGF and c-Met/HGF receptor in rat brain: implication as neurotrophic factor. Brain Res Mol Brain Res. 1995;32:197–210. doi: 10.1016/0169-328x(95)00075-4. [DOI] [PubMed] [Google Scholar]
- Huh CG, Factor VM, Sanchez A, Uchida K, Conner EA, Thorgeirsson SS. Hepatocyte growth factor/c-met signaling pathway is required for efficient liver regeneration and repair. Proc Natl Acad Sci U S A. 2004;101:4477–4482. doi: 10.1073/pnas.0306068101. [DOI] [PMC free article] [PubMed] [Google Scholar]
- IMGSAC A full genome screen for autism with evidence for linkage to a region on chromosome 7q. International Molecular Genetic Study of Autism Consortium Hum Mol Genet. 1998;7:571–578. doi: 10.1093/hmg/7.3.571. [DOI] [PubMed] [Google Scholar]
- Jacobson S. Sequence Of Myelinization In The Brain Of The Albino Rat. A. Cerebral Cortex, Thalamus And Related Structures. J Comp Neurol. 1963;121:5–29. doi: 10.1002/cne.901210103. [DOI] [PubMed] [Google Scholar]
- Jouandet ML, Hartenstein V. Basal telencephalic origins of the anterior commissure of the rat. Experimental brain research Experimentelle Hirnforschung. 1983;50:183–192. doi: 10.1007/BF00239182. [DOI] [PubMed] [Google Scholar]
- Jung W, Castren E, Odenthal M, Vande Woude GF, Ishii T, Dienes HP, Lindholm D, Schirmacher P. Expression and functional interaction of hepatocyte growth factor-scatter factor and its receptor c-met in mammalian brain. J Cell Biol. 1994;126:485–494. doi: 10.1083/jcb.126.2.485. [DOI] [PMC free article] [PubMed] [Google Scholar]
- Kawaja MD, Flumerfelt BA, Hrycyshyn AW. Synaptic organization of septal projections in the rat medial habenula: a wheat germ agglutinin-horseradish peroxidase and immunohistochemical study. Synapse. 1990;6:45–54. doi: 10.1002/syn.890060106. [DOI] [PubMed] [Google Scholar]
- Kishi T, Tsumori T, Ono K, Yokota S, Ishino H, Yasui Y. Topographical organization of projections from the subiculum to the hypothalamus in the rat. J Comp Neurol. 2000;419:205–222. doi: 10.1002/(sici)1096-9861(20000403)419:2<205::aid-cne5>3.0.co;2-0. [DOI] [PubMed] [Google Scholar]
- Kitamura K, Iwanami A, Nakamura M, Yamane J, Watanabe K, Suzuki Y, Miyazawa D, Shibata S, Funakoshi H, Miyatake S, Coffin RS, Nakamura T, Toyama Y, Okano H. Hepatocyte growth factor promotes endogenous repair and functional recovery after spinal cord injury. J Neurosci Res. 2007;85:2332–2342. doi: 10.1002/jnr.21372. [DOI] [PubMed] [Google Scholar]
- Korhonen L, Sjoholm U, Takei N, Kern MA, Schirmacher P, Castren E, Lindholm D. Expression of c-Met in developing rat hippocampus: evidence for HGF as a neurotrophic factor for calbindin D-expressing neurons. Eur J Neurosci. 2000;12:3453–3461. doi: 10.1046/j.1460-9568.2000.00260.x. [DOI] [PubMed] [Google Scholar]
- Lalive PH, Paglinawan R, Biollaz G, Kappos EA, Leone DP, Malipiero U, Relvas JB, Moransard M, Suter T, Fontana A. TGF-beta-treated microglia induce oligodendrocyte precursor cell chemotaxis through the HGF-c-Met pathway. Eur J Immunol. 2005;35:727–737. doi: 10.1002/eji.200425430. [DOI] [PubMed] [Google Scholar]
- Lim CS, Walikonis RS. Hepatocyte growth factor and c-Met promote dendritic maturation during hippocampal neuron differentiation via the Akt pathway. Cell Signal. 2008;20:825–835. doi: 10.1016/j.cellsig.2007.12.013. [DOI] [PMC free article] [PubMed] [Google Scholar]
- Machide M, Kamitori K, Kohsaka S. Hepatocyte growth factor-induced differential activation of phospholipase cgamma 1 and phosphatidylinositol 3-kinase is regulated by tyrosine phosphatase SHP-1 in astrocytes. J Biol Chem. 2000;275:31392–31398. doi: 10.1074/jbc.M002817200. [DOI] [PubMed] [Google Scholar]
- MacLean PD. The limbic system (“visceral brain”) and emotional behavior. Archives of Neurology and Psychiatry. 1955;73:130–134. doi: 10.1001/archneurpsyc.1955.02330080008004. [DOI] [PubMed] [Google Scholar]
- Madhavan R, Peng HB. HGF induction of postsynaptic specializations at the neuromuscular junction. J Neurobiol. 2006;66:134–147. doi: 10.1002/neu.20206. [DOI] [PubMed] [Google Scholar]
- Markus EJ, Petit TL. Neocortical synaptogenesis, aging, and behavior: lifespan development in the motor-sensory system of the rat. Exp Neurol. 1987;96:262–278. doi: 10.1016/0014-4886(87)90045-8. [DOI] [PubMed] [Google Scholar]
- Mars WM, Zarnegar R, Michalopoulos GK. Activation of hepatocyte growth factor by the plasminogen activators uPA and tPA. Am J Pathol. 1993;143:949–958. [PMC free article] [PubMed] [Google Scholar]
- Martins GJ, Plachez C, Powell EM. Loss of embryonic MET signaling alters profiles of hippocampal interneurons. Dev Neurosci. 2007;29:143–158. doi: 10.1159/000096219. [DOI] [PubMed] [Google Scholar]
- McDonald AJ. Organization of amygdaloid projections to the prefrontal cortex and associated striatum in the rat. Neuroscience. 1991a;44:1–14. doi: 10.1016/0306-4522(91)90247-l. [DOI] [PubMed] [Google Scholar]
- McDonald AJ. Topographical organization of amygdaloid projections to the caudatoputamen, nucleus accumbens, and related striatal-like areas of the rat brain. Neuroscience. 1991b;44:15–33. doi: 10.1016/0306-4522(91)90248-m. [DOI] [PubMed] [Google Scholar]
- Menard J, Treit D. Effects of centrally administered anxiolytic compounds in animal models of anxiety. Neuroscience & Biobehavioral Reviews. 1999;23:591–613. doi: 10.1016/s0149-7634(98)00056-6. [DOI] [PubMed] [Google Scholar]
- Micheva KD, Beaulieu C. Quantitative aspects of synaptogenesis in the rat barrel field cortex with special reference to GABA circuitry. J Comp Neurol. 1996;373:340–354. doi: 10.1002/(SICI)1096-9861(19960923)373:3<340::AID-CNE3>3.0.CO;2-2. [DOI] [PubMed] [Google Scholar]
- Miller M, Peters A. Maturation of rat visual cortex. II. A combined Golgi-electron microscope study of pyramidal neurons. J Comp Neurol. 1981;203:555–573. doi: 10.1002/cne.902030402. [DOI] [PubMed] [Google Scholar]
- Miller MW. Maturation of rat visual cortex. III. Postnatal morphogenesis and synaptogenesis of local circuit neurons. Brain Res. 1986;390:271–285. doi: 10.1016/s0006-8993(86)80236-0. [DOI] [PubMed] [Google Scholar]
- Mufson EJ, Pandya DN. Some observations on the course and composition of the cingulum bundle in the rhesus monkey. J Comp Neurol. 1984;225:31–43. doi: 10.1002/cne.902250105. [DOI] [PubMed] [Google Scholar]
- Nakano M, Takagi N, Takagi K, Funakoshi H, Matsumoto K, Nakamura T, Takeo S. Hepatocyte growth factor promotes the number of PSD-95 clusters in young hippocampal neurons. Exp Neurol. 2007;207:195–202. doi: 10.1016/j.expneurol.2007.06.007. [DOI] [PubMed] [Google Scholar]
- Nisenbaum LK, Webster SM, Chang SL, McQueeney KD, LoTurco JJ. Early patterning of prelimbic cortical axons to the striatal patch compartment in the neonatal mouse. Dev Neurosci. 1998;20:113–124. doi: 10.1159/000017307. [DOI] [PubMed] [Google Scholar]
- Ohya W, Funakoshi H, Kurosawa T, Nakamura T. Hepatocyte growth factor (HGF) promotes oligodendrocyte progenitor cell proliferation and inhibits its differentiation during postnatal development in the rat. Brain Res. 2007;1147:51–65. doi: 10.1016/j.brainres.2007.02.045. [DOI] [PubMed] [Google Scholar]
- Papez JW. A proposed mechanism of emotion. Archives of Neurology and Psychiatry. 1937;38:725–743. [Google Scholar]
- Parnavelas JG, Uylings HB. The growth of non-pyramidal neurons in the visual cortex of the rat: a morphometric study. Brain Res. 1980;193:373–382. doi: 10.1016/0006-8993(80)90171-7. [DOI] [PubMed] [Google Scholar]
- Pennypacker K, Fischer I, Levitt P. Early in vitro genesis and differentiation of axons and dendrites by hippocampal neurons analyzed quantitatively with neurofilament-H and microtubule-associated protein 2 antibodies. Exp Neurol. 1991;111:22–35. doi: 10.1016/0014-4886(91)90047-g. [DOI] [PubMed] [Google Scholar]
- Pepper MS, Matsumoto K, Nakamura T, Orci L, Montesano R. Hepatocyte growth factor increases urokinase-type plasminogen activator (u-PA) and u-PA receptor expression in Madin-Darby canine kidney epithelial cells. J Biol Chem. 1992;267:20493–20496. [PubMed] [Google Scholar]
- Phelan KD, Sacaan A, Gallagher JP. Retrograde labeling of rat dorsolateral septal nucleus neurons following intraseptal injections of WGA-HRP. Synapse. 1996;22:261–268. doi: 10.1002/(SICI)1098-2396(199603)22:3<261::AID-SYN9>3.0.CO;2-A. [DOI] [PubMed] [Google Scholar]
- Phelps EA, LeDoux JE. Contributions of the amygdala to emotion processing: from animal models to human behavior. Neuron. 2005;48:175–187. doi: 10.1016/j.neuron.2005.09.025. [DOI] [PubMed] [Google Scholar]
- Portera-Cailliau C, Weimer RM, De Paola V, Caroni P, Svoboda K. Diverse modes of axon elaboration in the developing neocortex. PLoS Biol. 2005;3:e272. doi: 10.1371/journal.pbio.0030272. [DOI] [PMC free article] [PubMed] [Google Scholar]
- Powell EM, Mars WM, Levitt P. Hepatocyte growth factor/scatter factor is a motogen for interneurons migrating from the ventral to dorsal telencephalon. Neuron. 2001;30:79–89. doi: 10.1016/s0896-6273(01)00264-1. [DOI] [PubMed] [Google Scholar]
- Powell EM, Muhlfriedel S, Bolz J, Levitt P. Differential regulation of thalamic and cortical axonal growth by hepatocyte growth factor/scatter factor. Dev Neurosci. 2003;25:197–206. doi: 10.1159/000072268. [DOI] [PubMed] [Google Scholar]
- Preston RJ, Bishop GA, Kitai ST. Medium spiny neuron projection from the rat striatum: an intracellular horseradish peroxidase study. Brain Res. 1980;183:253–263. doi: 10.1016/0006-8993(80)90462-x. [DOI] [PubMed] [Google Scholar]
- Risold PY, Swanson LW. Connections of the rat lateral septal complex. Brain Res Brain Res Rev. 1997;24:115–195. doi: 10.1016/s0165-0173(97)00009-x. [DOI] [PubMed] [Google Scholar]
- Rubenstein JL, Merzenich MM. Model of autism: increased ratio of excitation/inhibition in key neural systems. Genes, brain, and behavior. 2003;2:255–267. doi: 10.1034/j.1601-183x.2003.00037.x. [DOI] [PMC free article] [PubMed] [Google Scholar]
- Santiago AC, Shammah-Lagnado SJ. Efferent connections of the nucleus of the lateral olfactory tract in the rat. J Comp Neurol. 2004;471:314–332. doi: 10.1002/cne.20028. [DOI] [PubMed] [Google Scholar]
- Seki M, Zyo K. Anterior thalamic afferents from the mamillary body and the limbic cortex in the rat. J Comp Neurol. 1984;229:242–256. doi: 10.1002/cne.902290209. [DOI] [PubMed] [Google Scholar]
- Sheth AN, McKee ML, Bhide PG. The sequence of formation and development of corticostriate connections in mice. Dev Neurosci. 1998;20:98–112. doi: 10.1159/000017306. [DOI] [PubMed] [Google Scholar]
- Shibata H. Efferent projections from the anterior thalamic nuclei to the cingulate cortex in the rat. J Comp Neurol. 1993;330:533–542. doi: 10.1002/cne.903300409. [DOI] [PubMed] [Google Scholar]
- Shimamura M, Sato N, Sata M, Wakayama K, Ogihara T, Morishita R. Expression of hepatocyte growth factor and c-Met after spinal cord injury in rats. Brain Res. 2007;1151:188–194. doi: 10.1016/j.brainres.2007.03.022. [DOI] [PubMed] [Google Scholar]
- Staiger JF, Nurnberger F. The efferent connections of the lateral septal nucleus in the guinea pig: intrinsic connectivity of the septum and projections to other telencephalic areas. Cell Tissue Res. 1991;264:415–426. doi: 10.1007/BF00319032. [DOI] [PubMed] [Google Scholar]
- Stanfield BB, O’Leary DD, Fricks C. Selective collateral elimination in early postnatal development restricts cortical distribution of rat pyramidal tract neurones. Nature. 1982;298:371–373. doi: 10.1038/298371a0. [DOI] [PubMed] [Google Scholar]
- Stanfield BB, Nahin BR, O’Leary DD. A transient postmamillary component of the rat fornix during development: implications for interspecific differences in mature axonal projections. J Neurosci. 1987;7:3350–3361. doi: 10.1523/JNEUROSCI.07-10-03350.1987. [DOI] [PMC free article] [PubMed] [Google Scholar]
- Steward O, Scoville SA. Cells of origin of entorhinal cortical afferents to the hippocampus and fascia dentata of the rat. J Comp Neurol. 1976;169:347–370. doi: 10.1002/cne.901690306. [DOI] [PubMed] [Google Scholar]
- Su W, Xing R, Guha A, Gutmann DH, Sherman LS. Mice with GFAP-targeted loss of neurofibromin demonstrate increased axonal MET expression with aging. Glia. 2007;55:723–733. doi: 10.1002/glia.20501. [DOI] [PubMed] [Google Scholar]
- Sun W, Funakoshi H, Nakamura T. Localization and functional role of hepatocyte growth factor (HGF) and its receptor c-met in the rat developing cerebral cortex. Brain Res Mol Brain Res. 2002;103:36–48. doi: 10.1016/s0169-328x(02)00168-7. [DOI] [PubMed] [Google Scholar]
- Swanson LW, Cowan WM. An autoradiographic study of the organization of the efferent connections of the hippocampal formation in the rat. J Comp Neurol. 1977;172:49–84. doi: 10.1002/cne.901720104. [DOI] [PubMed] [Google Scholar]
- Swanson LW, Wyss JM, Cowan WM. An autoradiographic study of the organization of intrahippocampal association pathways in the rat. J Comp Neurol. 1978;181:681–715. doi: 10.1002/cne.901810402. [DOI] [PubMed] [Google Scholar]
- Swanson LW, Cowan WM. The connections of the septal region in the rat. J Comp Neurol. 1979;186:621–655. doi: 10.1002/cne.901860408. [DOI] [PubMed] [Google Scholar]
- Szinyei C, Heinbockel T, Montagne J, Pape HC. Putative cortical and thalamic inputs elicit convergent excitation in a population of GABAergic interneurons of the lateral amygdala. J Neurosci. 2000;20:8909–8915. doi: 10.1523/JNEUROSCI.20-23-08909.2000. [DOI] [PMC free article] [PubMed] [Google Scholar]
- Tanaka Y, Yamada K, Zhou CJ, Ban N, Shioda S, Inagaki N. Temporal and spatial profiles of ABCA2-expressing oligodendrocytes in the developing rat brain. J Comp Neurol. 2003;455:353–367. doi: 10.1002/cne.10493. [DOI] [PubMed] [Google Scholar]
- Tepper JM, Trent F. In vivo studies of the postnatal development of rat neostriatal neurons. Prog Brain Res. 1993;99:35–50. doi: 10.1016/s0079-6123(08)61337-0. [DOI] [PubMed] [Google Scholar]
- Tepper JM, Sharpe NA, Koos TZ, Trent F. Postnatal development of the rat neostriatum: electrophysiological, light- and electron-microscopic studies. Dev Neurosci. 1998;20:125–145. doi: 10.1159/000017308. [DOI] [PubMed] [Google Scholar]
- Thewke DP, Seeds NW. The expression of mRNAs for hepatocyte growth factor/scatter factor, its receptor c-met, and one of its activators tissue-type plasminogen activator show a systematic relationship in the developing and adult cerebral cortex and hippocampus. Brain Res. 1999;821:356–367. doi: 10.1016/s0006-8993(99)01115-4. [DOI] [PubMed] [Google Scholar]
- Tyndall SJ, Walikonis RS. The receptor tyrosine kinase Met and its ligand hepatocyte growth factor are clustered at excitatory synapses and can enhance clustering of synaptic proteins. Cell Cycle. 2006;5:1560–1568. doi: 10.4161/cc.5.14.2918. [DOI] [PubMed] [Google Scholar]
- Tyndall SJ, Patel SJ, Walikonis RS. Hepatocyte growth factor-induced enhancement of dendritic branching is blocked by inhibitors of N-methyl-D-aspartate receptors and calcium/calmodulin-dependent kinases. J Neurosci Res. 2007;85:2343–2351. doi: 10.1002/jnr.21390. [DOI] [PubMed] [Google Scholar]
- van Groen T, Kadish I, Wyss JM. Species differences in the projections from the entorhinal cortex to the hippocampus. Brain Res Bull. 2002;57:553–556. doi: 10.1016/s0361-9230(01)00683-9. [DOI] [PubMed] [Google Scholar]
- Vincze A, Mazlo M, Seress L, Komoly S, Abraham H. A correlative light and electron microscopic study of postnatal myelination in the murine corpus callosum. Int J Dev Neurosci. 2008 doi: 10.1016/j.ijdevneu.2008.05.003. [DOI] [PubMed] [Google Scholar]
- Watanabe K, Kawana E. A horseradish peroxidase study on the mammillothalamic tract in the rat. Acta Anat (Basel) 1980;108:394–401. doi: 10.1159/000145322. [DOI] [PubMed] [Google Scholar]
- Weisskopf MG, LeDoux JE. Distinct populations of NMDA receptors at subcortical and cortical inputs to principal cells of the lateral amygdala. Journal of neurophysiology. 1999;81:930–934. doi: 10.1152/jn.1999.81.2.930. [DOI] [PubMed] [Google Scholar]
- White LE., Jr Ipsilateral afferents to the hippocampal formation in the albino rat. I. Cingulum projections. J Comp Neurol. 1959;113:1–41. doi: 10.1002/cne.901130102. [DOI] [PubMed] [Google Scholar]
- Wilson CJ, Phelan KD. Dual topographic representation of neostriatum in the globus pallidus of rats. Brain Res. 1982;243:354–359. doi: 10.1016/0006-8993(82)90260-8. [DOI] [PubMed] [Google Scholar]
- Yan H, Rivkees SA. Hepatocyte growth factor stimulates the proliferation and migration of oligodendrocyte precursor cells. J Neurosci Res. 2002;69:597–606. doi: 10.1002/jnr.10323. [DOI] [PubMed] [Google Scholar]
- Yonan AL, Alarcon M, Cheng R, Magnusson PK, Spence SJ, Palmer AA, Grunn A, Juo SH, Terwilliger JD, Liu J, Cantor RM, Geschwind DH, Gilliam TC. A genomewide screen of 345 families for autism-susceptibility loci. American journal of human genetics. 2003;73:886–897. doi: 10.1086/378778. [DOI] [PMC free article] [PubMed] [Google Scholar]
- Zhang L, Himi T, Morita I, Murota S. Hepatocyte growth factor protects cultured rat cerebellar granule neurons from apoptosis via the phosphatidylinositol-3 kinase/Akt pathway. J Neurosci Res. 2000;59:489–496. doi: 10.1002/(SICI)1097-4547(20000215)59:4<489::AID-JNR3>3.0.CO;2-9. [DOI] [PubMed] [Google Scholar]
Associated Data
This section collects any data citations, data availability statements, or supplementary materials included in this article.