

Abstract
In non-neuronal cells, inactivation of protein kinase D (PKD) blocks fission of trans-Golgi network (TGN) transport carriers, inducing the appearance of long tubules filled with cargo. We now report on the function of PKD1 in neuronal protein trafficking. In cultured hippocampal pyramidal cells, the transferrin receptor (TfR) and the low-density receptor-related protein (LRP) are predominantly transported to dendrites and excluded from axons. Expression of kinase-inactive PKD1 or its depletion by RNA interference treatment dramatically and selectively alter the intracellular trafficking and membrane delivery of TfR- and LRP-containing vesicles, without inhibiting exit from the TGN or inducing Golgi tubulation. After PKD1 suppression, dendritic membrane proteins are mispackaged into carriers that transport VAMP2; these vesicles are distributed to both axons and dendrites, but are rapidly endocytosed from dendrites and preferentially delivered to the axonal membrane. A kinase-defective mutant of PKD1 lacking the ability to bind diacylglycerol and hence its Golgi localization does not cause missorting of TfR or LRP. These results suggest that in neurons PKD1 regulates TGN-derived sorting of dendritic proteins and hence has a role in neuronal polarity.
Keywords: PKD1, Golgi apparatus, vesicles, sorting, dendritic membrane proteins, neurons
Introduction
Protein kinase D1 (PKD1) is a member of a family of diacylglycerol (DAG)-binding Ser/Thr kinases (Nishikawa et al., 1997; Rykx et al., 2003; Rozengurt et al., 1995). PKDs can be activated by different stimuli through a PKC-dependent pathway (Matthews et al., 1999, 2000; Rykx et al., 2003). They have been implicated in diverse cellular functions, including regulation of signaling pathways (Bagowski et al., 1999; Hurd et al., 2002; Van Lint et al., 2002), cell survival (Endo et al., 2000; Waldron and Rozengurt, 2000; Storz and Toker, 2003), tumor invasion (Bowden et al., 1999), and immune responses (Sidorenko et al., 1996).
Recent studies have involved PKD1–3 in the regulation of Golgi organization (Jamora et al., 1999; Baron and Malhotra, 2002; Van Lint et al., 2002) and plasma membrane-directed transport (Liljedahl et al., 2001; Baron and Malhotra, 2002; Prigozhina and Waterman-Storer, 2004). PKD1–3 binds primarily to the trans-Golgi network (TGN) in a DAG-dependent manner (Maeda et al., 2001; Baron and Malhotra, 2002), and PKD bound to the TGN is activated by PKCη (Díaz Añel and Malhotra, 2005). Overexpression of PKD kinase-defective mutants inhibit a membrane fission pathway involved in the transport of cargo carrying basolateral sorting signals in MDCK cells (Yeaman et al., 2004). The cargo-containing carriers fail to detach from the TGN and grow into large tubules (Liljedahl et al., 2001; Díaz Añel and Malhotra, 2005). Overexpression of PKCη overactivates the fission reaction leading to Golgi fragmentation, and this process is inhibited by expression of PKD1-kinase dead (Díaz Añel and Malhotra, 2005). These results provide evidence suggesting that PKD-dependent fission activity regulates the formation of TGN to cell surface-specific transport carriers.
Neurons are highly polarized cells typically extending several short, thick tapering dendrites and one functional distinct long thin axon. Consistent with this, many membrane proteins are preferentially distributed either to axons or dendrites, and neurons use different mechanisms to achieve this goal. Thus, molecular selectivity mechanisms could act at different steps of the membrane trafficking pathway to control protein targeting (Shah and Goldstein, 2000; Sampo et al., 2003; Hirokawa and Takemura, 2005). The identification of proteins and/or signaling pathways controlling these “steps” is therefore of key importance for understanding neuronal polarity.
We have analyzed the involvement of PKD1 in regulating trafficking of neuronal membrane proteins. Specifically, our results show that depleting PKD1 and/or reducing its activity dramatically and selectively alters the intracellular trafficking and membrane delivery of two dendritic membrane proteins, namely the transferrin receptor and the low-density receptor-related protein (Jareb and Banker, 1998; Burack et al., 2000; Marzolo et al., 2003; this study). In control cells, both proteins are selectively delivered to the dendritic plasma membrane, but excluded from axons. In contrast, after PKD1 suppression/inactivation, transferrin receptor (TfR) and low-density receptor-related protein (LRP) traffic to both axons and dendrites in vesicles containing the axonal membrane protein VAMP2. Interestingly, these vesicles are delivered to the surface of axons and dendrites, but rapidly endocytosed from dendrites and retained at the axonal membrane. Thus, by regulating the biogenesis of TGN-derived dendritic vesicles, rather than exit or fission from the TGN, PKD1 has a key role in neuronal polarity.
Materials and Methods
DNA constructs.
The PKD1 short hairpin RNA (shRNA) plasmid was constructed in pBS/U6 vector. 5′-GGTTCTGGACAGTTCGGAATAAGCTTATTCCGAACTGTCCAGAACCCTTTTTTG and 5′-AATTCAAAAAGGGTTCTGGACAGTTCGGAATAAGCTTATTCCGAACTGTCCAGAACC were used as targeting sequences following the procedures described by Chuang et al. (2005). The scrambled control shRNA plasmid was purchased from Ambion. The DNA fragments containing U6-PKD1-si and U6-control-si were inserted into pCAGIG vector in which the green fluorescent protein (GFP)-cDNA is under the control of chick actin-minimal CMV (CAG) promoter; the resulting plasmids were referred to as sh-PKD1-GFP and sh-control-GFP, respectively. For reverse transcription (RT)-PCR, RNA was isolated from hippocampal cells cultures, and PKD1, PKD2, and PKD3 transcripts were amplified using the following primers: forward (PKDF), 5′-gacttccagatccg-3′; reverse (PKD1), 5′-cctcttctcacggccg-3′; reverse (PKD2), 5′-ggccttgcctccctcg-3′; and reverse (PKD3), 5′-caggattatgagagctgc-3′. The construction of plasmids encoding glutathione S-transferase (GST)-PKD1-wild type (WT), -kinase dead (KD), or -constitutively active (CA), or the P155G mutant, hemagglutinin (HA)-mLRP4, and galactosyl-transferase T2 fused to GFP (GalT2-GFP) has been described previously (Matthews et al., 1999; Maeda et al., 2001; Marzolo et al., 2003; Rosso et al., 2004). PKD1-WT S916A and PKD1-KD S916E were constructed as described by Sánchez-Ruiloba et al. (2006). TfR-GFP and VAMP2-GFP cDNAs were generous gifts from Dr. A. Gonzalez (Universidad Catolica Chile, Santiago, Chile) and Dr. Thierry Galli (Inserm, Institut Jacob Monod, Paris, France), respectively.
Culture, transfection, and immunofluorescence.
Neuronal cultures from embryonic rat hippocampi were prepared as described previously (Kunda et al., 2001; Rosso et al., 2004; Chuang et al., 2005). Neurons [>7 d in vitro (d.i.v.)] with long axons and well developed dendritic arbors (stage 4) were used for all experiments. Transient transfection of cultured neurons was performed as described previously (Kunda et al., 2001; Rosso et al., 2004; Chuang et al., 2005), and the constructs used at a concentration of 2 μg/μl unless otherwise stated. Neurons were fixed with 4% paraformaldehyde in 4% sucrose-containing PBS and permeabilized in 0.2% Triton X-100 in PBS for 5 min before antibody incubation; to visualize surface staining of membrane proteins, fixed cells were incubated with primary antibodies before detergent extraction. The following primary antibodies were used in this study: a monoclonal antibody (mAb) against tau protein (clone Tau-1) diluted 1:100; an mAb against MAP2 (clone AP-20), an mAb against β-tubulin, an affinity-purified rabbit polyclonal antibody raised against PKD1 (Santa Cruz Biotechnology) diluted 1:100 or 1:500; an mAb against GM130, a marker of the cis-Golgi compartment (BD Biosciences) diluted 1:250; a rabbit polyclonal antibody or a mouse mAb against HA (Santa Cruz Biotechnology) diluted 1:800 for immunofluorescence and 1:50 for in vivo labeling; a rabbit polyclonal antibody against GST (Santa Cruz Biotechnology); and a rabbit polyclonal antibody against GFP (Santa Cruz Biotechnology) diluted 1:400 for immunofluorescence and 1:40 for in vivo labeling. Cells were visualized using either a conventional (Zeiss Pascal) or a spectral (Olympus Fluoview 1000) inverted confocal microscope. Images were processed using Adobe Photoshop.
Time-lapse videomicroscopy, quantitative fluorescence, and total internal reflection fluorescence microscopy.
For time-lapse fluorescence microscopy and total internal reflection fluorescence microscopy (TIRFM), transfected cells were cultured in special Petri dishes (Paglini et al., 1998). At different time points after transfection, the dishes containing the attached cells were placed on a Harvard microincubator located on top of the stage of a fully motorized Nikon TE-2000 E inverted microscope equipped for differential interference contrast, epifluorescence, and TIRFM. For conventional time-lapse fluorescence microscopy, cells were imaged using a 60× or a 100× oil-immersion objective, an ORCA II ER camera, and MetaMorph software (Rosso et al., 2004). For some experiments, the relative intensities of HA-tagged mLRP4, GFP-TfR, L1-yellow fluorescent protein (YFP), VAMP2-GFP, anti-GFP, MAP2, or tau fluorescence in axons and dendrites were quantitated in fixed permeabilized or nonpermeabilized cells (Paglini et al., 1998), and a polarity index was calculated using MetaMorph software as described previously (Wisco et al., 2003; Silverman et al., 2005; Chung et al., 2006). First, an average background fluorescence value was determined from several regions containing unlabeled neurites and then subtracted from the whole image. To quantify the fluorescence in axons and dendrites, several one-pixel-wide 100 μm lines were drawn on randomly selected portions of the axon and the dendrites (6–10 lines each) using the MAP2 or tau signals as a guide, and then these regions were transferred to the HA-mLRP4 or GFP-TfR fluorescence image, and the average fluorescence for each region was calculated. The dendrite/axon ratios for each construct were calculated from minimally 20 cells from at least three different cultures. The relative intensity of TfR-GFP or HA-mLRP4 fluorescence were also measured pixel by pixel in a region extending from the base to the tip of dendritic processes. In addition, intensity measurements were performed in 2 or 5 μm2 areas located within the cell body (Golgi region) and internal, medial, and distal dendritic segments. Statistical significance was assessed using the Newman–Keuls multiple-comparisons test for independent groups. Measurements of the relative intensity of PKD staining (Ab dilution 1:200) were performed in a 5 μm2 area located within the cell body of control and transfected neurons.
We used TIRFM to image single vesicular insertion events under low intensity and superficial light exposure conditions that minimize phototoxicity (Yudowski et al., 2006). Cells were visualized with a 60× 1.45 numerical aperture (NA) objective, equipped for through-the-objective TIRF illumination using a 488 nm argon laser. Neurons were imaged in Neurobasal medium supplemented with 30 mm HEPES buffer, pH 7.2, and maintained at 37C. Time-lapse sequences were acquired at a continuous rate of 2 or 5 frames/s during 3–5 min using an ORCA II-ER (Hamamatsu) camera and MetaMorph software (Molecular Devices). Pyramidal neurons were selected by morphological criteria (in wide-field images) before imaging in TIRFM mode. Live images shown represent raw data with simple background subtraction of the averaged blank field intensity. Fusion events were detected semiautomatically using maximum pixel intensity and centroid analysis to define sites of insertion (Yudowski et al., 2006).
Morphometry.
Dendritic (MAP2+ neurites) shape parameters were measured with the morphometric menu of MetaMorph as described previously (Szebenyi et al., 2005). Montages showing the complete neuronal arbor of transfected neurons were created from confocal images (maximal projections) acquired through a 63× 1.4 NA oil objective lens and measured from a video screen using MetaMorph.
Western blot.
Changes in the levels of PKD1 during neuronal development or after RNA interference (RNAi) treatment in CHO cells or cultured hippocampal pyramidal neurons were analyzed by Western blotting as described previously (Chuang et al., 2005). Densitometry of Western blots were performed using Scion Image software.
Results
PKD1 is predominantly expressed in cultured hippocampal cells
The experiments described in this study were performed using neuronal cultures prepared from the embryonic hippocampus, because this model system has been extensively used for studies of neuronal membrane protein trafficking (Craig and Banker, 1994; Horton and Ehlers, 2003). Most PKD studies have been performed in non-neuronal cells, and therefore the isoform(s) expressed by neurons are largely unknown. We used RT-PCR to show that cultured hippocampal pyramidal neurons express predominantly PKD1, to a much lesser extent PKD3, and no PKD2 (Fig. 1A); this is slightly different from primary cortical neurons that express all PKD isoforms, or from PC12 cells that express PKD1 and PKD2, but not PKD3 (Sánchez-Ruiloba et al., 2006). Western blot analysis revealed no major changes in PKD1 protein levels with neuronal maturation (Fig. 1B), and immunofluorescence that is localized throughout the cytoplasm but is enriched in the perinuclear region, presumably the Golgi apparatus (Fig. 1C,D). Ectopically expressed GST-PKD1 also localizes to a perinuclear compartment that colocalizes with cotransfected GalT2-GFP, a resident glycosyl-transferase of the TGN; however, whereas GalT2-GFP precisely delineates Golgi cisternae, the pattern of distribution of GST-tagged PKD1 was more diffuse, localizing within and around the Golgi region (Fig. 1E,F).
Figure 1.
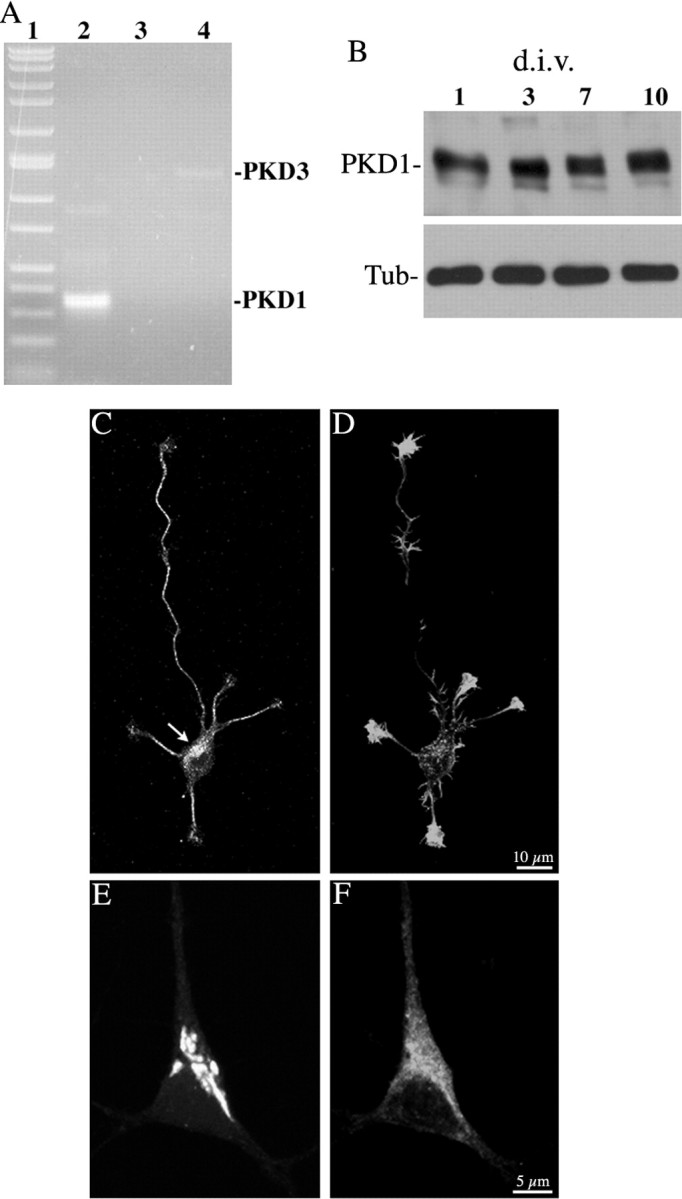
A, RT-PCR analysis monitoring PKD1 (lane 2), PKD2 (lane 3), and PKD3 (lane 4) expression on RNA extracts obtained from 7 d.i.v. hippocampal cell cultures. Lane 1 represents molecular weight markers. B, Western blot showing PKD1 and β-tubulin expression in cell extracts obtained at 1, 3, 7, and 10 d.i.v. Ten micrograms of total cellular protein were loaded in each lane. C, D, Confocal images showing the distribution of endogenous PKD1 (C) and F-actin (D) in a stage 3 cultured hippocampal pyramidal neuron. Note the prominent PKD1 staining of the Golgi region (C, arrow). The culture was fixed 30 h after plating and stained with the PKD1 antibody used at a dilution of 1:250. E, F, High-power confocal micrographs showing the distribution of ectopically expressed GalT2-GFP (E) and GST-PKD1-KD (F) in a hippocampal pyramidal neuron.
Expression of PKD1-KD in neurons does not induce Golgi tubulation or accumulation of TfR-GFP at the Golgi apparatus
To assess the function of PKD1 in neuronal protein trafficking, we decided to analyze two dendritic membrane proteins, namely TfR and LRP; selective sorting and delivery are responsible for the dendritic targeting of TfR (Burack et al., 2000) and LRP (Marzolo et al., 2003; this study). In addition, the same sorting signals governing their dendritic targeting mediate selective delivery to the basolateral surface in epithelial cells (Jareb and Banker, 1998; Nelson and Yeaman, 2001; Marzolo et al., 2003). This is potentially important, because PKDs have been implicated in the selective regulation of basolateral protein trafficking in polarized epithelial cells (Yeaman et al., 2004).
Because previous studies have shown that in non-neuronal cells, inhibition of PKD at the TGN blocks the anterograde membrane transport of the temperature-sensitive ts045 mutant of VSVG (vesicular stomatitis virus glycoprotein) fused to GFP (Prigozhina and Waterman-Storer, 2004; Yeaman et al., 2004), we first examined whether or not the anterograde membrane trafficking of TfR-GFP was reduced after expression of the kinase-inactive mutant (KD) of PKD1 (PKD1-KD). In control CHO cells (nontransfected or mock-transfected) or in equivalent ones expressing PKD1-WT (supplemental Fig. 1, available at www.jneurosci.org as supplemental material), TfR-GFP immunofluorescence was observed in vesicles trafficking throughout the cytoplasm, whereas in the ones expressing the KD mutant, most of the labeling was found in the Golgi region and in long tubules that emerge from it; these tubules were highly dynamic extending up to the cell periphery, but did not detach from the Golgi or fuse with the plasma membrane (supplemental Fig. 1, available at www.jneurosci.org as supplemental material). The effects of the PKD1-KD mutant were observed as soon as 4 h after transfection and with expression levels twofold to sixfold higher than those of control nontransfected cells. Therefore, in non-neuronal cells, inactivation of PKD1 inhibits exit of TfR from the TGN and induces Golgi tubulation.
In contrast, no such effects were observed in neurons. Thus, when Golgi morphology was analyzed with an antibody against GM130, a marker of the cis-Golgi, or after ectopic expression of GalT2-GFP, a marker of the TGN, no differences were detected between control (nontransfected) neurons and neurons transfected with PKD1-WT or their mutants, either PKD1-KD or PKD1-CA (Fig. 2). Control and PKD1-transfected neurons have a Golgi apparatus that localized to the cell center and displayed a compact morphology with a few elongated cisternae extending into the proximal region of a single dendritic-like neurite (Horton et al., 2005). No evidence of tubulation [formation and extension of Golgi-derived tubules (Rosso et al., 2004)] or fragmentation [formation of small vesicle-like structures containing Golgi markers (Díaz Añel and Malhotra, 2005)] was observed after expression of PKD1-KD or the CA mutant, respectively (Fig. 2A–L). Lack of Golgi alterations was not associated with low expression levels of the ectopic proteins, because measurements of PKD1 fluorescence intensity in transfected neurons revealed a threefold to sixfold increase with respect to the values detected in control nontransfected ones. We only observed Golgi fragmentation in a small percentage (<10%) of neurons expressing PKD1-CA at very high levels (more than an eightfold increase in PKD1 fluorescence intensity) (Fig. 2M,N). In addition, in neurons that express PKD1-KD, no accumulation of TfR-GFP or formation of TfR-GFP-containing tubules were detected in the region of the Golgi apparatus; TfR-GFP-containing vesicles were observed throughout the cytoplasm and neurites (supplemental Fig. 2A, available at www.jneurosci.org as supplemental material). To analyze in more detail this phenomenon, neurons were transfected with control plasmid, PKD1-WT, or PKD1-KD plus TfR-GFP, and fixed at different time points (4, 6, 8, and 12 h) after transfection; GFP fluorescence was measured in the Golgi region and along neurites. The results obtained showed no significant differences in the intensity of TfR-GFP fluorescence in the Golgi region or along neurites between control and cells expressing either PKD1-WT or KD (supplemental Fig. 2B, supplemental Table 1, available at www.jneurosci.org as supplemental material).
Figure 2.

A–F, Confocal images showing the morphology of the Golgi complex in neurons labeled with an antibody against the cis-Golgi marker GM-130 and transfected with GST-tagged PKD1-WT, -KD, or -CA. G–N, Equivalent images but from neurons cotransfected with GalT2-GFP. Note the normal morphology of the Golgi complex after expression of the PKD1 constructs. Also note that high expression levels of PKD1-CA result in Golgi vesiculation (M, N). For this experiment, neurons (8 d.i.v.) were transfected with Lipofectamine 2000 and analyzed by immunofluorescence 12–14 h later.
Expression of PKD1-KD in neurons alters the intracellular distribution of TfR and LRP
The data presented above suggest that in neurons PKD1 has not a major role in regulating exit of vesicles containing TfR from the Golgi apparatus. However, during the course of these experiments it became evident that expression of PKD1-KD induced a dramatic alteration in the intracellular distribution of TfR-GFP. As expected (Burack et al., 2000; Silverman et al., 2001), in control neurons TfR-GFP (cell surface and intracellular staining, represented by the GFP fluorescence) was restricted to dendrites (Fig. 3A–F). High-magnification confocal images revealed that TfR-GFP was associated with discrete vesicular or tubulovesicular organelles, some of which were localized in the vicinity of the plasma membrane. In contrast, when neurons were cotransfected with PKD1-KD, but not the WT construct, TfR-GFP was found not only in dendrites, but also in long MAP2− axons (Fig. 3G–I).
Figure 3.
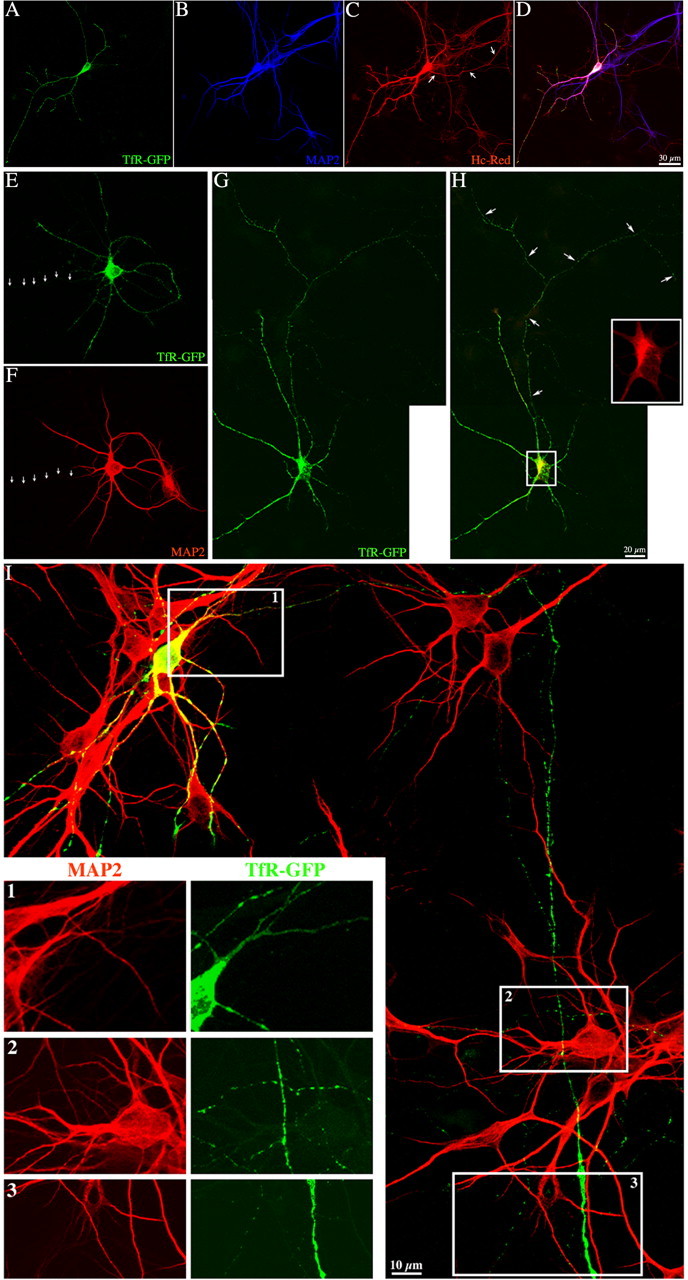
Expression of PKD1-KD alters the intracellular distribution of TfR-GFP. A–D, Confocal images showing the distribution of TfR-GFP and MAP2 in an 8 d.i.v. hippocampal pyramidal neuron cotransfected with Hc-Red. Note that the distribution of TfR-GFP mimics that of MAP2, whereas Hc-Red illuminates the entire neuritic arbor of the transfected cell; also note that the axon emerging from the cell body (C, arrows) is completely devoid of TfR-GFP and MAP2 labeling. E, F, Confocal images showing another example of the distribution of TfR-GFP. Note that in this case the axon (arrows) originates from a MAP2+ dendrite. G, Confocal image showing the distribution of TfR-GFP in an 8 d.i.v. hippocampal pyramidal neuron coexpressing GST-PKD1-KD. H, Merged image showing coexpression of TfR-GFP and GST-PKD1-KD (yellow). Inset (red), High-magnification view of the GST-staining in the Golgi region. Note that after coexpression of GST-PKD-KD, TfR-GFP localized to both dendrites and axon-like neurites (arrows). I, High-power confocal merged image showing that TfR-GFP (green) localizes to MAP2+ dendrites (red) and MAP2− axon-like neurites after coexpression of GST-PKD1-KD (data not shown). 1–3, High-magnification views of the boxes shown in I. Note the presence of TfR-GFP labeling in the MAP2− axon that arises from the transfected neuron.
Neurons were also transfected with HA-tagged mLRP4, an LRP minireceptor, containing cytoplasmic sequences similar to those responsible for the targeting of the LDLR (low-density lipoprotein receptor) or the TfR to the basolateral surface of polarized epithelial cells (Marzolo et al., 2003). After 12, 18, or 24 h after transfection, the overexpressed HA-mLRP4 localized to vesicular structures that distributed throughout the cell body and MAP2+ dendrites (supplemental Fig. 3A–C, available at www.jneurosci.org as supplemental material). Labeling was excluded from MAP2− axons arising either from the cell body or a primary dendrite (supplemental Fig. 3D–F, available at www.jneurosci.org as supplemental material), or from tau+ axon-like neurites (supplemental Fig. 3G–I, available at www.jneurosci.org as supplemental material). Labeling of fixed nonpermeabilized mLRP4-transfected neurons with the HA antibody (HA tag located at the N terminus of the fusion protein) revealed selective and prominent staining of the somatodendritic plasma membrane (supplemental Fig. 3J–L, available at www.jneurosci.org as supplemental material). Consistent with the preferential dendritic localization of HA-mLRP4, spectral confocal microscopy revealed that many HA-mLRP4-labeled vesicles colocalized with those containing TfR-GFP (supplemental Fig. 4, available at www.jneurosci.org as supplemental material).
Cotransfection with PKD1-KD altered the subcellular distribution of LRP. In these neurons, endogenous LRP (supplemental Fig. 5, available at www.jneurosci.org as supplemental material) or the ectopically expressed dendritic minireceptor (Fig. 4A–L) was found in the dendritic arbor and throughout the axon. Interestingly, expression of a mutant form of PKD1-KD (P155G) lacking the ability to bind DAG, and hence its Golgi localization (Matthews et al., 1999), did not alter the normal intracellular distribution of HA-mLRP4 (Fig. 4M–R) or TfR-GFP (data not shown).
Figure 4.
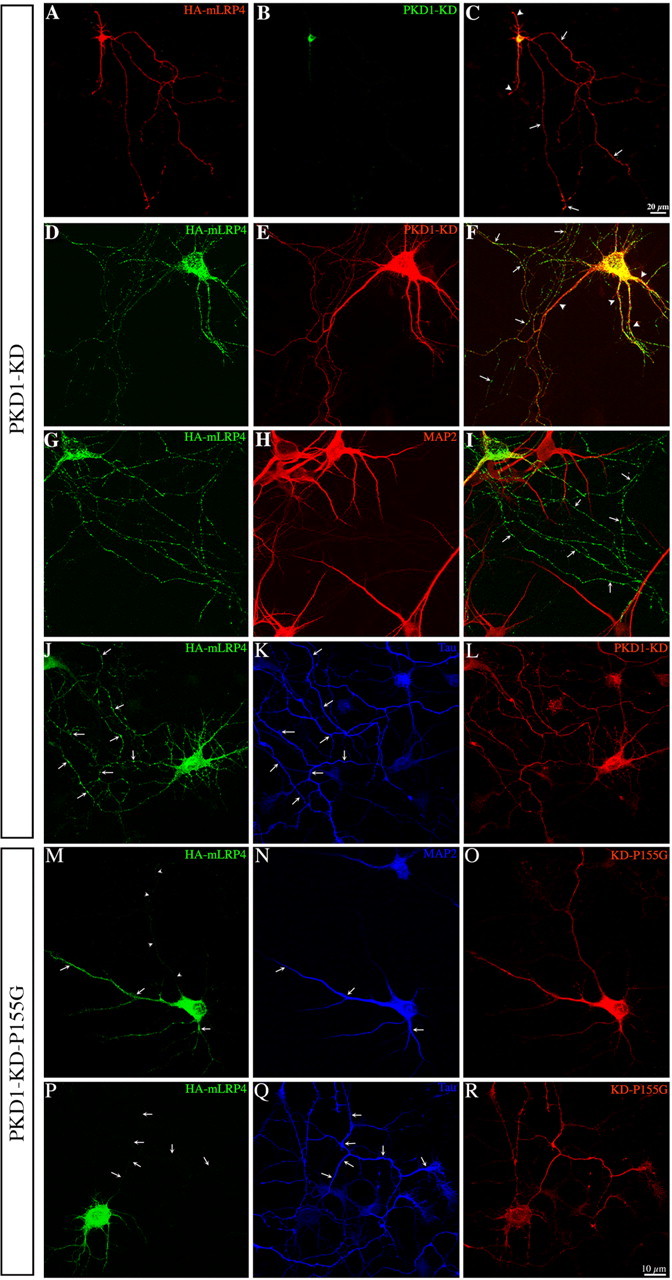
Expression of PKD1-KD alters the intracellular distribution of HA-mLRP4. A–C, Confocal images showing the intracellular distribution of HA-mLRP4 in a 7 d.i.v. neuron transfected with GST-tagged PKD1-KD; note that the HA staining localized to both long axon-like (arrows) and short dendritic-like (arrowheads) neurites. D, E, High-power confocal images showing the distribution of HA-mLRP4 in a neuron expressing GST-PKD1-KD. The image showing GST staining in E has been overexposed to visualize the whole extent of the neuritic arbor. F, Merged image showing that HA staining is found in both axon-like (arrows) and dendritic-like (arrowheads) processes. G, H, Confocal images showing the distribution of HA-mLRP4 and MAP2 in a neuron cotransfected with GST-PKD1-KD (data not shown). I, Merged image showing that HA staining is not only found in dendrites but also in MAP2− axons (arrows). J–L, Confocal images showing the distribution of HA-mLRP4 and Tau in a neuron cotransfected with GST-PKD1-KD. Note that HA staining is found in Tau1+ axons (arrows). M–O, Confocal images showing the distribution of HA-mLRP4 and MAP2 in a neuron cotransfected with a PKD1-KD mutant (P155G) that does not localize to the Golgi apparatus. Note that HA staining is only found in MAP2+ dendrites (arrows) but absent from the axon (arrowheads). P–R, Confocal images showing the distribution of HA-mLRP4 and Tau in a neuron cotransfected with the PKD1-KD mutant P155G (red). Note that HA staining is absent from Tau1+ axons (arrows).
Changes in the distribution of endogenous LRP or ectopic HA-mLRP4 or TfR-GFP were quantitated using a “polarity index” (PI) similar to that described in previous studies (Cheng et al., 2002, Sampo et al., 2003; Wisco et al., 2003; Chung et al., 2006) (for details, see Materials and Methods). Uniform staining gives a PI value close to 1, whereas dendritic enrichment gives a value >1, and axonal enrichment a PI value of <1. This analysis clearly revealed that expression of PKD1-KD induces missorting of LRP and TfR (Table 1). No alterations in the polarity index of axonal proteins such as L1 and VAMP2 were detected after expression of PKD1-KD; both proteins display a nonpolarized distribution localizing to axons and dendrites (Table 1; supplemental Fig. 6, available at www.jneurosci.org as supplemental material).
Table 1.
Quantification of polarity of dendritic and axonal proteins in control and PKD1-KD-transfected neurons
| Protein | Number of cells analyzed (n) | Polarity index | Fluorescence intensity |
|---|---|---|---|
| TfR-GFP | |||
| Control (nontransfected) | 25 | 10.75 ± 2.5 | 2930 ± 28 |
| PKD1-WT | 25 | 9.25 ± 0.5 | 2927 ± 21 |
| PKD1-WT (S916A) | 25 | 4.11 ± 0.2* | 2950 ± 45 |
| PKD1-KD | 25 | 1.11 ± 0.1* | 2842 ± 86 |
| PKD1-KD (P155 G) | 25 | 10.60 ± 1.8 | 3045 ± 65 |
| PKD1-KD (S916E) | 25 | 5.47 ± 0.1* | 3028 ± 62 |
| LRP (endogenous) | |||
| Control (nontransfected) | 25 | 10.6 ± 2.2 | 864 ± 48 |
| PKD1-KD | 25 | 1.38 ± 0.3* | 935 ± 20 |
| PKD1-KD (P155 G) | 25 | 8.8 ± 1.4 | 880 ± 40 |
| shRNA PKD1 | 25 | 1.45 ± 0.5* | 1025 ± 65 |
| Scrambled-shRNA PKD1 | 25 | 10.8 ± 0.6 | 940 ± 30 |
| GFP-VAMP2 | |||
| Control (nontransfected) | 20 | 1.25 ± 0.2 | 2450 ± 110 |
| PKD1-KD | 20 | 1.36 ± 0.4 | 2480 ± 80 |
| L1-YFP | |||
| Control (nontransfected) | 20 | 1.15 ± 0.2 | 860 ± 20 |
| PKD1-KD | 20 | 1.20 ± 0.7 | 886 ± 24 |
| MAP2 | |||
| Control (nontransfected) | 42 | 16.9 ± 0.8 | 1250 ± 15 |
| PKD1-KD | 42 | 18.2 ± 0.6 | 1265 ± 35 |
| Tau | |||
| Control (nontransfected) | 36 | 0.17 ± 0.04 | 466 ± 24 |
| PKD1-KD | 36 | 0.13 ± 0.03 | 480 ± 42 |
Values are mean ± SEM.
*Significantly different from the corresponding control group (p < 0.05). Polarity index was calculated as described in Materials and Methods by dividing the dendritic by the axonal average fluorescence intensity expressed in pixels. A nonpolarized distribution gives a value close to 1. Fluorescence intensity values are expressed in pixels; 14 bit images were used for this type of measurement. Fluorescent intensity measurements of TfR-GFP, endogenous LRP, GFP-VAMP2, L1-YFP, MAP2, or Tau were performed in the cell body of control and transfected neurons. At least 20 cells from three different cultures were analyzed for each experimental condition.
Previous studies have shown that Kidins220, an ankyrin-rich membrane-spanning neuronal protein, is a substrate of PKD1 (Iglesias et al., 2000). More recently, these authors have demonstrated that autophosphorylation of Ser916 at position −2 within a PDZ-type I binding motif present at the C terminus (last 8 aa) of PKD1 and PKD2, but absent in PKD3, is required for the Golgi exit of Kidins220 (Sánchez-Ruiloba et al., 2006). Based on these observations, a model was proposed in which autophosphorylation or transphosphorylation of Ser916 releases an interaction between PKD1 and PDZ proteins, therefore promoting Kidins220 trafficking to the plasma membrane (Sánchez-Ruiloba et al., 2006). Because by binding PDZ ligands, PDZ proteins play crucial roles in cell polarization and intracellular trafficking (Roh and Margolis, 2003; Haucke, 2006), it became of interest to explore the distribution of TfR and LRP after expression of PKD1-WT or -KD carrying mutations of Ser916. For PKD1-WT, Ser916 was replaced for alanine, generating a mutant (PKD1-WT S916A) that cannot get phosphorylated and therefore prevents Kidins220 exit from the Golgi; in the case of PKD1-KD, Ser916 was replaced by glutamic acid (PKD1-KD S916E), thus mimicking an active form capable of promoting Kidins220 transport. Interestingly, mutating these motifs in both PKD1-WT and -KD significantly reduced but did not abolish the preferential dendritic localization of TfR or LRP (supplemental Fig. 7, available at www.jneurosci.org as supplemental material; Table 1), suggesting that PKD1 generates additional signals for dendritic targeting.
It should be noted that alterations in the polarity index of dendritic membrane proteins after expression of PKD1 mutants were not paralleled by modifications in dendritic morphology (e.g., total dendritic length, length of the major apical dendrite, or number of branches), at least during the first day after transfection. At later time points (supplemental Table 2, available at www.jneurosci.org as supplemental material), a reduction in dendritic length and branching became evident.
RNAi suppression of PKD1 causes missorting of LRP
To further test the involvement of PKD1 in the trafficking of dendritic membrane proteins, we generated a plasmid harboring both a PKD1 hairpin RNAi and a GFP cDNA (i.e., sh-PKD1-GFP) (Chuang et al., 2005). The silencing effect of this plasmid was confirmed by Western blotting of CHO cells and primary neuronal cultures (supplemental Fig. 8A, available at www.jneurosci.org as supplemental material). When neurons were transfected with sh-PKD1-GFP at 7 d.i.v. and examined 18 h later, almost all GFP+ neurons had specific reduction of PKD1 immunofluorescence (supplemental Fig. 8B–E, available at www.jneurosci.org as supplemental material), but not of tubulin or MAP2 labeling. Importantly, the majority of the sh-PKD1-GFP-targeted neurons failed to correctly sort HA-mLRP4 to the dendritic compartment, with the ectopic protein localizing to both axons and dendrites (supplemental Fig. 8F–H, available at www.jneurosci.org as supplemental material). We then tested whether expression of PKD1-KD or sh-PKD1-GFP altered the delivery of HA-mLRP4 to the plasma membrane. Surprisingly, under both conditions cell surface HA (Fig. 5A–I) was not detected in the somatodendritic membrane, but polarized to the distal end of axonal processes, including their growth cones, the site at which axonal membrane proteins are preferentially added (Craig et al., 1995; Pfenninger et al., 2003). Interestingly, neither of these treatments changes the surface distribution of the axonal membrane proteins L1 (supplemental Fig. 6G,H, available at www.jneurosci.org as supplemental material) or VAMP2 (data not shown).
Figure 5.
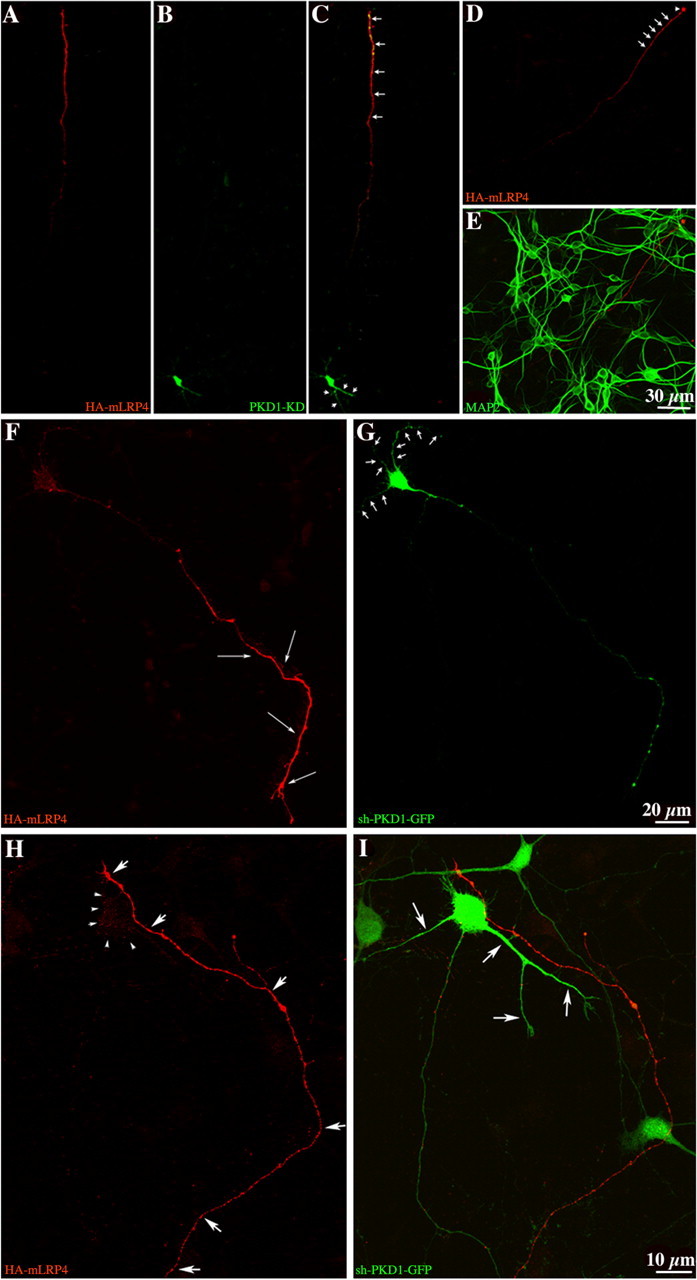
Expression of PKD1-KD or shRNA suppression of PKD1 alters the surface distribution of HA-mLRP4. A–C, Confocal images showing the surface distribution of HA-mLRP4 in a 7 d.i.v. neuron transfected with GST-tagged PKD1-KD; note that most of the HA staining localized to the distal end of the axon (C, arrows). D, E, Confocal images showing the distribution of surface HA-mLRP4 and intracellular MAP2. Note that the HA+ neurite (arrows) and its growth cone (arrowhead) do not stain for MAP2; the cell body of the transfected neuron is out of the field of focus. F, G, Confocal images showing the surface distribution of HA-mLRP4 in a 7 d.i.v. neuron transfected with the sh-PKD1-GFP. Note the intense labeling of the axonal surface (long arrows in F) and the absence of dendritic (G, arrows) staining. H, I, High-power confocal images showing the lack of somatodendritic HA surface staining (H, arrowheads; I, long arrows) in a neuron coexpressing HA-mLRP4 and the sh-PKD1-GFP. Note that the distal end of the axon from the cotransfected neuron has prominent HA staining (H, short arrows). For all these experiments, fixed cultures were labeled with the HA antibody before detergent extraction.
PKD1 inactivation/suppression causes mispackaging of TfR/LRP into VAMP2-containing vesicles
Together, our results showed that after PKD1 inactivation/suppression, the intracellular and membrane distribution of LRP and TfR resembled that of axonal membrane proteins, such as VAMP2, L1, or voltage-gated potassium channels. Thus, axonal proteins are sorted into carriers that travel to axons and dendrites, delivered to the surface of both types of neurites, but rapidly and preferentially endocytosed from the dendritic membrane (Sampo et al., 2003; Wisco et al., 2003; Chung et al., 2006; Yap et al., 2008). Therefore, it became of interest to evaluate whether this mechanism may account for the abnormal membrane distribution of TfR or LRP in neurons with reduced levels/activity of PKD1.
To this end, we first used TIRFM to evaluate whether or not expression of PKD1-KD alters the fusion of TfR-GFP-containing vesicles with the somatodendritic plasma membrane. TfR-GFP-expressing pyramidal neurons, selected using wide-field epifluorescence, were imaged with TIRFM. TfR-GFP fusion events differed in the morphology of the carrier [vesicular or tubular, “comet-like” (Kreitzer et al., 2003)] that fuses with the plasma membrane and on the persistence of the fusion spot (“splash”) in the plasma membrane. Fusion events lasting <500 ms were considered transient, whereas those persisting >5 s were referred as persistent. Under our experimental conditions, most of the fusion events lasted for >5 s and therefore were considered as persistent. Examples of different types of fusion events are shown in Figure 6. The estimated frequency of persistent insertion events was 5.8 ± 0.2 min−1 · cell−1 (n = 15) for control cells and 7.6 ± 0.4 min−1 · cell−1 (n = 20) for neurons cotransfected with PKD1-KD. Also, the percentage of fusion events mediated by tubular (36 ± 8%) versus vesicular carriers was significantly higher in PKD1-KD transfected neurons than in control ones (12 ± 2%).
Figure 6.

Time-lapse TIRFM images showing examples of fusion events in hippocampal pyramidal neurons transfected with TfR-GFP plus PKD1-WT (top) or -KD (all other panels). The left images show low-magnification TIRFM views of the selected neurons; the insets correspond to the areas shown at high magnification in the time-series panels. Vesicles or tubules (“comet-like”) that undergo fusion are marked with arrows. Images were taken every 2 s, for at least 2 min.
This observation suggests that failure to detect TfR at the dendritic plasma membrane after PKD1 suppression/inactivation is not attributable to a lack of fusion events, but rather may reflect rapid endocytosis, as in the case of axonal proteins (Sampo et al., 2003; Wisco et al., 2003; Chung et al., 2006; Yap et al., 2008). To test this, living cells were exposed to primary antibodies at 37°C for different periods of time (5–60 min), then washed and fixed, and fluorescently labeled secondary antibodies were added either with or without permeabilization; the former method allows detection of proteins that have been endocytosed from the plasma membrane (Sampo et al., 2003). After 10 min of incubation with GFP antibody, PKD1-KD-expressing neurons that were permeabilized after exposure to antibody exhibited many highly fluorescent puncta within their dendrites, whereas control cells exhibited very few (Fig. 7A–F). A similar phenomenon was observed in neurons coexpressing HA-mLRP4 and PKD1-KD, but not in neurons expressing the PKD1-KD mutants P155G or S916E; interestingly, expression of PKD1-WT S916A resulted in rapid endocytosis of TfR or LRP4, as in the case of neurons expressing PKD1-KD. Quantitative fluorescent measurements confirm these qualitative observations (Fig. 7G,H), suggesting that inactivation of PKD1 at the Golgi apparatus results in enhanced endocytosis of dendritic membrane proteins. In accordance with this, quantification of TfR-GFP fluorescence intensity in nonpermeabilized cells incubated with the GFP antibody for 10 min revealed that expression of PKD1-KD dramatically reduces GFP surface fluorescence intensity (17 ± 6 pixels) with respect to the values detected in neurons transfected with PKD1-WT (152 ± 8 pixels). In addition, quantification of the surface polarity index revealed a dramatic enrichment of HA-LRP4 in axons after expression of PKD1-KD or PKD1-WT S916A, comparable to that of axonal proteins, such as VAMP2 or L1 (Table 2). Because VAMP2 axonal polarization also involves rapid dendritic endocytosis, we decided to examine whether after PKD1-KD expression LRP may colocalize with GFP-VAMP2-containing vesicles. Spectral confocal microscopy revealed that in control neurons, HA-mLRP4 and GFP-VAMP2 distributed to different populations of vesicles (Fig. 8A–C), but after expression of the kinase-inactive mutant they exhibit a high degree of colocalization (Fig. 8D–F). Quantitative measurements revealed that under control conditions (mock-transfected cells), the percentage of vesicles containing both markers was very low (6.3 ± 0.4), whereas after PKD1-KD expression this value rose to 63 ± 5%.
Figure 7.
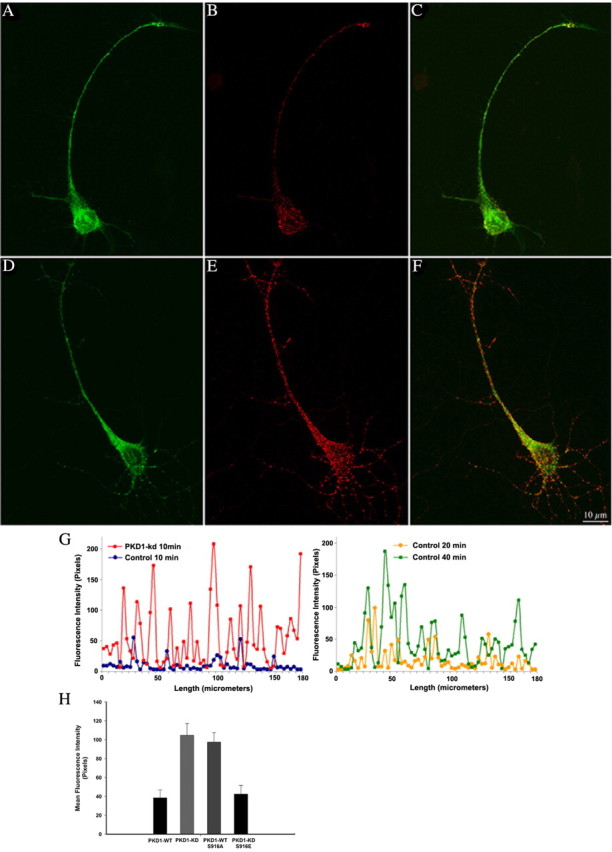
Antibody uptake as a measure of endocytosis. If endocytosis of the ectopic proteins occurs during exposure of living cells to antibodies in the culture medium, some antibodies will be trapped in endosomes. These trapped antibodies will be detected by fluorescence-labeled secondary antibodies only if membranes are permeabilized after fixation. A–F, Confocal images showing endocytosis of TfR-GFP from the dendritic cell surface. Cultures transfected with TfR-GFP plus PKD1-WT (A–C) or -KD (D–F) were exposed to antibodies against the extracellular fluorescent protein tag for 10 min at 37°C before fixation. Note the numerous, brightly fluorescent puncta detected in the dendrite of the PKD1-KD-expressing neuron. In contrast, very few endocytic puncta are detected after expression of PKD1-WT. For this experiment, neurons (8 d.i.v.) were transfected and exposed to the GFP antibody 15–18 h later. G, Graphs showing quantification of GFP-antibody uptake in control nontransfected neurons or PKD1-KD-expressing neurons. Living neurons were exposed to primary antibody for 10, 20, or 40 min. For this experiment, the relative intensity of GFP fluorescence was measured pixel by pixel in a region extending from the base to the tip of dendritic processes. H, Bars showing anti-GFP average fluorescence intensities along dendritic segments (100 μm in length) from neurons transfected with PKD1-WT, -KD, -WT S916A, and -KD S916E. Ten cells (∼50–60 dendritic segments) were measured for each experimental condition. Note the increase in antibody uptake (10 min exposure) in neurons expressing PKD1-KD and PKD1-WT S916A. Error bars represent SEM.
Table 2.
Quantification of cell surface polarity index of dendritic and axonal proteins in hippocampal neurons transfected with PKD1 and its mutants
| Protein | Number of cells analyzed (n) | Polarity index |
|---|---|---|
| mLRP4-HA | ||
| PKD1-WT | 20 | 11.91 ± 0.9 |
| PKD1-KD | 20 | 0.12 ± 0.02* |
| PKD1-WTS916A | 20 | 0.38 ± 0.08* |
| PKD1-KDS916E | 20 | 2.95 ± 0.35* |
| sh-PKD1-GFP | 20 | 0.14 ± 0.02* |
| Scrambled-shRNA PKD1 | 20 | 10.8 ± 0.6 |
| GFP-VAMP2 | ||
| PKD1-WT | 20 | 0.11 ± 0.06 |
| PKD1-KD | 20 | 0.12 ± 0.05 |
| L1-YFP | ||
| PKD1-WT | 20 | 0.14 ± 0.04 |
| PKD1-KD | 20 | 0.16 ± 0.04 |
Values are mean ± SEM.
*Significantly different from the corresponding control group (p < 0.05). Polarity index was calculated as described in Materials and Methods by dividing dendritic by axonal cell surface average fluorescence intensity expressed in pixels. A nonpolarized distribution gives a value close to 1. Twenty cells from three different cultures were analyzed for each experimental condition.
Figure 8.

A–F, Spectral confocal images showing the distribution of HA-mLRP4 and VAMP2-GFP in hippocampal neurons coexpressing PKD1-WT (A–C) or KD (D–F). Note the extensive colocalization of HA- and GFP-labeled vesicles after expression of the kinase-inactive mutant (F, yellow arrows); very little colocalization is observed in the neuron that coexpresses PKD1-WT (C, red and green arrows).
Discussion
RNAi suppression or expression of kinase-inactive forms of PKD1–3 are reported to inhibit membrane trafficking in different non-neuronal cells, including HeLa (Yeaman et al., 2004; Bossard et al., 2007), MDCK (Yeaman et al., 2004), fibroblasts (Prigozhina and Waterman-Storer, 2004), and CHO (this study). Because this phenomenon is paralleled by Golgi tubulation (Liljedahl et al., 2001; Prigozhina and Waterman-Storer, 2004; Bossard et al., 2007; this study), and because expression of constitutively active mutants of PKD 1–3 induces Golgi vesiculation/fragmentation, it has been proposed that PKD has a role in the regulation of fission of exocytic carriers from the TGN to the cell surface (Yeaman et al., 2004; Díaz Añel and Malhotra, 2005; Bossard et al., 2007).
In neurons, expression of a PKD1 kinase-defective mutant leads to inhibition of dendritic growth, an observation interpreted as suggestive for a role of PKD1 in controlling post-Golgi secretory trafficking (Horton et al., 2005). The results presented in this study show that PKD1, the major neuronal isoform present in cultured hippocampal neurons, is not crucially required for maintaining Golgi morphology or the exit of axonal (e.g., VAMP2) or dendritic membrane proteins (e.g., TfR and LRP) from the TGN. Thus, in contrast to what happens in non-neuronal cells, we failed to detect Golgi tubulation after depletion of PKD1 or Golgi vesiculation after expression of PKD1-CA in cultured neurons. This conclusion was based on the analysis of Golgi morphology or dynamics using markers for resident proteins, such as GM-130 (early Golgi) or GalT2-YFP (late Golgi), or Golgi-derived membrane proteins, such as TfR-GFP. Lack of these phenotypes suggests that in neurons PKD1 function is not primarily related with regulation of membrane fission. It is also unlikely that the absence of Golgi tubulation after PKD1 depletion reflects compensatory mechanism by PKD3, because it is expressed at very low levels in hippocampal neurons, and PKD1-KD should also act as dominant-negative for PKD3. It is more plausible that other neuronal proteins, such as LIMK1, may regulate exit and fission from the Golgi. In fact, expression of LIMK1-KD induces Golgi tubulation and accumulation of neuronal membrane proteins at the Golgi apparatus (Rosso et al., 2004).
However, our results suggest a novel and fundamental role for PKD1 in regulating neuronal membrane trafficking that involves the correct packaging of dendritic membrane proteins at the Golgi apparatus. A number of determinants, including protein sequences, carbohydrate modifications, lipids rafts, and smart motors (Shah and Goldstein, 2000) have been proposed to explain the selective trafficking of TfR- (Burack et al., 2000; Silverman et al., 2001; this study) or LRP- (this study) containing vesicles to dendrites and their subsequent delivery to the dendritic surface; we can now add PKD1 as a crucial regulator of the selective trafficking of these dendritic membrane proteins.
Thus, after expression of the kinase-inactive mutant or RNAi suppression of PKD1, selective trafficking of LRP or TfR to dendrites and their delivery to the dendritic plasma membrane are completely altered. In fact, after PKD1 depletion, these two dendritic membrane proteins colocalize with vesicles containing VAMP2, an axonal membrane protein trafficking to axons and dendrites, but that is selectively retained at the axonal membrane (Sampo et al., 2003). It is likely that after PKD1 inactivation, missorting occurs because of a defect in the biogenesis of normal vesicles at the Golgi with cargo entering the wrong vesicle. Accordingly, after expression of PKD1-KD, spectral confocal microscopy revealed extensive colocalization of LRP and VAMP2 in vesicle-like structures emerging from the Golgi and entering neuritic processes. Interestingly, no missorting was detected after expression of P155G, a PKD1-KD mutant unable to bind DAG, and hence lacking Golgi localization. Consistent with this, our immunofluorescence observations show that in cultured hippocampal pyramidal neurons endogenous PKD1 preferentially localizes to the region of the Golgi apparatus. Lack of fission or decreased fission could lead to abnormal packaging of dendritic membrane proteins at the Golgi. However, expression of LIMK1-KD, which induces Golgi tubulation (Rosso et al., 2004) and delays exit of TfR or LRP, does not result in mistargeting of dendritic membrane proteins (M. Bisbal and A. Cáceres, unpublished observations).
Depletion or inactivation of PKD1 at the Golgi not only missorted TfR and LRP into the wrong vesicles, but also changed its membrane delivery and retrieval. This suggests that PKD1 regulates events at the Golgi that have profound consequences on membrane biogenesis beyond this organelle, implicating components of the exocytic and endocytic pathways. Although the mechanisms underlying these effects are not known, the phenotype observed after expression of PKD1 mutants may provide some clue.
For example, a significant increase in the rate of endocytosis of TfR or LRP was detected in dendrites of neurons expressing PKD1-KD; again, this effect depends on the Golgi localization of PKD1, because it was not detected after expression of the P155G mutant. Phosphorylation of Ser916 within the PDZ-binding motif of PKD1 appears to be involved in regulation of endocytosis. Thus, when PKD1-KD was mutated at Ser916, substituting this residue by glutamic acid (PKD1-KD S916E), which could mimic autophosphorylation of the Ser916, the rate of endocytosis of LRP or TfR was equivalent to that of control cells, which in turns result in a significant reduction in dendritic missorting. In contrast, when Ser916 was replaced by alanine, generating a mutant, PKD1 S916A, that cannot get phosphorylated, a significant increase in the rate of endocytosis was detected; interestingly, this phenomenon was accompanied by a dramatic alteration in the surface distribution of LRP4, with the protein being only detected at the axonal surface. It has been proposed that mutations of Ser916 at the PDZ-binding domain of PKD1 or PKD2, but not PKD3, may regulate the release of PDZ proteins from the Golgi apparatus (Sánchez-Ruiloba et al., 2006). PDZ proteins have been implicated in delaying the rate of endocytosis of at least some population of endocytic vesicles (e.g., G-protein-coupled receptors) (Puthenveedu and von Zastrow, 2006). It is therefore tempting to speculate that an abnormal retention of PDZ proteins at the Golgi caused by suppression/depletion or lack of auto/transphosphorylation of PKD1 may result in alterations of the machinery regulating endocytosis at the dendritic membrane.
Finally, our results show that disruption of the polarized trafficking of LRP or TfR after PKD1 suppression/inactivation is an early event that occurs in the absence of detectable decreases in the steady-state intracellular distribution of LRP4 or TfR and precedes alterations in dendritic morphology. A likely prediction of our results is that in the absence of PKD1, missorting of dendritic membrane proteins important for regulating outgrowth (i.e., neurotrophin or neurotransmitter receptors) would occur, thereby halting at a later time point dendritic development and maintenance. In favor of this, our observations, like those of Horton et al. (2005), showed a decrease in total dendritic length and reduced branching 24–30 h after inactivation/depletion of PKD1, which is much later than the alterations detected in the trafficking of dendritic membrane proteins.
Footnotes
This work was supported by grants from Fondo Nacional para las Ciencias y la Tecnología, Consejo Nacional de Investigaciones Científicas y Técnicas, and a Howard Hughes Medical Institute International Award (A.C.). It was also supported by Fogarty International Research Collaboration Award Grant TW006456 (M.P.M.) and grants from the Fondo Nacional de Desarrollo Científico y Tecnológico, Fondo de Investigación Avanzada en Áreas Prioritarias, and the Millennium Institute of Fundamental and Applied Biology (M.P.M.).
References
- Bagowski CP, Stein-Gerlach M, Choidas A, Ullrich A. Cell-type specific phosphorylation of threonines T654 and T669 by PKD defines the signal capacity of the EGF receptor. EMBO J. 1999;18:5567–5576. doi: 10.1093/emboj/18.20.5567. [DOI] [PMC free article] [PubMed] [Google Scholar]
- Baron CL, Malhotra V. Role of diacylglycerol in PKD recruitment to the TGN and protein transport to the plasma membrane. Science. 2002;295:325–328. doi: 10.1126/science.1066759. [DOI] [PubMed] [Google Scholar]
- Bossard C, Bresson D, Polishchuk RS, Malhotra V. Dimeric PKD regulates membrane fission to form transport carriers at the TGN. J Cell Biol. 2007;179:1123–1131. doi: 10.1083/jcb.200703166. [DOI] [PMC free article] [PubMed] [Google Scholar]
- Bowden ET, Barth M, Thomas D, Glazer RI, Mueller SC. An invasion-related complex of cortactin, paxillin and PKCmu associates with invadopodia at sites of extracellular matrix degradation. Oncogene. 1999;18:4440–4449. doi: 10.1038/sj.onc.1202827. [DOI] [PubMed] [Google Scholar]
- Burack MA, Silverman MA, Banker G. The role of selective transport in neuronal polarity sorting. Neuron. 2000;26:465–472. doi: 10.1016/s0896-6273(00)81178-2. [DOI] [PubMed] [Google Scholar]
- Cheng C, Glover G, Banker G, Amara SG. A novel sorting motif in the glutamate transporter excitatory amino acid transporter 3 directs its targeting in Madin–Darby canine kidney cells and hippocampal neurons. J Neurosci. 2002;22:10643–10652. doi: 10.1523/JNEUROSCI.22-24-10643.2002. [DOI] [PMC free article] [PubMed] [Google Scholar]
- Chuang JZ, Yeh TY, Bollati F, Conde C, Canavosio F, Caceres A, Sung C-H. The dynein light chain Tctex-1 has a dynein-independent role in actin remodeling during neurite outgrowth. Dev Cell. 2005;9:75–86. doi: 10.1016/j.devcel.2005.04.003. [DOI] [PMC free article] [PubMed] [Google Scholar]
- Chung HJ, Jan YN, Jan LY. Polarized axonal surface expression of neuronal KCNQ channels is mediated by multiple signals in the KCNQ2 and KCNQ3 C-terminal domains. Proc Natl Acad Sci U S A. 2006;103:8870–8875. doi: 10.1073/pnas.0603376103. [DOI] [PMC free article] [PubMed] [Google Scholar]
- Craig AM, Banker GA. Neuronal polarity. Annu Rev Neurosci. 1994;17:267–310. doi: 10.1146/annurev.ne.17.030194.001411. [DOI] [PubMed] [Google Scholar]
- Craig AM, Wyborski RJ, Banker GA. Preferential addition of newly synthesized membrane protein at axonal growth cones. Nature. 1995;375:592–594. doi: 10.1038/375592a0. [DOI] [PubMed] [Google Scholar]
- Díaz Añel AM, Malhotra V. PKCη is required for β1γ2/β3γ2- and PKD-mediated transport to the cell surface and the organization of the Golgi apparatus. J Cell Biol. 2005;169:83–91. doi: 10.1083/jcb.200412089. [DOI] [PMC free article] [PubMed] [Google Scholar]
- Endo K, Oki E, Biedermann V, Kojima H, Yoshida K, Johannes FJ, Kufe D, Datta R. Proteolytic cleavage and activation of protein kinase C [micro] by caspase-3 in the apoptotic response of cells to 1-beta-d-arabinofuranosylcytosine and other genotoxic agents. J Biol Chem. 2000;275:18476–18481. doi: 10.1074/jbc.M002266200. [DOI] [PubMed] [Google Scholar]
- Haucke V. Cargo takes control of endocytosis. Cell. 2006;127:35–37. doi: 10.1016/j.cell.2006.09.012. [DOI] [PubMed] [Google Scholar]
- Hirokawa N, Takemura R. Molecular motors and mechanisms of directional transport in neurons. Nat Rev Neurosci. 2005;6:201–214. doi: 10.1038/nrn1624. [DOI] [PubMed] [Google Scholar]
- Horton AC, Ehlers MD. Neuronal polarity and trafficking. Neuron. 2003;40:277–295. doi: 10.1016/s0896-6273(03)00629-9. [DOI] [PubMed] [Google Scholar]
- Horton AC, Rácz B, Monson EE, Lin AL, Weinberg RJ, Ehlers MD. Polarized secretory trafficking directs cargo for asymmetric dendrite growth and morphogenesis. Neuron. 2005;48:757–771. doi: 10.1016/j.neuron.2005.11.005. [DOI] [PubMed] [Google Scholar]
- Hurd C, Waldron RT, Rozengurt E. Protein kinase D complexes with C-Jun N-terminal kinase via activation loop phosphorylation and phosphorylate the C-Jun N-terminus. Oncogene. 2002;21:2154–2160. doi: 10.1038/sj.onc.1205290. [DOI] [PubMed] [Google Scholar]
- Iglesias T, Cabrera-Poch N, Mitchell MP, Naven TJ, Rozengurt E, Schiavo G. Identification and cloning of Kidins220, a novel neuronal substrate of protein kinase D. J Biol Chem. 2000;275:40048–40056. doi: 10.1074/jbc.M005261200. [DOI] [PubMed] [Google Scholar]
- Jamora C, Yamanouye N, Van Lint J, Laudenslager J, Vandenheede JR, Faulkner DJ, Malhotra V. Gbetagamma-mediated regulation of Golgi organization is through the direct activation of protein kinase D. Cell. 1999;98:59–68. doi: 10.1016/S0092-8674(00)80606-6. [DOI] [PubMed] [Google Scholar]
- Jareb M, Banker G. The polarized sorting of membrane proteins expressed in cultured hippocampal neurons using viral vectors. Neuron. 1998;20:855–867. doi: 10.1016/s0896-6273(00)80468-7. [DOI] [PubMed] [Google Scholar]
- Kreitzer G, Schmoranzer J, Low SH, Li X, Gan Y, Weimbs T, Simon SM, Rodriguez-Boulan E. Three-dimensional analysis of post-Golgi carrier exocytosis in epithelial cells. Nat Cell Biol. 2003;5:126–136. doi: 10.1038/ncb917. [DOI] [PubMed] [Google Scholar]
- Kunda P, Paglini G, Quiroga S, Kosik K, Caceres A. Evidence for the involvement of Tiam-1 in axon formation. J Neurosci. 2001;21:2361–2372. doi: 10.1523/JNEUROSCI.21-07-02361.2001. [DOI] [PMC free article] [PubMed] [Google Scholar]
- Liljedahl M, Maeda Y, Colanzi A, Ayala I, Van Lint J, Malhotra V. Protein kinase D regulates the fission of cell surface destined transport carriers from the trans-Golgi network. Cell. 2001;104:409–420. doi: 10.1016/s0092-8674(01)00228-8. [DOI] [PubMed] [Google Scholar]
- Maeda Y, Beznoussenko GV, Van Lint J, Mironov AA, Malhotra V. Recruitment of protein kinase D to the trans-Golgi network via the first cysteine-rich domain. EMBO J. 2001;20:5982–5990. doi: 10.1093/emboj/20.21.5982. [DOI] [PMC free article] [PubMed] [Google Scholar]
- Marzolo MP, Yuseff MI, Retamal C, Donoso M, Ezquer F, Farfán P, Li Y, Bu G. Differential distribution of low-density lipoprotein receptor-related protein (LRP) and megalin in polarized epithelial cells is determined by their cytoplasmic domains. Traffic. 2003;4:273–288. doi: 10.1034/j.1600-0854.2003.00081.x. [DOI] [PubMed] [Google Scholar]
- Matthews S, Iglesias T, Cantrell D, Rozengurt E. Dynamic re-distribution of protein kinase D (PKD) as revealed by a GFP-PKD fusion protein: dissociation from PKD activation. FEBS Lett. 1999;457:515–521. doi: 10.1016/s0014-5793(99)01090-x. [DOI] [PubMed] [Google Scholar]
- Matthews SA, Iglesias T, Rozengurt E, Cantrell D. Spatial and temporal regulation of protein kinase D. EMBO J. 2000;19:2935–2945. doi: 10.1093/emboj/19.12.2935. [DOI] [PMC free article] [PubMed] [Google Scholar]
- Nelson WJ, Yeaman C. Protein trafficking in the exocytic pathway of polarized epithelial cells. Trends Cell Biol. 2001;11:483–486. doi: 10.1016/s0962-8924(01)02145-6. [DOI] [PubMed] [Google Scholar]
- Nishikawa K, Toker A, Johannes FJ, Songyang Z, Cantley LC. Determination of the specific substrate sequence motifs of protein kinase C isozymes. J Biol Chem. 1997;272:952–960. doi: 10.1074/jbc.272.2.952. [DOI] [PubMed] [Google Scholar]
- Paglini G, Kunda P, Quiroga S, Kosik K, Cáceres A. Suppression of radixin and moesin alters growth cone morphology, motility, and process formation in primary cultured neurons. J Cell Biol. 1998;143:443–455. doi: 10.1083/jcb.143.2.443. [DOI] [PMC free article] [PubMed] [Google Scholar]
- Pfenninger KH, Laurino L, Peretti D, Wang X, Rosso S, Morfini G, Cáceres A, Quiroga S. Regulation of membrane expansion at the nerve growth cone. J Cell Sci. 2003;116:1209–1217. doi: 10.1242/jcs.00285. [DOI] [PubMed] [Google Scholar]
- Prigozhina NL, Waterman-Storer CM. Protein kinase D-mediated anterograde membrane trafficking is required for fibroblast motility. Curr Biol. 2004;14:88–98. doi: 10.1016/j.cub.2004.01.003. [DOI] [PubMed] [Google Scholar]
- Puthenveedu MA, von Zastrow M. Cargo regulates clathrin-coated pit dynamics. Cell. 2006;127:113–124. doi: 10.1016/j.cell.2006.08.035. [DOI] [PubMed] [Google Scholar]
- Roh MH, Margolis B. Composition and function of PDZ protein complexes during cell polarization. Am J Physiol Renal Physiol. 2003;285:F377–F387. doi: 10.1152/ajprenal.00086.2003. [DOI] [PubMed] [Google Scholar]
- Rosso S, Bollati F, Bisbal M, Peretti D, Sumi T, Nakamura T, Quiroga S, Ferreira A, Cáceres A. LIMK1 regulates Golgi dynamics, traffic of Golgi-derived vesicles, and process extension in primary cultured neurons. Mol Biol Cell. 2004;15:3433–3449. doi: 10.1091/mbc.E03-05-0328. [DOI] [PMC free article] [PubMed] [Google Scholar]
- Rozengurt E, Sinnett-Smith J, Van Lint J, Valverde AM. Protein kinase D (PKD): a novel target for diacylglycerol and phorbol esters. Mutat Res. 1995;333:153–160. doi: 10.1016/0027-5107(95)00141-7. [DOI] [PubMed] [Google Scholar]
- Rykx A, De Kimpe L, Mikhalap S, Vantus T, Seufferlein T, Vandenheede JR, Van Lint J. Protein kinase D: a family affair. FEBS Lett. 2003;546:81–86. doi: 10.1016/s0014-5793(03)00487-3. [DOI] [PubMed] [Google Scholar]
- Sampo B, Kaech S, Kunz S, Banker GA. Two distinct mechanisms target membrane proteins to the axonal surface. Neuron. 2003;37:611–624. doi: 10.1016/s0896-6273(03)00058-8. [DOI] [PubMed] [Google Scholar]
- Sánchez-Ruiloba L, Cabrera-Poch N, Rodríguez-Martínez M, López-Menéndez C, Jean-Mairet RM, Higuero AM, Iglesias T. Protein kinase D intracellular localization and activity control kinase D-interacting substrate of 220-kDa traffic through a postsynaptic density-95/discs large/zonula occludens-1-binding motif. J Biol Chem. 2006;281:18888–18900. doi: 10.1074/jbc.M603044200. [DOI] [PubMed] [Google Scholar]
- Shah JV, Goldstein LS. Does motor protein intelligence contribute to neuronal polarity? Neuron. 2000;26:281–282. doi: 10.1016/s0896-6273(00)81158-7. [DOI] [PubMed] [Google Scholar]
- Sidorenko SP, Law CL, Klaus SJ, Chandran KA, Takata M, Kurosaki T, Clark EA. Protein kinase C mu (PKC mu) associates with the B cell antigen receptor complex and regulates lymphocyte signaling. Immunity. 1996;5:353–363. doi: 10.1016/s1074-7613(00)80261-7. [DOI] [PubMed] [Google Scholar]
- Silverman MA, Kaech S, Jareb M, Burack MA, Vogt L, Sonderegger P, Banker G. Sorting and directed transport of membrane proteins during development of hippocampal neurons in culture. Proc Natl Acad Sci U S A. 2001;98:7051–7057. doi: 10.1073/pnas.111146198. [DOI] [PMC free article] [PubMed] [Google Scholar]
- Silverman MA, Peck R, Glover G, He C, Carlin C, Banker G. Motifs that mediate dendritic targeting in hippocampal neurons: a comparison with basolateral targeting signals. Mol Cell Neurosci. 2005;29:173–180. doi: 10.1016/j.mcn.2005.02.008. [DOI] [PubMed] [Google Scholar]
- Storz P, Toker A. Protein kinase D mediates a stress-induced NF-kappaB activation and survival pathway. EMBO J. 2003;22:109–120. doi: 10.1093/emboj/cdg009. [DOI] [PMC free article] [PubMed] [Google Scholar]
- Szebenyi G, Bollati F, Bisbal M, Sheridan S, Faas L, Wray R, Haferkamp S, Nguyen S, Caceres A, Brady ST. Activity-driven dendritic remodeling requires microtubule-associated protein 1A. Curr Biol. 2005;15:1820–1826. doi: 10.1016/j.cub.2005.08.069. [DOI] [PubMed] [Google Scholar]
- Van Lint J, Rykx A, Maeda Y, Vantus T, Sturany S, Malhotra V, Vandenheede JR, Seufferlein T. Protein kinase D: an intracellular traffic regulator on the move. Trends Cell Biol. 2002;12:193–200. doi: 10.1016/s0962-8924(02)02262-6. [DOI] [PubMed] [Google Scholar]
- Waldron RT, Rozengurt E. Oxidative stress induces protein kinase D activation in intact cells. Involvement of Src and dependence on protein kinase C. J Biol Chem. 2000;275:17114–17121. doi: 10.1074/jbc.M908959199. [DOI] [PubMed] [Google Scholar]
- Wisco D, Anderson ED, Chang MC, Norden C, Boiko T, Fölsch H, Winckler B. Uncovering multiple axonal targeting pathways in hippocampal neurons. J Cell Biol. 2003;162:1317–1328. doi: 10.1083/jcb.200307069. [DOI] [PMC free article] [PubMed] [Google Scholar]
- Yap CC, Wisco D, Kujala P, Lasiecka ZM, Cannon JT, Chang MC, Hirling H, Klumperman J, Winckler B. The somatodendritic endosomal regulator NEEP21 facilitates axonal targeting of L1/NgCAM. J Cell Biol. 2008;180:827–842. doi: 10.1083/jcb.200707143. [DOI] [PMC free article] [PubMed] [Google Scholar]
- Yeaman C, Ayala MI, Wright JR, Bard F, Bossard C, Ang A, Maeda Y, Seufferlein T, Mellman I, Nelson WJ, Malhotra V. Protein kinase D regulates basolateral membrane protein exit from the trans-Golgi network. Nat Cell Biol. 2004;6:106–112. doi: 10.1038/ncb1090. [DOI] [PMC free article] [PubMed] [Google Scholar]
- Yudowski GA, Puthenveedu MA, von Zastrow M. Distinct modes of regulated receptor insertion to the somatodendritic plasma membrane. Nat Neurosci. 2006;9:622–627. doi: 10.1038/nn1679. [DOI] [PubMed] [Google Scholar]