

Abstract
Escherichia coli group 2 capsule gene clusters are temperature regulated, being expressed at 37°C but not at 20°C. Expression is regulated at the level of transcription by two convergent promoters, PR1 and PR3. In this paper, we show that regulation of transcription from PR3 involves a number of novel features including H-NS, SlyA, and a large 741-bp 5′ untranslated region (UTR). H-NS represses transcription from PR3 at 20°C and binds both 5′ and 3′ of the transcription start site. The 3′ downstream regulatory element (DRE) was essential for temperature-dependent H-NS repression. At 37°C, SlyA activates transcription independent of H-NS but maximal transcription requires H-NS. The UTR is present between the transcription start site and the first gene in the operon, kpsM. We demonstrate that the UTR, as well as containing the H-NS DRE, functions to moderate the extent of transcription that reaches kpsM and allows the binding of antitermination factor RfaH.
The expression of a polysaccharide capsule is a common feature of many bacteria, and it is believed to mediate interactions between the bacterium and its immediate environment (34, 35). In the case of Escherichia coli, more than 70 different capsular polysaccharides or K antigens have been described and classified into four groups (1-4) based on serological, biochemical, and genetic data (34, 35). Extraintestinal isolates of E. coli associated with invasive disease usually express group 2 K antigens, of which the K1 and K5 polysaccharides are well-studied examples (35). The expression of group 2 K antigens is temperature regulated; they are expressed at 37°C but not at 20°C (23, 27, 30, 34, 35), ensuring that capsule expression is switched on inside the host but not in the external environment. Such temperature regulation of virulence factors is a common feature of bacterial pathogens including Shigella, Yersinia, and Salmonella spp. (14).
The K5 capsule gene cluster is composed of three regions. Regions 1 (kpsFEDUCS) and 3 (kpsMT) (Fig. 1) are conserved throughout group 2 capsule gene clusters and encode proteins involved in the transport of group 2 capsular polysaccharides onto the cell surface. Region 2 is serotype specific and, in the case of the K5 capsule gene cluster, contains the kfiABCD genes responsible for synthesis of the K5 polysaccharide (23) (Fig. 1). Transcription of group 2 capsule gene clusters is driven by two convergent temperature-regulated promoters located upstream of regions 1 and 3 (Fig. 1) (30, 32). The region 1 promoter (PR1) is located 225 bp 5′ of the kpsF gene, and transcription from this promoter yields an 8-kb polycistronic region 1 transcript that is later processed to yield a separate kpsS-specific transcript (Fig. 1) (30). Regulation of transcription from PR1 is complex, with input from a number of regulatory proteins including H-NS, BipA, and IHF (27). H-NS has been shown to play an unusual dual role, being required for maximum transcription at 37°C but also acting to repress transcription at 20°C (6, 27). Recently, it has been shown that transcription from this promoter is regulated via a novel interplay between H-NS and SlyA, with a requirement for H-NS for SlyA-mediated activation of transcription at 37°C (6). In this system, the relative availabilities of H-NS and SlyA are likely to be important for the temperature-dependent activation of transcription (6). A similar system has recently been described for the SlyA-mediated regulation of hlyE expression in E. coli (16). In addition to H-NS and SlyA, the IHF protein is also required for maximum transcription from PR1 at 37°C and binds to a single site located 130 bp 3′ of the transcription start point at PR1 (Fig. 1) (27). The regulation of PR1 by BipA is independent of SlyA but awaits elucidation.
FIG. 1.

Transcriptional organization of the K5 capsule gene cluster. Functional regions 1, 2, and 3 are shown, with the conserved kps genes denoted by the filled boxes on either side of the K5-specific kfi genes. The transcription start points are indicated by broken arrows at promoters PR1 and PR3, located upstream of regions 1 and 3. The horizontal arrows show the major transcripts with processed kpsS-specific transcript.
The region 3 promoter (PR3) is located 741 bp 5′ of kpsM, and transcription from PR3 proceeds through into region 2 with the aid of transcription antitermination factor RfaH (Fig. 1) (33). The activity of RfaH is dependent on the ops sequence centered 28 bp 5′ of the ATG of kpsM, forming part of a larger JUMPStart element (12, 32, 33). RfaH is also involved in the expression of E. coli group 1 capsules (25). The role of the 741-nucleotide untranslated region (UTR) 5′ of kpsM is unknown, but transcription from PR3 is dependent on both H-NS and BipA, with both regulators being required for maximal transcription at 37°C and temperature-mediated repression at 20°C (27). In this paper, we demonstrate that H-NS binds both 5′ and 3′ of the transcriptional start site and that the 3′ H-NS downstream regulatory element (DRE) is essential for H-NS temperature-dependent repression. In addition, we demonstrate that SlyA activates transcription from PR3 at 37°C and that maximal transcription at 37°C requires H-NS. We identify the binding site for SlyA at PR3 and demonstrate by DNase I footprinting that in the presence of both H-NS and SlyA a different nucleoprotein complex is formed at PR3. Finally, we show that one function of the UTR is to reduce the level of transcription that reaches kpsM and that the UTR does not encode any cis-acting factors.
MATERIALS AND METHODS
Bacterial strains, plasmids, and DNA fragments.
The strains and plasmids used in this study are listed in Table 1. Bacteria were routinely grown in LB medium at 37°C or 20°C as indicated and supplemented with antibiotics as appropriate at the following concentrations: 25 μg ml−1 chloramphenicol, 50 μg ml−1 kanamycin, 50 μg ml−1 streptomycin, 12.5 μg ml−1 tetracycline, and 100 μg ml−1 ampicillin. 5-Bromo-4-chloro-3-indolyl-β-d-galactopyranoside (X-Gal) was used at a concentration of 40 μg ml−1. Exonuclease III (ExoIII) digestions of plasmid pRSA were performed according to the manufacturer's instructions (Promega).
TABLE 1.
Bacterial strains and plasmids used in this study
| E. coli strain or plasmid | Relevant genotype | Source or reference |
|---|---|---|
| BL-21 | F−dcm ompT hsdS(rB− mB−) gal | Stratagene |
| MC4100hns | hns::kan | 27 |
| MG1655slyA::kan | slyA::kan | J. Green |
| MG1655slyA::Cmr | slyA::Cmr | Peng Xue |
| P90C | F−ara Δ(lac pro) thi-1 | 29 |
| P90Chns::kan | P90C × P1(MC4100hns) | This study |
| P90CslyA::kan | P90C × P1(MG1655slyA::kan) | This study |
| P90Chns::kan slyA::Cmr | P90Chns::kan × P1(MG1655slyA::Cmr) | This study |
| Plasmids | ||
| pACYC184 | Cloning vector | 5 |
| pACYC184-SlyA | pACYC184 containing slyA coding region and promoter | 6 |
| pET22b | His fusion expression vector | Novagen |
| pET22b-H-NS | pET22b, hns+ | 6 |
| pGEX-6P-1 | GST fusion expression vector | Amersham Biosciences |
| pRS415 | lacZ promoter-probe vector | 29 |
| pBluescriptSK+ | Cloning vector | Stratagene |
| pRSA | pRS415+PR3 (−320 to +741) | This study |
| pRSB | pRS415 + the sequences (+1 to +741) 3′ to PR3 | This study |
| pRSC | pRS415+PR3 (−320 to +1) | This study |
| pRSA-1 | 56-bp deletion of pRSA (Fig. 2) | This study |
| pRSA-2 | 107-bp deletion of pRSA (Fig. 2) | This study |
| pRSA-3 | 216-bp deletion of pRSA (Fig. 2) | This study |
| pRSA-4 | 276-bp deletion of pRSA (Fig. 2) | This study |
| pRSA-5 | 299-bp deletion of pRSA (Fig. 2) | This study |
| pRSA-6 | 361-bp deletion of pRSA (Fig. 2) | This study |
| pRSA-11 | 456-bp deletion of pRSA (Fig. 2) | This study |
| pRSA-12 | 658-bp deletion of pRSA (Fig. 2) | This study |
| pRSA-17 | 706-bp deletion of pRSA (Fig. 2) | This study |
| pBlue-C | pSK+ with a cloned 356-bp PCR product (−320 to +36) | This study |
| pBlue-H | pSK+ with a cloned 245-bp PCR product (+1 to +246) | This study |
β-Galactosidase assays.
Overnight cultures were diluted 1:100 into fresh prewarmed LB plus antibiotics and grown to an optical density at 600 nm of ∼0.4 to 0.6. Assays were performed as described previously (19).
Protein purification.
The hns gene was cloned into plasmid pET22b to generate plasmid pET22b-H-NS expressing a C-terminally six-His-tagged H-NS protein, and the H-NS protein was purified as described previously (6). The slyA structural gene was cloned into plasmid pGEX-6P-1 and expressed in strain E. coli BL21, yielding a glutathione S-transferase (GST)-SlyA fusion protein. An overnight culture of BL21pGST-SlyA was diluted 1:100 into fresh, ampicillin-containing LB medium and grown at 37°C with vigorous shaking to an optical density at 600 nm of ∼0.5. Expression of the GST-SlyA fusion was then induced by the addition of isopropyl-β-D-thiogalactopyranoside (IPTG) to a final concentration of 1 mM. Cells were incubated for a further 3 h at 25°C before harvesting by centrifugation at 4°C. The cell pellet was resuspended in 8 ml ice-cold phosphate-buffered saline (PBS)-20% glycerol and passaged twice through a French pressure cell. Clarified cell extracts were adsorbed onto a 1-ml glutathione-Sepharose column (Amersham Biosciences) equilibrated with PBS. The column was washed with 20 ml PBS and equilibrated with 10 ml Pre-Scission Protease buffer (50 mM Tris-HCl, 100 mM NaCl, 1 mM EDTA, 1 mM dithiothreitol, pH 8). The bound SlyA protein was cleaved from GST by overnight digestion with 5 U of Pre-Scission Protease (Amersham Biosciences) at 4°C and eluted in Pre-Scission protease buffer. In both cases, protein concentrations were determined with the Bio-Rad protein assay and bovine serum albumin standards. Purification of SlyA was confirmed by sodium dodecyl sulfate-polyacrylamide gel electrophoresis (data not shown).
Electrophoretic mobility shift assays (EMSAs).
The 450-bp DNA fragment spanning PR3 (fragment A, Fig. 2), amplified with primers 5′-AGGTATTGCCATTTCCTTAACC-3′ and 5′-AACCAACACCATCCCTCAGATA-3′, was incubated at a final concentration of 6.7 nM with various concentrations of purified SlyA, H-NS, or both, as indicated. A 200-bp fragment spanning the multiple cloning site of pBluescript (Stratagene) was amplified with M13 Forward primer (5′-TGTAAAACGACGGCCAGT-3′) and M13 Reverse primer (5′-GGAAACAGCTATGACCATG-3′) and used as a negative control at a final concentration of 18 nM. The EMSA reaction buffer contained 10 mM Tris-HCl (pH 9), 50 mM KCl, and 0.1% Triton X-100 in a final volume of 10 μl (31). Samples were incubated at either 37°C or 20°C for 10 min before being mixed with 5× loading dye (Bioline) and resolved on 5% polyacrylamide gels containing 2% glycerol. Electrophoresis was performed at a controlled temperature of either 20°C or 37°C, as appropriate, in 1× Tris-borate-EDTA at 12 V cm−1 before staining in 0.5 μg ml−1 ethidium bromide for 15 min.
FIG. 2.

Constructs used in the analysis of the PR3 promoter. The extent of the DNA present in plasmids pRSA, pRSB, and pRSC fused to lacZ is shown by horizontal lines. The ExoIII deletions of pRSA are depicted below with the extent of the deletion in base pairs in parentheses. Fragments A and C represent the fragments used in EMSA or DNase I footprinting. The broken arrow is the transcription initiation site, and the numbering indicates nucleotide positions relative to the transcription start site (+1).
DNase I footprinting.
Plasmid pBlue-C was generated by cloning a 356-bp PCR fragment spanning the transcript start site (fragment C, Fig. 2) into plasmid pSK+ (Table 1). The PCR fragment was amplified with primers CF (5′-AGGTATTGCCATTTCCTTAACCCA-3′) and CR (5′-TTTCTGATTATCTCCAGAATTTTA-3′). Plasmid pBlue-H was generated by cloning a 245-bp fragment 3′ of the transcript start site (fragment H, Fig. 2) into pSK+ (Table 1). The PCR fragment was amplified with primers FF (5′-AGGTATTGCCATTTCCTTAACC-3′) and FR (5′-AACCAACACCATCCCTCAGTAGATA-3′). For DNase I footprinting, 5 μg of either plasmid pBlue-C or pBlue-H (Table 1) was digested with SpeI and HindIII in the case of pBlue-C and PstI and HindIII in the case of pBlue-H, and the PR3 promoter fragment was separated from the vector backbone on a 0.7% agarose gel, followed by purification with a Qiagen Gel Extraction kit according to the manufacturer's instructions. The purified fragment was labeled with Klenow enzyme and 20 μCi of [α-32P]dATP for 20 min at room temperature. Labeled DNA was then purified with a Qiagen PCR cleanup kit, and a 5 nM final concentration of the promoter fragment was incubated at room temperature with various concentrations of SlyA, H-NS, or both in a buffer containing 10 mM Tris-HCl (pH 9), 50 mM KCl, and 0.1% Triton X-100 (6, 31) in a total volume of 50 μl. After 10 min of incubation, 50 μl of a 10 mM MgCl2-5 mM CaCl2 solution was added to each sample before digestion with 0.14 U of DNase I (Promega) for 3 min at room temperature. Digestion reactions were terminated by addition of 90 μl stop solution (200 mM NaCl, 30 mM EDTA, 1% sodium dodecyl sulfate) prewarmed to 37°C. Digestion products were extracted with phenol-chloroform, ethanol precipitated, and then resuspended in 10 μl formamide loading dye (1:2 0.1 M NaOH-formamide, 0.1% xylene cyanol, 0.1% bromophenol blue). Resuspended samples were denatured by heating to 90°C for 3 min, followed by immersion in ice for 2 min, and 3 μl of each sample was loaded onto a 6% denaturing polyacrylamide sequencing gel for electrophoretic fractionation. Footprinting reactions were calibrated with Maxam-Gilbert G tracks (18).
RESULTS
Analysis of sequences 3′ of the transcription start site.
To study expression from PR3, three plasmids, pRSA, pRSB, and pRSC, were generated in promoter-probe plasmid pRS415 (Fig. 2; Table 1). These plasmids were introduced into strain P90C, and β-galactosidase activity was determined following growth at either 20°C or 37°C (Table 2). Plasmid pRSA expressed significant β-galactosidase activity at 37°C that was dramatically reduced at 20°C (Table 2). This is in keeping with the presence of temperature-regulated PR3. In contrast, pRSB, which contained the 741-bp UTR between the previously mapped transcriptional start site of PR3 (32) and the ATG of kpsM, showed levels of β-galactosidase activity similar to those of vector-only control pRS415 at both temperatures (Table 2). This shows that there is no significant promoter activity in the 741-bp region. In contrast, plasmid pRSC, which lacks the 741-bp region, gave very high levels of β-galactosidase activity at both temperatures (Table 2). This demonstrates that the 741-bp region is important in temperature regulation and that it has the effect of reducing the level of transcription that reaches kpsM. To further investigate the region 3′ of the transcriptional start site, a series of ExoIII deletions were generated (Fig. 2) and fused to lacZ in plasmid pRS415 and β-galactosidase activities were determined at both 20°C and 37°C. Increasingly large deletions of the 741-bp region resulted in increased levels of β-galactosidase activity, confirming that one of the effects of this region is to reduce transcription that reads through into region 3 (Table 3). The only exception to this was plasmid pRSA-1, possessing the smallest deletion (56 bp), which expressed 50% of the β-galactosidase activity of pRSA at 37°C (Table 3). This deletion removes the ops site essential for RfaH activity but has no effect on temperature regulation. Both plasmids pRSA-17, which harbors only 35 bp 3′ of the transcription start point (Fig. 2), and pRSA-12, possessing only 83 bp 3′ of the transcriptional start site (Fig. 2), lost temperature regulation, with high levels of β-galactosidase activity at both temperatures (Table 3). In contrast, plasmid pRSA-11, which has 285 bp 3′ of the transcriptional start site (Fig. 2), retained temperature regulation, albeit that the levels of β-galactosidase activity were high (Table 3). This indicates that the region located from 71 to 283 bp 3′ of the transcriptional start site is likely to be the major component in mediating the temperature regulation of PR3, although on the basis of the pRSA-11 data we cannot preclude the possibility that other sequences immediately 3′ of +283 also contribute to temperature regulation.
TABLE 2.
Expression from PR3 at 37°C and 20°C
| Strain | Mean β-Galactosidase activity (Miller units) ± SEMa
|
|
|---|---|---|
| 37°C | 20°C | |
| P90C(pRS415) | 132 ± 17 | 100 ± 7 |
| P90C(pRSA) | 1319 ± 90 | 120 ± 9 |
| P90C(pRSB) | 140 ± 15 | 158 ± 15 |
| P90C(pRSC) | 10,326 ± 252 | 12,000 ± 190 |
TABLE 3.
Effects of deletions 3′ to the transcriptional start site on temperature regulation of PR3
| Strain | Mean β-Galactosidase activity (Miller units) ± SEMa
|
|
|---|---|---|
| 37°C | 20°C | |
| P90C(pRS415) | 78 ± 7 | 74 ± 9 |
| P90C(pRSC) | 24,643 ± 157 | 24,800 ± 164 |
| P90C(pRSA) | 1,044 ± 85 | 99 ± 8 |
| P90C(pRSA-1) | 577 ± 29 | 78 ± 5.5 |
| P90C(pRSA-2) | 1,375 ± 90 | 212 ± 15 |
| P90C(pRSA-3) | 2,211 ± 79 | 113 ± 9 |
| P90C(pRSA-4) | 2,907 ± 81 | 150 ± 10 |
| P90C(pRSA-5) | 7,886 ± 87 | 424 ± 23 |
| P90C(pRSA-6) | 11,000 ± 85 | 587 ± 28 |
| P90C(pRSA-11) | 12,954 ± 95 | 2,800 ± 75 |
| P90C(pRSA-12) | 18,000 ± 123 | 17,056 ± 216 |
| P90C(pRSA-17) | 20,000 ± 118 | 21,000 ± 230 |
It has been shown in other systems that the presence of a long region of 5′ untranslated mRNA is important in mRNA stability affecting decay and increasing messenger half-life (11). To investigate whether the 741-bp region plays a similar role in expression from PR3, the half-life of mRNA generated by PR3 in cells carrying pRSA and pRSC was measured at intervals following treatment with rifampin. Deletion of the 741-bp region had no significant effect on the half-life of the lacZ mRNA (data not shown).
Roles of RfaH, H-NS, and SlyA in regulating transcription at PR3.
To study the roles of different regulators, plasmid pRSA was introduced into different mutants of strain P90C and the levels of β-galactosidase activity were assayed. The rfaH mutation reduced β-galactosidase activity by 50% (Table 4). This is similar to the effect seen when the ops site was deleted in plasmid pRSA-1 (Table 3) and confirms the role of RfaH in stabilizing the PR3 transcript. To study the effect of H-NS on PR3, plasmid pRSA was introduced into strain P90Chns and the levels of β-galactosidase activity were assayed. The hns mutation reduced β-galactosidase activity by approximately 50% at 37°C in strain P90Chns(pRSA), whereas at 20°C β-galactosidase activity increased to a level comparable to that of the wild type at 37°C (Table 4). These data confirm a dual role for H-NS both in the repression of transcription at 20°C and in maximizing transcription at 37°C.
TABLE 4.
Effects of H-NS, RfaH, and SlyA on expression from PR3 at 37°C and 20°C
| Strain | Mean β-Galactosidase activity (Miller units) ± SEMa
|
|
|---|---|---|
| 37°C | 20°C | |
| P90C(pRS415) | 124 ± 17 | 100 ± 7 |
| P90C(pRSA) | 1,028 ± 125 | 26 ± 7 |
| P90Chns(pRSA) | 496 ± 20 | 857 ± 90 |
| P90CslyA(pRSA) | 186 ± 51 | 25 ± 5 |
| P90Chns slyA(pRSA) | 95 ± 25 | 24 ± 4 |
| P90CrfaH(pRSA) | 523 ± 24 | 89 ± 12 |
β-Galactosidase activity of P90C and mutants bearing either the promoter probe plasmid pRS415 or derivatives was assayed at 37°C and 20°C. Plasmid pRSA is described in Fig. 2 and Table 1. Neither the hns nor the slyA mutation had any effect on the level of β-galactosidase activity expressed by pRS415 (data not shown). Data are the means of three independent experiments performed in triplicate.
It has been shown recently that SlyA regulates transcription from PR1 in conjunction with H-NS (6). To establish a role for SlyA in regulating transcription from PR3, plasmid pRSA was introduced into strain P90CslyA and the levels of β-galactosidase activity were measured at both 37°C and 20°C. The slyA mutation resulted in a fivefold reduction in β-galactosidase activity at 37°C but had no detectable effect at 20°C (Table 4). This indicates a role for SlyA in the activation of transcription from PR3 at 37°C. To study possible interactions between H-NS and SlyA, plasmid pRSA was introduced into strain P90Chns slyA and the level of β-galactosidase activity was measured following growth at 20°C and 37°C. The double mutant exhibited half of the β-galactosidase activity (95 Miller units) observed in the slyA single mutant at 37°C (Table 4). At 20°C, there was no significant difference between the β-galactosidase activities generated by the slyA single and hns slyA double mutants (Table 4). Comparison of the β-galactosidase activities at 20°C in the hns single and hns slyA double mutants indicates that in the hns mutant, the activation of transcription at 20°C must be mediated by SlyA.
Interaction of H-NS and SlyA with PR3.
To demonstrate that H-NS and SlyA directly interact with PR3, EMSAs were performed. The 450-bp A fragment spanning PR3 (Fig. 2) was amplified by PCR and incubated with increasing concentrations of either H-NS or SlyA at 37°C and 20°C. H-NS showed detectable binding at 0.1 μM to the A fragment at both temperatures, with complete retardation of the fragment at 0.3 μM (Fig. 3A and B). At increasing concentrations of H-NS, higher-order complexes between H-NS and the fragment were detectable (Fig. 3A and B). At both temperatures, there was no detectable binding of H-NS to the negative control fragment until the concentration of H-NS reached 0.4 μM (Fig. 3A and B). By DNase I footprinting, it was possible to show that H-NS gave a typically large footprint protecting a region from approximately −135 to −21 (Fig. 4A). Such large footprints are often seen with H-NS-regulated genes (2, 26, 37). In addition, a second H-NS binding site 3′ of the transcriptional start was mapped to positions +141 to +219 (Fig. 4B). This correlates with the ExoIII deletion data, which showed that plasmid pRSA-11, which has 285 bp 3′ of the transcriptional start, is temperature regulated. This is in contrast to plasmid pRSA-12, which has 83 bp 3′ of the transcriptional start site and is not temperature regulated (Table 3). This supports the concept that H-NS binding 3′ of the transcriptional start site is important in temperature regulation. To confirm this, we assayed the β-galactosidase activity of strain P90Chns carrying plasmids pRSA-3, pRSA-6, and pRSA-11 at 20°C, all of which are temperature regulated in the wild type (Table 3). In the hns mutant, the levels of β-galactosidase activity were as follows: pRSA-3, 4,690 ± 299 Miller units; pRSA-6, 11,412 ± 81 Miller units; pRSA-11, 6,046 ± 853 Miller units. These were comparable to the activities seen in P90C at 37°C (Table 3), clearly showing that in an hns mutant PR3 is no longer temperature regulated in these plasmids. This confirms not only that sequences 3′ of the transcriptional start site are important in H-NS-mediated temperature regulation of transcription from PR3 but also that H-NS is not involved in any potential temperature-mediated regulation conferred by sequences 3′ of +285.
FIG. 3.

H-NS binds to PR3. EMSA of purified H-NS incubated with fragment A (as detailed in Fig. 1) together with a negative control consisting of a 200-bp fragment spanning the multiple cloning site (MCS) of pBluescript at either 37°C (A) or 20°C (B). The concentrations of H-NS are indicated above the lanes, and lane M contains molecular weight markers. Free DNA and protein-DNA complexes are indicated on the right.
FIG. 4.

DNase I footprint analysis of H-NS binding to PR3. (A) Increasing concentrations of H-NS, as indicated above the tracks, were incubated with fragment C (Fig. 2) from plasmid pBlue-C (Table 1) labeled on the coding strand. Track M is a Maxam-Gilbert G track, and the numbering on the left is relative to the transcription start site. The extent of H-NS protection is depicted by the vertical line on the right. (B) Increasing concentrations of H-NS, as indicated above the tracks, were incubated with fragment H (Fig. 2) from plasmid pBlue-H (Table 1) labeled on the coding strand. Track M is a Maxam-Gilbert G track, and the numbering on the left is relative to the transcription start site. The extent of H-NS protection is depicted by the vertical line on the right.
At 37°C, SlyA bound specifically to the fragment, with 0.4 μM being sufficient to completely retard mobility (Fig. 5A). At 20°C, SlyA bound less well, with a SlyA concentration of 0.6 to 0.7 μM being required to completely retard the same fragment (Fig. 5B). At both temperatures, the binding of SlyA generated a smeared EMSA, which was particularly pronounced at 20°C. This effect is also seen with SlyA binding to PR1 (6). There was no detectable binding to the negative control fragment at any concentration of SlyA at either temperature (Fig. 5A and B). The location of the SlyA binding site at PR3 was determined by DNase I footprinting with pBlue-C (Table 1). This identified a region of SlyA-induced protection between positions −90 and −25 relative to the transcription start site (Fig. 6).
FIG. 5.

SlyA binds to PR3. Shown are EMSAs of purified SlyA incubated with fragment A (as detailed in Fig. 1) together with a negative control consisting of a 200-bp fragment spanning the multiple cloning site (MCS) of pBluescript at either 37°C (A) or 20°C (B). The concentrations of SlyA are indicated above the lanes, and lane M contains molecular weight markers. Free DNA and protein-DNA complexes are indicated on the right.
FIG. 6.
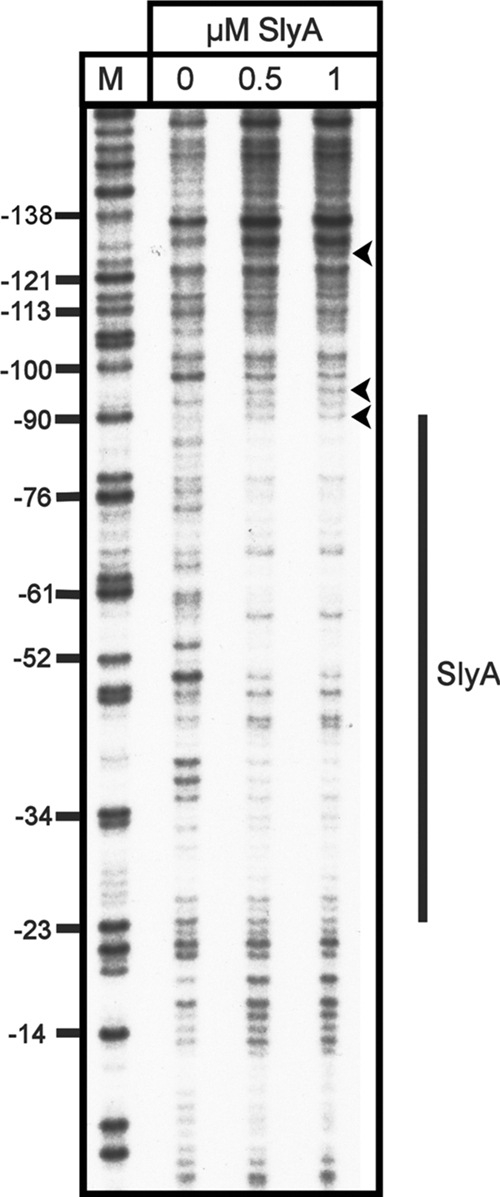
DNase I footprint analysis of SlyA binding to PR3. Increasing concentrations of SlyA, as indicated above the tracks, were incubated with fragment C (Fig. 2) from plasmid pBlue-C (Table 1) labeled on the coding strand. Track M is a Maxam-Gilbert G track, and the numbering on the left is relative to the transcription start site. The extent of SlyA protection is depicted by the vertical line to the right, and three hypersensitive sites are depicted by arrowheads.
Competitive DNase I footprinting was used to provide more detailed information regarding the simultaneous occupation of PR3 by H-NS and SlyA. In these experiments, the concentration of H-NS was fixed at 0.25 μM while the concentration of SlyA was increased over a range 0.5 to 2.0 μM (Fig. 7). Individually, SlyA and H-NS occupied the regions on PR3 already identified (Fig. 7, lanes 2 and 3). However, upon an increase in the concentration of SlyA, the DNase I footprint changed. At the lowest concentration of SlyA (0.5 μM), the H-NS footprint in the region from −100 to −135 changed, with the restoration of bands indicating that H-NS was no longer able to protect these areas from DNase I digestion (Fig. 7, compare lanes 3 and 4). The H-NS protection in the region from −50 to −23 also disappeared upon the addition of SlyA (Fig. 7, compare lanes 3 and 4). This indicates that in the presence of both proteins, a novel DNase I footprint was generated, suggesting that SlyA was not merely displacing H-NS at this site. In the region from −110 to −48, a novel DNase I footprint was generated that was different from that generated by either SlyA or H-NS alone (Fig. 7, lanes 4 to 6). At higher concentrations of SlyA, there was an increase in the intensity of bands in the region of −61, −51, and −48, indicating that a hypersensitive site was generated at these points that was absent when either SlyA or H-NS was used alone (Fig. 7, lanes 4 to 6). Similarly increasing the concentration of SlyA resulted in a novel footprint around −106 and −110 and at two regions around −150 and −155 (Fig. 7, compare lanes 2 and 3 with lane 6). Likewise, the hypersensitive site in the region of −130 generated by SlyA binding disappeared in the presence of both proteins (Fig. 7, compare lanes 2 and 6). Similar DNase I digestion patterns were identified when the concentration of SlyA was fixed and increasing concentrations of H-NS were added to the reaction mixture (data not shown). Together, these data indicate that in the presence of both proteins a structurally reconfigured nucleoprotein complex is generated at PR3.
FIG. 7.
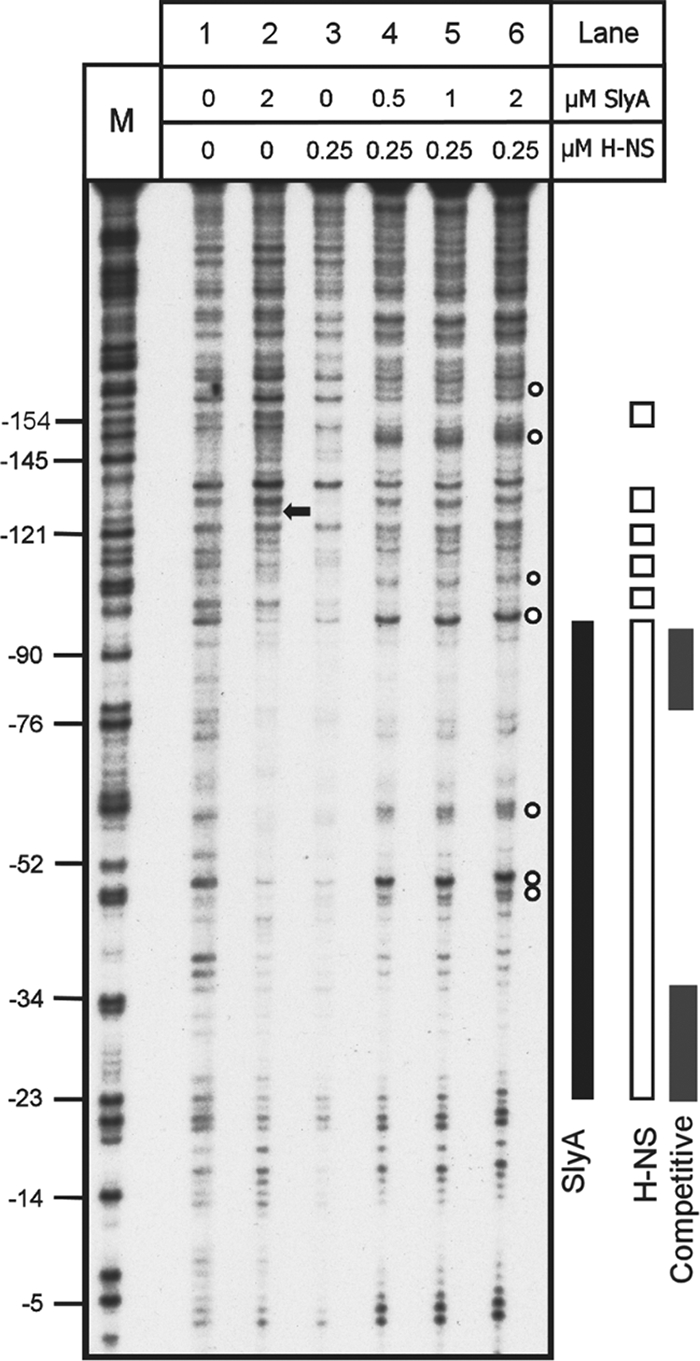
Competitive DNase I footprint analysis of PR3 with both H-NS and SlyA. Fragment C (Fig. 2) from plasmid pBlue-C (Table 1) was end labeled and incubated with SlyA, H-NS, or both at the concentrations indicated above the tracks and treated with DNase I. Track M is a Maxam-Gilbert G track, and the numbering on the left is relative to the transcription start site. Footprints are represented to the right by a solid black bar (SlyA), open bars (H-NS), and gray bars (competitive footprint H-NS and SlyA). The black arrow denotes a SlyA-dependent hypersensitive site that is lost in the combined footprint. The empty circles denote hypersensitive sites present in the combined footprint.
DISCUSSION
The data presented in this paper add significantly to our understanding of the regulation of group 2 capsule gene expression. The data indicate a complex pattern of regulation of transcription from PR3 with a number of interesting features. PR3 is temperature regulated, and maximal transcription required both H-NS and SlyA. By EMSA and DNase I footprinting, it was possible to show an interaction between H-NS and PR3. DNase I footprinting showed that H-NS gave a typically large footprint protecting a region from −135 to −21 with a second region extending from +141 to +219 (Fig. 4). Large footprints with extended areas of protection are often seen with H-NS-regulated genes (2, 26, 37). The importance of the binding of H-NS 3′ of the transcription start site in temperature-dependent repression of PR3 is illustrated by plasmids pRSA-12 and pRSA-17, in both of which this 3′ region is deleted and both of which have lost temperature regulation (Table 3). The identification of H-NS binding sites 3′ of the transcription start site has been seen with a number of H-NS-regulated genes (7, 17, 21, 22, 28), of which the proU and bgl operons are best characterized (7, 20). Both the proU and bgl operons have upstream regulatory elements (UREs) and DREs that are essential for H-NS repression (20). It has been demonstrated that binding of H-NS at the bgl DRE inhibits transcription initiation at a step prior to open complex formation (20) in a manner similar to that previously described for H-NS repression via the proU DRE (13). It is unclear whether H-NS repression via a DRE is a consequence of RNA polymerase (RNAP) being trapped in a closed complex or whether RNAP is excluded (20). A number of models have been proposed for the repression of transcription by H-NS via a DRE. Where the DRE is located in close proximity to the promoter, H-NS bridging between the URE and DRE may occur (2, 3, 17). Alternatively, H-NS bound at the URE and DRE may form bridges with other upstream and downstream sequences to form a stable nucleoprotein complex (20). Clearly, this demonstrates that protein-protein interactions between distantly bound H-NS molecules are important in H-NS-mediated repression (9). The identification of H-NS binding sites 5′ and 3′ of PR3 and the essential nature of the 3′ site for temperature-dependent H-NS repression argue that a similar system involving both a URE and a DRE is operating at PR3. In this case, the URE would be located between −135 and −21 with the DRE located between +141 and +219. The relatively close proximity of the URE and DRE might suggest that at PR3 H-NS bridging is occurring (9), but one must be cautious in reaching a firm conclusion.
Recently, a consensus sequence (TCGATAAATT) for high-affinity H-NS binding has been identified (15). It has been proposed that H-NS silencing of genes is achieved by the initial binding and nucleation of H-NS to these high-affinity sites, followed by the subsequent spread of the H-NS along the AT-rich DNA (15). The presence of multiple copies of this signature sequence boosts H-NS binding and subsequent gene silencing (9). A potential high-affinity H-NS site with an 8/10 match to the consensus sequence was identified centered at +144, which may be important in the initial recruitment of H-NS to this DRE site. No such matches to the consensus sequence were detectable in the URE region between −135 and −21.
By EMSA and DNase I footprinting, it was possible to demonstrate interactions between SlyA and PR3 and identify the SlyA binding site 5′ of the transcriptional start site between −90 and −25 (Fig. 6). A consensus binding sequence (TTAGCAAGCTAA) has been identified for SlyA in Salmonella enterica serovar Typhimurium (31). An 8/12 match to this consensus sequence was identified within the SlyA binding region in PR3, −83TTAtCAAcaTtA−72 (lowercase letters denote mismatches). The structures of both the E. coli MarR and Enterococcus faecalis SlyA-like proteins have been determined, and based on this it is believed that the binding of SlyA would protect approximately 20 bp of DNA (1, 36). Based on the DNase I footprint at PR3, where SlyA protected a region from −90 to −25, it is likely that three SlyA dimers are binding at this site. The requirement for SlyA is in keeping with that recently reported for activation of transcription from PR1 (6). In this case, SlyA does not merely act to overcome H-NS repression at 37°C but acts in conjunction with H-NS to stimulate transcription from PR1 (6). In the case of PR3, the situation is different, with significant SlyA-mediated activation of transcription occurring in an hns mutant (Table 4). This suggests that while H-NS is not essential for SlyA activity, it is required for maximal transcription from PR3 at 37°C. The mechanism by which H-NS maximizes transcription from PR3 at 37°C in conjunction with SlyA is unclear. One possibility is that there is a temperature-mediated topological change in PR3 that affects the relative positioning of H-NS on the promoter and permits transcription to occur in a manner similar to that of the virF promoter in Shigella (24). The finding that in the double mutant there was no transcription from PR3 at 20°C (Table 4) indicates that the increased transcription from PR3 at 20°C in an hns mutant is mediated by SlyA. This suggests that in the wild type at 20°C transcription is repressed by H-NS at PR3 and that SlyA is unable to overcome this repression. Indeed, the EMSA showed that SlyA bound PR3 less well at 20°C (Fig. 5B). However, in an hns mutant lacking H-NS there is sufficient SlyA to activate transcription at 20°C. Critical to this regulation will be the relative concentrations of these two proteins in the cell at 20°C and 37°C. H-NS is very abundant at both temperatures (8), whereas slyA expression is temperature dependent, with reduced transcription at 20°C (6). Therefore, the combination of less SlyA and a lower affinity for PR3 would favor H-NS repression at 20°C. However, at 37°C increasing concentrations of SlyA will alter the relative balance between SlyA and H-NS and this, coupled with an increased affinity of SlyA for PR3 at 37°C, will promote transcription.
The observation that in a competitive DNase I footprinting assay H-NS and SlyA together generated a novel footprint similar to, yet different from, that generated by either regulator alone (Fig. 7) indicates that the presence of SlyA does not displace H-NS but rather that a new nucleoprotein complex containing both H-NS and SlyA is formed at PR3. This is in keeping with the β-galactosidase data that demonstrated a requirement for H-NS for the maximal activation of transcription from PR3 at 37°C (Table 4). Our interpretation of the data, taken as a whole, is that SlyA and H-NS are acting in concert at 37°C to maximize transcription in a manner analogous to but different from that established for the regulation of PR1 (6). The finding that SlyA and H-NS are required for transcription from both PR1 and PR3 at 37°C will allow the coordinated activation of these promoters in response to temperature.
The location of the transcriptional start site 741 bp 5′ of the ATG of kpsM (33) and the presence of a large 5′ UTR raised questions about the possible role of this region in regulating expression from PR3. We had previously shown that the ops site essential for RfaH regulation and readthrough transcription into region 2 is present in the UTR, being centered 28 bp 5′ of the ATG of kpsM (23, 32). In this paper, we are able to assign additional functions to this UTR. First, the deletion of the UTR and fusion of PR3 directly to lacZ to generate plasmid pRSC lead to very high levels of β-galactosidase activity and abolition of temperature regulation (Table 2). This indicates that the UTR is involved in both mediating temperature regulation via the H-NS DRE and moderating the degree of transcription reaching kpsM. Analysis of progressive deletions of the UTR showed that although there is a dramatic increase in β-galactosidase activity as the UTR gets smaller (Table 3; Fig. 2), temperature regulation is only lost when the 3′ H-NS DRE is deleted (compare plasmid pRSA-11 to plasmid pRSA-12). The progressive increase in β-galactosidase activity observed as the UTR is shortened in both the wild type and the hns mutant is in keeping with a role for the UTR in moderating the level of transcription that reaches kpsM. In part, this will reflect the relative distance traveled by RNAP before reaching the lacZ gene. However, we cannot preclude the possibility that other regulatory components are acting on the UTR to block the efficient passage of RNAP. Overall, the effect of the large 5′ UTR is to dampen down the level transcription originating from PR3 that reaches kpsM. This use of a large UTR to moderate transcription generated from a powerful promoter would appear a curious method of regulation and, to our knowledge, is the first such example in E. coli. To establish if the UTR is important in mRNA stability, we determined the half-life of lacZ mRNA in cells carrying either pRSA or pRSC following the addition of rifampin. The presence of the UTR had no effect on the half-life of the lacZ mRNA (data not shown). While these data support a role for the UTR in moderating transcription that reaches kpsM, it is not possible for us to rule out the possibility that the UTR is also having a posttranscriptional effect, possibly affecting the efficiency of translation of kpsM.
In E. coli, the expression of a number of genes that encode outer membrane proteins is regulated by untranslated small RNAs (sRNAs) (10). The mode of action of sRNAs is to base pair with the target mRNA, usually around the ribosome binding site, and thereby affect the stability and translatability of the mRNA (10). To determine if there are sequences in the E. coli genome homologous to the UTR that could potentially function as sRNAs, we carried out a BLASTN analysis with a 20-bp fragment spanning the ribosome binding site. This demonstrated no significant sequence identity between this region and sequences in any of the sequenced E. coli genomes (data not shown). This suggests that a trans-acting sRNA is unlikely to be interacting with the UTR to affect the translation of the mRNA. However, we cannot rule out the possibility that a novel mechanism not requiring complementary sRNA, for example, the ipeX system used in the posttranscriptional control of ompC expression (4), is in operation here. Analysis of the UTR sequence showed that there are multiple stop codons in all six frames with no open reading frames starting with either methionine or valine. This, coupled with BLASTP searches which failed to detect any significant hits (data not shown), is in keeping with the notions that this region is untranslated and that no small regulatory proteins are encoded within this region. Arabinose-induced expression of the UTR cloned in either orientation into the multiple cloning site of pBAD33 had no effect on β-galactosidase activity expressed from pRSA (data not shown), indicating that the presence of trans-acting factors in this region is unlikely.
In summary, we have shown that H-NS binds 5′ and 3′ of the transcriptional start site and that the DRE is essential for H-NS-dependent temperature regulation of transcription from PR3. At 37°C, H-NS acts with SlyA to activate transcription in a manner analogous to, but different from, that identified for PR1. This apparent coactivation by H-NS and SlyA at PR3 is another example of how H-NS may function to promote transcription. The large UTR seems to be important in moderating the level of transcription that reaches kpsM, as well as mediating temperature regulation through the H-NS DRE. The net effect of a long UTR will be to effectively reduce transcription that reaches the first gene in the operon. The combination of a powerful promoter and a long intervening UTR to moderate transcription reaching the operon is a novel mechanism to regulate gene expression in E. coli. Although we could probably preclude a role for sRNAs in regulating expression from PR3, we cannot preclude the possibility that the UTR has additional regulatory functions in expression from PR3. Experiments are currently in progress to further delineate the role of this region.
Acknowledgments
This work in the laboratory of Ian Roberts is supported by the BBSRC and MRC of the United Kingdom, and David Corbett gratefully acknowledges the award of a BBSRC studentship.
Footnotes
Published ahead of print on 29 December 2008.
REFERENCES
- 1.Alekshun, M. N., S. B. Levy, T. R. Mealy, B. A. Seaton, and J. F. Head. 2001. The crystal structure of MarR, a regulator of multiple antibiotic resistance at 2.3 Å resolution. Nat. Struct. Biol. 8710-714. [DOI] [PubMed] [Google Scholar]
- 2.Badaut, C., R. Williams, V. Arluison, E. Bouffartigues, B. Robert, H. Buc, and S. Rimsky. 2002. The degree of oligomerization of the H-NS nucleoid structuring protein is related to specific binding to DNA. J. Biol. Chem. 27741657-41666. [DOI] [PubMed] [Google Scholar]
- 3.Bouffartigues, E., M. Buckle, C. Badaut, A. Travers, and S. Rimsky. 2007. H-NS cooperative binding to high-affinity sites in a regulatory element results in transcriptional silencing. Nat. Struct. Mol. Biol. 14441-448. [DOI] [PubMed] [Google Scholar]
- 4.Castillo-Keller, M., P. Vuong, and R. Misra. 2006. Novel mechanism of Escherichia coli porin regulation. J. Bacteriol. 188576-586. [DOI] [PMC free article] [PubMed] [Google Scholar]
- 5.Chang, A. C., and S. N. Cohen. 1978. Construction and characterization of amplifiable multicopy DNA cloning vehicles derived from the P15A cryptic miniplasmid. J. Bacteriol. 1341141-1156. [DOI] [PMC free article] [PubMed] [Google Scholar]
- 6.Corbett, D., H. J. Bennett, H. Askar, J. Green, and I. S. Roberts. 2007. SlyA and H-NS regulate transcription of the Escherichia coli K5 capsule gene cluster and expression of slyA in Escherichia coli is temperature dependent, positively autoregulated and independent of H-NS. J. Biol. Chem. 28233326-33335. [DOI] [PubMed] [Google Scholar]
- 7.Dole, S., V. Nagarajavel, and K. Schnetz. 2004. The histone-like nucleoid structuring protein H-NS represses the Escherichia coli bgl operon downstream of the promoter. Mol. Microbiol. 52589-600. [DOI] [PubMed] [Google Scholar]
- 8.Dorman, C. J., J. C. Hinton, and A. Free. 1999. Domain organization and oligomerization among H-NS-like nucleoid-associated proteins in bacteria. Trends Microbiol. 7124-128. [DOI] [PubMed] [Google Scholar]
- 9.Fang, F., and S. Rimsky. 2008. New insights into transcriptional regulation by H-NS. Curr. Opin. Microbiol. 11113-120. [DOI] [PMC free article] [PubMed] [Google Scholar]
- 10.Guillier, M., S. Gottesman, and G. Storz. 2006. Modulating the outer-membrane with small RNAs. Genes Dev. 202338-2348. [DOI] [PubMed] [Google Scholar]
- 11.Hillmann, D., I. Eschenbacher, A. Thiel, and M. Niederweis. 2007. Expression of the major porin gene mspA is regulated in Mycobacterium smegmatis. J. Bacteriol. 189958-967. [DOI] [PMC free article] [PubMed] [Google Scholar]
- 12.Hobbs, M., and P. R. Reeves. 1994. The JUMPstart sequence: a 39 bp element common to several polysaccharide gene clusters. Mol. Microbiol. 12855-856. [DOI] [PubMed] [Google Scholar]
- 13.Jordi, B. M. J. A., and C. F. Higgins. 2000. The downstream regulatory element of the proU operon of Salmonella typhimurium inhibits open complex formation by RNA polymerase at a distance. J. Biol. Chem. 27512123-12128. [DOI] [PubMed] [Google Scholar]
- 14.Konkel, M. E., and K. Tilly. 2000. Temperature-regulated expression of bacterial virulence genes. Microbes Infect. 2157-166. [DOI] [PubMed] [Google Scholar]
- 15.Lang, B., N. Blot, E. Bouffartigues, M. Buckle, M. Geertz, C. O. Gualerzi, R. Mavathur, G. Muskhelishvili, C. L. Pon, S. Rimsky, S. Stella, M. M. Babu, and A. Travers. 2007. High-affinity DNA binding sites for H-NS provide a molecular basis for selective silencing within proteobacterial genomes. Nucleic Acids Res. 356330-6337. [DOI] [PMC free article] [PubMed] [Google Scholar]
- 16.Lithgow, J. K., F. Haider, I. S. Roberts, and J. Green. 2007. Alternate SlyA and H-NS nucleoprotein complexes control hlyE expression in Escherichia coli K-12. Mol. Microbiol. 66685-698. [DOI] [PMC free article] [PubMed] [Google Scholar]
- 17.Lucht, J. M., P. Dersch, B. Kempf, and E. Bremer. 1994. Interactions of the nucleoid-associated DNA-binding protein H-NS with the regulatory region of the osmotically controlled proU operon of Escherichia coli. J. Biol. Chem. 2696578-6586. [PubMed] [Google Scholar]
- 18.Maxam, A. M., and W. Gilbert. 1980. Sequencing end-labeled DNA with base-specific chemical cleavages. Methods Enzymol. 65499-560. [DOI] [PubMed] [Google Scholar]
- 19.Miller, J. H. 1972. Experiments in molecular genetics, p. 352-355. Cold Spring Harbor Laboratory, Cold Spring Harbor, NY.
- 20.Nagarajavel, V., S. Mudhussudan, S. Dole, A. Rachid Rahmouni, and K. Schnetz. 2007. Repression by binding of H-NS within the transcriptional unit. J. Biol. Chem. 28223622-23630. [DOI] [PubMed] [Google Scholar]
- 21.Olekhhnovich, I. N., and R. J. Kadner. 2006. Crucial roles of both flanking sequences in silencing of the hilA promoter in Salmonella enterica J. Mol. Biol. 357373-386. [DOI] [PubMed] [Google Scholar]
- 22.Overdier, D. G., and L. N. Csonka. 1992. A transcriptional silencer downstream of the promoter in the osmotically controlled proU operon of Salmonella typhimurium. Proc. Natl. Acad. Sci. USA 893140-3144. [DOI] [PMC free article] [PubMed] [Google Scholar]
- 23.Petit, C., G. Rigg, C. Pazzani, A. N. Smith, V. Sieberth, M. Stevens, G. J. Boulnois, K. Jann, and I. S. Roberts. 1995. Analysis of region 2 of the Escherichia coli K5 capsule gene cluster: a region encoding proteins for the biosynthesis of the K5 polysaccharide. Mol. Microbiol. 17611-620. [DOI] [PubMed] [Google Scholar]
- 24.Prosseda, G., M. Falconi, M. Giangrossi, C. O. Gualerzi, G. Micheli, and B. Colonna. 2004. The virF promoter of Shigella: more than just a curved DNA stretch. Mol. Microbiol. 51523-537. [DOI] [PubMed] [Google Scholar]
- 25.Rahn, A., and C. Whitfield. 2003. Transcriptional organization and regulation of the Escherichia coli K30 group 1 capsule biosynthesis (cps) gene cluster. Mol. Microbiol. 471045-1060. [DOI] [PubMed] [Google Scholar]
- 26.Rimsky, S., F. Zuber, M. Buckle, and H. Buc. 2001. A molecular mechanism for the repression of transcription by the H-NS protein. Mol. Microbiol. 421311-1323. [DOI] [PubMed] [Google Scholar]
- 27.Rowe, S., N. Hodson, G. Griffiths, and I. S. Roberts. 2000. Regulation of the Escherichia coli K5 capsule gene cluster: evidence for the roles of H-NS, BipA, and IHF in regulation of group II capsule gene clusters in pathogenic E. coli. J. Bacteriol. 1822741-2745. [DOI] [PMC free article] [PubMed] [Google Scholar]
- 28.Schnetz, K. 1995. Silencing of Escherichia coli bgl promoter by flanking sequence elements. EMBO J. 142545-2550. [DOI] [PMC free article] [PubMed] [Google Scholar]
- 29.Simons, R. W., F. Houman, and N. Kleckner. 1987. Improved single and multicopy lac-based cloning vectors for protein and operon fusions. Gene 5385-96. [DOI] [PubMed] [Google Scholar]
- 30.Simpson, D. A., T. A. C. Hammarton, and I. S. Roberts. 1996. Transcriptional organization and regulation of expression of the Escherichia coli K5 capsule gene cluster. J. Bacteriol. 1786466-6474. [DOI] [PMC free article] [PubMed] [Google Scholar]
- 31.Stapleton, M. R., V. A. Norte, R. C. Read, and J. Green. 2002. Interaction of the Salmonella typhimurium transcription and virulence factor SlyA with target DNA and identification of members of the SlyA regulon. J. Biol. Chem. 27717630-17637. [DOI] [PubMed] [Google Scholar]
- 32.Stevens, M. P., B. R. Clarke, and I. S. Roberts. 1997. Regulation of the Escherichia coli K5 capsule gene cluster by transcription antitermination. Mol. Microbiol. 241001-1012. [DOI] [PubMed] [Google Scholar]
- 33.Stevens, M. P., P. Hanfling, B. Jann, K. Jann, and I. S. Roberts. 1994. Regulation of Escherichia coli K5 capsular polysaccharide expression: evidence for involvement of RfaH in the expression of group II capsules. FEMS Microbiol. Lett. 12493-98. [DOI] [PubMed] [Google Scholar]
- 34.Whitfield, C. 2006. Biosynthesis and assembly of capsular polysaccharides in Escherichia coli Annu. Rev. Biochem. 7539-68. [DOI] [PubMed] [Google Scholar]
- 35.Whitfield, C., and I. S. Roberts. 1999. Structure, assembly and regulation of expression of capsules in Escherichia coli. Mol. Microbiol. 311307-1319. [DOI] [PubMed] [Google Scholar]
- 36.Wu, R. Y., R. G. Zhang, O. Zagnitko, I. Dementieva, N. Maltzev, J. D. Watson, R. Laskowski, P. Gornicki, and A. Joachimiak. 2003. Crystal structure of Enterococcus faecalis SlyA-like transcriptional factor. J. Biol. Chem. 27820240-20244. [DOI] [PMC free article] [PubMed] [Google Scholar]
- 37.Wyborn, N. R., M. R. Stapleton, V. A. Norte, R. E. Roberts, J. Grafton, and J. Green. 2004. Regulation of Escherichia coli hemolysin E expression by H-NS and Salmonella SlyA. J. Bacteriol. 1861620-1628. [DOI] [PMC free article] [PubMed] [Google Scholar]