Abstract
Since conventional absorption models often fail to describe plasma concentration–time profiles following oral administration, empirical input functions such as the inverse Gaussian function (IG) have been successfully used. The purpose of this note is to extend this model by adding a first-order absorption process and to demonstrate the application of population analysis using maximum likelihood estimation via the EM algorithm (implemented in ADAPT 5). In one example, the analysis of bioavailability data of an extended release formulation, the mean dissolution times estimated in vivo and in vitro with the use of the IG are well in accordance suggesting that the IG indeed accounts for the in vivo dissolution process. In the other example, the kinetics of trapidil in patients with liver disease, the absorption/dissolution parameters are characterized by a high interindividual variability. Adding a first-order absorption process to the IG improved the fit in both cases.
Keywords: bioavailability, drug absorption, extended release, population pharmacokinetics, ADAPT
INTRODUCTION
Modeling the process of drug input to the systemic circulation is of central importance for fitting plasma concentration-time data following oral administration. In some cases, simple models (e.g., first-order absorption) may be sufficient. The popular first-order absorption model, however, implies the unrealistic assumption that the maximum absorption rate is achieved instantaneously. Thus, more flexible descriptions of drug input process (comprising dissolution and absorption) are often required. To address this problem, both nonparametric deconvolution methods (for review see Verotta, 1996)1 as well as parametric modeling approaches (for review see Zhou, 2003)2 have been proposed. After one of us3 proposed the inverse Gaussian (IG) function as flexible empirical input function, it has been used to describe drug input for various extravascular administration routes.4–8 Since the IG distribution has been found to be a suitable model for in vitro dissolution profiles 9, its usefulness for oral extended release formulations3, 7 is not surprising. It may be of interest to note that the IG is the first passage time distribution of a random walk with drift (first suggested by Schrödinger (1915)10) and the solution of the convection-dispersion equation for pharmacokinetically relevant boundary conditions (Roberts et al., 2000)11. The IG function has also been widely used to model the transit of drugs through organs and organ systems.12, 13
The purpose of this note is twofold: 1 ) to illustrate the implementation of an IG input function in a compartmental disposition model for a population analysis of plasma concentration-time data following intravenous and oral data drug administration using ADAPT and 2) to extend the input model by adding a first-order absorption process to the IG function. The models presented are incorporated as part of the distributed library of the ADAPT software (version 5) for pharmacokinetic/pharmacodynamic systems analysis.
METHODS
Input Models
It is assumed that the plasma drug concentration following an oral administration of drug can be decomposed into an independent input process (representing the dissolution and absorption process) followed by the disposition process. The following single inverse Gaussian function can be used to model the complete input process.
| (1) |
where MIT represents the mean input time and is a normalized variance (CVI is the standard deviation of the density function fI (t)/(D · F ) divided by MIT , i.e., the relative dispersion of input times). The factor F is the bioavailability of the orally administered dose D . One can also calculate the mode of the inverse Gaussian density as follows:
| (2) |
which is the time the input function achieves its maximum value (see Weiss, 1996).3 As a single measure, tI ,max provides useful information about the input process.
Alternatively, the input process can itself be decomposed into an independent dissolution (or gastrointestinal transit time) component followed by an absorption component. Such a dissolution-absorption process can be modeled using an inverse Gaussian function to describe the drug’s dissolution/transit (using the parameters MDT and CVD ) followed by a first-order absorption model (with rate constant ka = 1/MAT ). In this case, the mean input time is the sum, MIT = MDT + MAT.
Study Designs and Data
In the first example, data from a previously described bioavailability study3 of an undisclosed oral extended-release product are used to illustrate the method. Briefly, 10 subjects received both the oral and intravenous administration of the compound at the same dose in a cross-over design. A total of 19 (oral) and 24 (i.v.) plasma concentrations were collected between 5 min and 32 hours (1920 min) after the drug administration.
The second example involves the anti-ischemic drug trapidil. In this study, 12 patients with chronic liver disease were administrated 100 mg of trapidil as a single intravenous bolus and 200 mg of trapidil as an oral dosage (Rocornal® dragees 100 mg) in a crossover design. The intravenous data were published previously.14 For the intravenous administration, 17 plasma samples were obtained between 5 and 420 min after injection, while 17 samples were taken between 15 and 480 min after oral administration.
Population Modeling
Intravenous plasma concentration-time data were analyzed via population modeling using one, two and three compartment linear models. Model selection was based on the AIC criterion. Population analysis was performed using maximum likelihood (ML) estimation (no linearizing approximations) via the EM algorithm as proposed by Schumitzky15 and fully developed by Walker.16 A program (MLEM) implementing this approach is available in the general PK/PD systems analysis software ADAPT.17 In addition to calculating the ML estimates for the population mean and covariance (inter-subject variability), estimates for the individual subject parameters (conditional means) are also available.
Population analyses of the oral plasma concentration-time data were conducted using each of the two input models described previously: the single IG model of Eq. (1) (IG model), and the IG dissolution/transit plus first order absorption process (IG/MAT model). For each analysis, the disposition model parameters for each subject were fixed at their conditional mean values determined from the intravenous population analysis (sequential analysis). As with the intravenous analyses, a lognormal population parameter model was assumed along with a proportional output error variance model.
RESULTS
Extended-Release Example
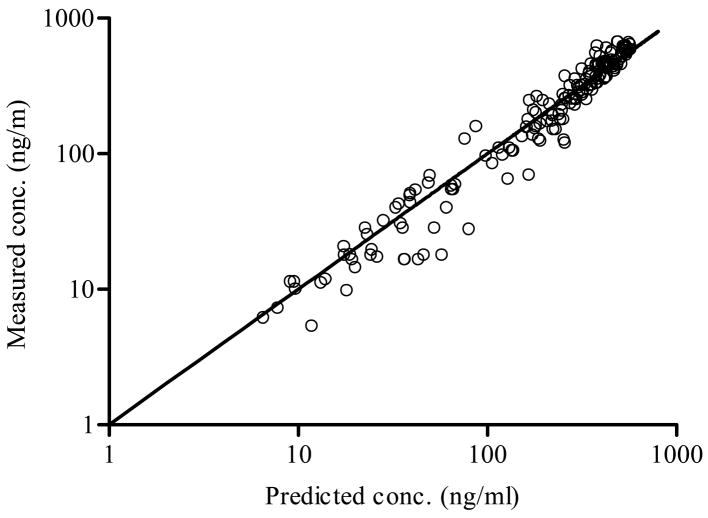
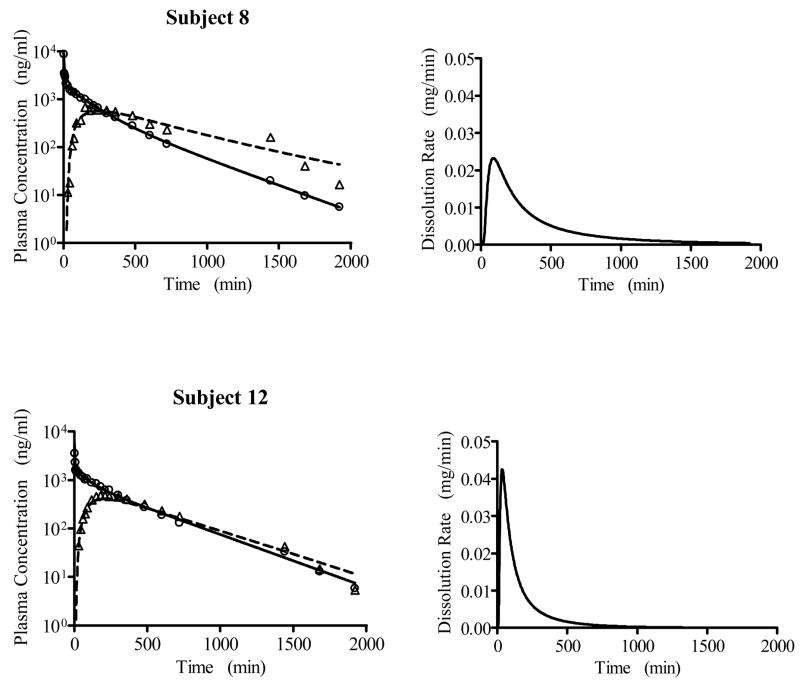
Based on the population modeling of the intravenous plasma concentration-time data, a 3-compartment disposition model was selected, as also found by the three-exponential model fit reported in Weiss, 1996.3 The results of the population analysis of the oral plasma concentration-time data are presented in Table 1 for the IG model and the IG/MAT model. The latter led to a smaller AIC value, with approximately 90% of the mean input time attributed to the dissolution process (see discussion). The IG/MAT model results in a larger estimated maximum input rate than does the IG model. In Figure 1, the measured oral plasma concentration-time data are shown versus their predicted values based on the conditional mean estimates for each subject’s parameters for the IG/MAT model. Figure 2 shows the predicted and observed intravenous and oral plasma concentration-time data for two subjects representing the largest and smallest values of MDT, along with the corresponding dissolution rate functions from the IG component of the input process.
Table 1.
Comparison of the population analysis of oral data for the extended release dosage form using the two different input models.
| IG/MAT model |
IG model |
||||||
|---|---|---|---|---|---|---|---|
| Pop. Mean | Pop. SD | Pop. Mean | Pop. SD | ||||
| F (%) | 69.9 | 9.22 | F (%) | 69.8 | 9.10 | ||
| MDT (min) | 318. | 115. | MIT (min) | 332. | 77.7 | ||
| MAT (min) | 33.9 | 14.4 | |||||
|
|
1.93 | 0.369 |
|
1.22 | 0.178 | ||
| tD,max | 53.4 | 19.8 | tI ,max | 84.8 | 19.7 | ||
| AIC | 1954. | 1970. | |||||
Figure 1.
The measured oral (O) plasma concentration-time data of the extended release drug versus their predicted values based on each subject’s parameter estimates (conditional means) from the IG/MAT model.
Figure 2.
Predicted (lines) and measured (symbols) plasma versus time data for two subjects treated with the sustained release drug, together with the corresponding predicted dissolution/transit functions from the IG/MAT model. The individual subject results (conditional means) are as follows: Subject 8 - MDT = 554 min, MAT =16.2 min, , F =87.0 % , tD,max= 88.3 min; Subject 12 - MDT = 191 min, MAT =51.8 max min, , F =59.2 %, tD,max= 34.5 min.
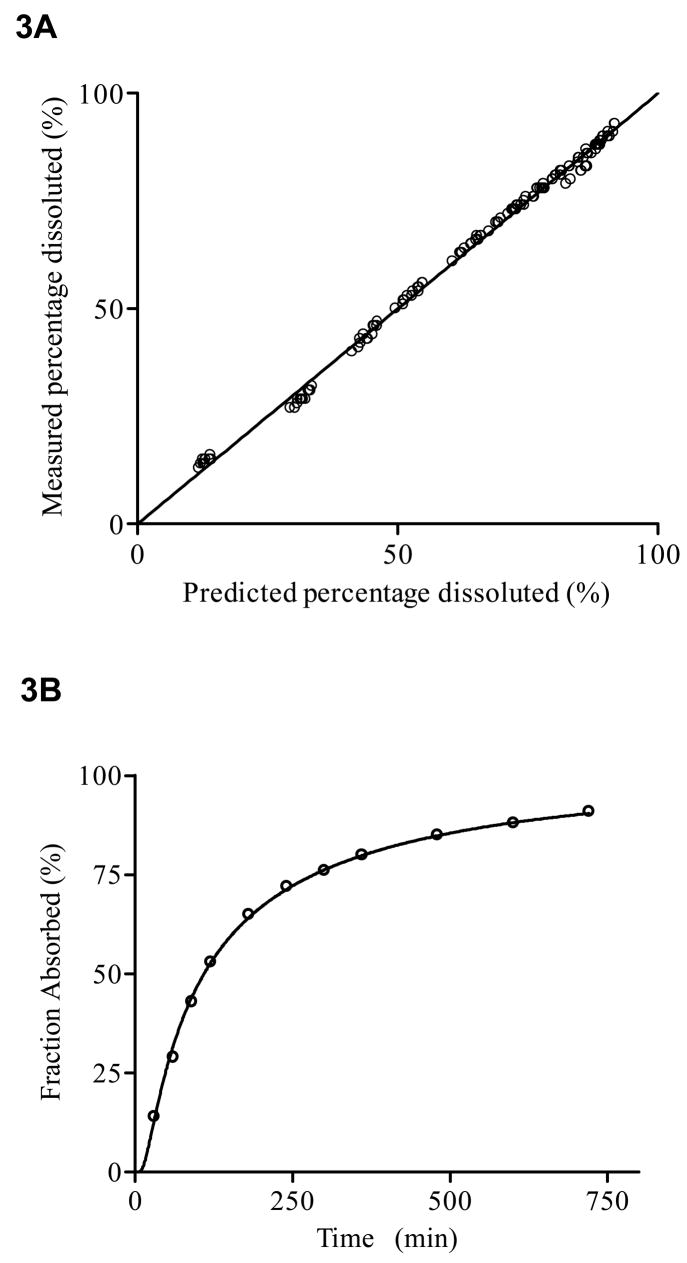
An IG distribution function (i.e., ) was also fitted to in vitro dissolution data of this extended release formulation (population analysis of 12 dissolution profiles), which resulted in a mean MDT = 302 min (SD = 39 min) and a relative dispersion (SD = 0.47). Figure 3 shows the measured data versus their predicted values obtained by the population fit of the dissolution data together with a representative dissolution profile.
Figure 3.
Analysis of in vitro dissolution profile of 12 extended release formulations: Measured data versus predicted individual concentration values (3A) along with a representative example of a fitted model (3B).
Trapidil Example
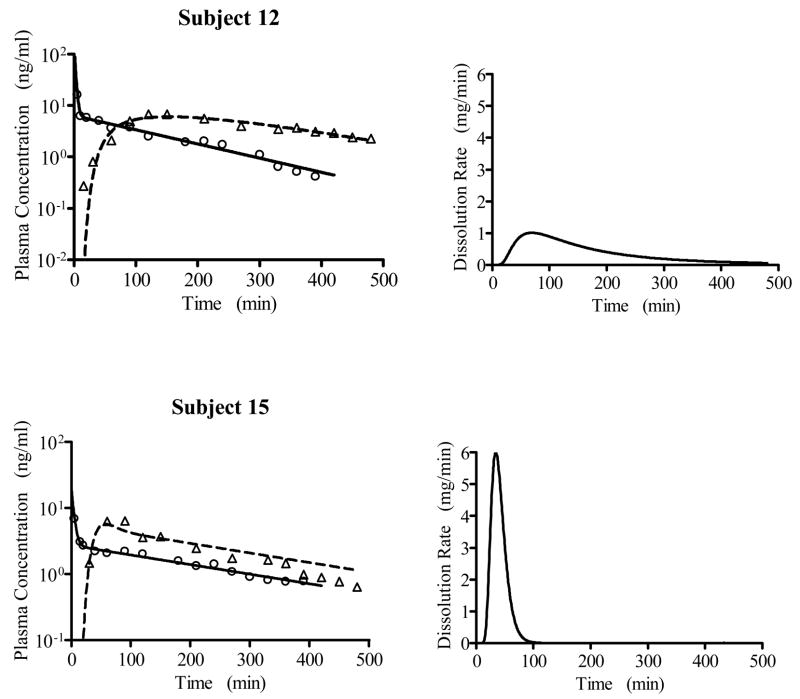
In accordance with the previous 2-exponential fit14, a 2-compartment disposition model was selected to describe the trapidil intravenous plasma concentration-time data based on the population analysis (results not shown). The population analysis results using the IG and IG/MAT model to fit the oral trapidil data are presented in Table 2, with the IG/MAT model resulting in a lower AIC value. The predicted and observed intravenous and oral plasma concentration-time data for two subjects representing the largest and smallest values of MDT are shown in Figure 4, together with the predicted dissolution/transit rate functions.
Table 2.
Comparison of the population analysis of Trapidil oral data using the two different input models.
| IG/MAT model |
IG model |
||||||
|---|---|---|---|---|---|---|---|
| Pop. Mean | Pop. SD | Pop. Mean | Pop. SD | ||||
| F (%) | 90.2 | 31.9 | F (%) | 90.5 | 30.9 | ||
| MDT (min) | 100. | 50.4 | MIT (min) | 134. | 59.8 | ||
| MAT (min) | 30.6 | 25.9 | |||||
|
|
1.64 | 2.83 |
|
0.740 | 0.788 | ||
| tD,max | 19.6 | 29.6 | tI,max | 51.7 | 26.6 | ||
| AIC | 235. | 250. | |||||
Figure 4.
Predicted (lines) and measured (symbols) plasma versus time data for two subjects treated with trapidil, together with the corresponding predicted dissolution/transit functions from the IG/MAT model. The individual subject results (conditional means) are as follows: Subject 12 - MDT =184 min, MAT =11.2 min, , F =92.3 %, tD,max=69.7 min; Subject 15 - MDT = 40.0 min, MAT =12.1 min, , F =87.8 %, tD,max= 34.0 min.
DISCUSSION
As summarized in Table 1, the extended release example data were best described by an input model that included a dissolution component modeled as an inverse Gaussian followed by a first order absorption process. The modeling results indicate that approximately 90% of the mean input time is due to the dissolution process with 10% due to the absorption process. Simultaneous population analysis was also performed by fitting both the Cpo and Civ data together (results not shown). The parameter estimates are comparable to the corresponding kinetic parameters from the sequential population analysis.
A comparison of the in vivo estimate of MDT (318. min, see Table 2) with the in vitro MDT of 302 min suggests that the IG function essentially represents dissolution of the formulation as the rate-limiting input process. As expected, the in vitro inter-tablet variability (13%) of MDT is lower than the inter-subject variability (36 %). It is also not surprising that the shape of the calculated in vivo dissolution rate profile differs from that measured in vitro (shape parameter vs. 3.72).
In the trapidil example, the modeling results indicate that approximately 75% of the mean input time is due to the dissolution/transit process with 25% due to the absorption process (Table 2). That the inter-subject variability in the input process (approximately 50% CV in MDT , 150% CV in tD,max and 85% CV in MAT) is much higher than that observed in healthy volunteers (Table 1) can be explained by the effect of liver disease on the absorption process in these patients (see below). This example also illustrates that for a sampling regimen that does not sufficiently cover the terminal phase after oral administration, the present method – in contrast to conventional calculation of AUC by numerical methods - allows an estimation of both the extent and rate of bioavailability. The estimate of F is in agreement with the complete bioavailability (95% confidence limits of 90 and 122%) obtained in healthy volunteers18 as suggested by the fact that in patients with liver disease, bioavailability is hardly reduced (but may increase due to a reduced first-pass metabolism). That the mean input time in healthy volunteers is only about 50 % of that in patients is in accordance with a delayed drug absorption process in liver disease.19 In contrast to the extended release example, there is no clear interpretation of the specific role of the components of the IG/MAT model (MAT and MDT).
Taken together with previous applications, these examples further demonstrate the utility of the inverse Gaussian function for modeling extravascular input processes and show that the addition of a first-order absorption process improves the fit of oral data. Inverse Gaussian function models offer a more compact and flexible approach for quantifying extravascular inputs compared to commonly used parametric models (e.g. first-order absorption with lag, zero-order input, etc.), at the expense of a modest increase in computational complexity. This approach avoids biased parameter estimates that are likely to occur if unrealistic models are used3. Compared to nonparametric deconvolution methods, the approach is numerically stable and allows for direct estimation of and inferences based on absorption process parameters; although as implemented it limits the form of the input function (for extension see Verotta, 1996)1. Model building using the inverse Gaussian function can now be performed conveniently as part of population as well as an individual subject analysis using the ADAPT software (version 5), which includes in its library the inverse Gaussian function models presented herein.17
Acknowledgments
This work was supported in part by National Institute of Health grant P41-EB001978.
References
- 1.Verotta D. Concepts, properties, and applications of linear systems to describe distribution, identify input, and control endogenous substances and drugs in biological systems. Crit Rev Biomed Eng. 1996;24(2–3):73–139. doi: 10.1615/critrevbiomedeng.v24.i2-3.10. [DOI] [PubMed] [Google Scholar]
- 2.Zhou H. Pharmacokinetic strategies in deciphering atypical drug absorption profiles. J Clin Pharmacol. 2003;43(3):211–227. doi: 10.1177/0091270002250613. [DOI] [PubMed] [Google Scholar]
- 3.Weiss M. A novel extravascular input function for the assessment of drug absorption in bioavailability studies. Pharm Res. 1996;13(10):1547–1553. doi: 10.1023/a:1016039931663. [DOI] [PubMed] [Google Scholar]
- 4.Csajka C, Drover D, Verotta D. The use of a sum of inverse Gaussian functions to describe the absorption profile of drugs exhibiting complex absorption. Pharm Res. 2005;22(8):1227–1235. doi: 10.1007/s11095-005-5266-8. [DOI] [PubMed] [Google Scholar]
- 5.Karmakar MK, Ho AM, Law BK, Wong AS, Shafer SL, Gin T. Arterial and venous pharmacokinetics of ropivacaine with and without epinephrine after thoracic paravertebral block. Anesthesiology. 2005;103(4):704–711. doi: 10.1097/00000542-200510000-00008. [DOI] [PubMed] [Google Scholar]
- 6.Kirchheiner J, Brockmoller J, Meineke I, et al. Impact of CYP2C9 amino acid polymorphisms on glyburide kinetics and on the insulin and glucose response in healthy volunteers. Clin Pharmacol Ther. 2002;71(4):286–296. doi: 10.1067/mcp.2002.122476. [DOI] [PubMed] [Google Scholar]
- 7.Lotsch J, Weiss M, Ahne G, Kobal G, Geisslinger G. Pharmacokinetic modeling of M6G formation after oral administration of morphine in healthy volunteers. Anesthesiology. 1999;90(4):1026–1038. doi: 10.1097/00000542-199904000-00016. [DOI] [PubMed] [Google Scholar]
- 8.Zhang X, Nieforth K, Lang JM, et al. Pharmacokinetics of plasma enfuvirtide after subcutaneous administration to patients with human immunodeficiency virus: Inverse Gaussian density absorption and 2-compartment disposition. Clin Pharmacol Ther. 2002;72(1):10–19. doi: 10.1067/mcp.2002.125945. [DOI] [PubMed] [Google Scholar]
- 9.Lansky P, Weiss M. Classification of dissolution profiles in terms of fractional dissolution rate and a novel measure of heterogeneity. J Pharm Sci. 2003;92(8):1632–1647. doi: 10.1002/jps.10419. [DOI] [PubMed] [Google Scholar]
- 10.Schroedinger E. Zur Theorie der Fall- und Steigversuche an Teilchen mit Brownscher Bewegung. Phys Z. 1915;16:289–295. [Google Scholar]
- 11.Roberts MS, Anissimov YG, Weiss M. Commentary: using the convection-dispersion model and transit time density functions in the analysis of organ distribution kinetics. J Pharm Sci. 2000;89(12):1579–1586. doi: 10.1002/1520-6017(200012)89:12<1579::aid-jps8>3.0.co;2-y. [DOI] [PubMed] [Google Scholar]
- 12.Weiss M. Modelling of initial distribution of drugs following intravenous bolus injection. Eur J Clin Pharmacol. 1983;24(1):121–126. doi: 10.1007/BF00613938. [DOI] [PubMed] [Google Scholar]
- 13.Weiss M, Krejcie TC, Avram MJ. Transit time dispersion in pulmonary and systemic circulation: effects of cardiac output and solute diffusivity. Am J Physiol Heart Circ Physiol. 2006;291(2):H861–870. doi: 10.1152/ajpheart.01052.2005. [DOI] [PubMed] [Google Scholar]
- 14.Berndt A, Looby M, Ponicke K, Zipprich B, Weiss M. Pharmacokinetics of trapidil in patients with chronic liver disease. J Clin Pharmacol. 1996;36(10):897–902. doi: 10.1002/j.1552-4604.1996.tb04756.x. [DOI] [PubMed] [Google Scholar]
- 15.Schumitzky A. EM Algorithms and two stage methods in pharmacokinetic population analysis. In: D’Argenio DZ, editor. Advanced Methods of Pharmacokinetic and Pharmacodynamic Systems Analysis. II. New York: Plenum Press; 1995. [Google Scholar]
- 16.Walker S. An EM algorithm for nonlinear random effects models. Biometrics. 1996;52:934–944. [Google Scholar]
- 17.ADAPT 5: Pharmacokinetic/Pharmacodynamic Systems Analysis Software. Biomedical Simulations Resource; Los Angeles: 2008. http://bmsr.usc.edu. [Google Scholar]
- 18.Weiss M, Sziegoleit W, Ponicke K, Schobess M, Fahr A, Mest HJ. Bioavailability of trapidil tablets. Arzneimittelforschung. 1989;39(9):1137–1138. [PubMed] [Google Scholar]
- 19.Ferrara SD, Tedeschi L, Frison G, et al. Effect of moderate or severe liver dysfunction on the pharmacokinetics of gamma-hydroxybutyric acid. Eur J Clin Pharmacol. 1996;50(4):305–310. doi: 10.1007/s002280050113. [DOI] [PubMed] [Google Scholar]


