AutoSherlock is a program that visually represents results from the Hauptman–Woodward High-Throughput Crystallization Screening Service in chemical space. It thereby aids in the determination and further optimization of crystallization conditions.
Keywords: AutoSherlock, computer programs, crystallization, data analysis
Abstract
A program, AutoSherlock, has been developed to present crystallization screening results in terms of chemical space. This facilitates identification of lead conditions, rational interpretation of results and directions for the optimization of crystallization conditions.
1. Purpose
The High-Throughput Screening (HTS) Laboratory (Luft et al., 2003 ▶) at Hauptman–Woodward Medical Research Institute (HWI) uses an array of 1536 different chemical cocktails to screen macromolecular samples for crystallization from over 850 collaborating laboratories worldwide. These crystallization experiments are imaged automatically over a period of several weeks, generating thousands of images to be examined. Currently this examination is performed manually, though an automated analysis is anticipated for the future. Images are analyzed and scored (by perceived outcome), and then the data are interpreted to decide on the direction of optimization. AutoSherlock is a new software program developed to aid the data interpretation and subsequent optimization of crystallization conditions by graphically linking the images to scores and presenting them in chemical space (Snell et al., 2008 ▶).
2. Strategy
The cocktails used for crystallization screening consist of three groups: salts, different molecular weight PEGs and commercially available screens. The salts and PEG groups, 1 and 2, were constructed using an incomplete factorial design (Audic et al., 1997 ▶). These are described in detail elsewhere (Luft et al., 2003 ▶; Kempkes et al., 2008 ▶). Images are currently manually classified pending automated image analysis developments using the definitions clear, phase separation, precipitate, skin, crystal, junk and unsure. Images can have multiple classifications with the exception of clear, and each classification is converted into a numerical score for use by AutoSherlock. The image scores and chemical information for each experiment are written to a text file (*.mso). The filename contains a textual signature which links it logically to the 1536 images associated with the sample. AutoSherlock processes the scored file and produces a Microsoft Excel workbook containing tools and reports for analyzing the data. Each cocktail from the experiment is color-coded by score and plotted into the chemical space grid by its combination of anion, cation, pH and PEG concentration. This representation allows the user to quickly gain an overview of the experiment results and obvious crystallization trends, and also to reference the image for the results from any cocktail in the context of its chemical ‘neighbors’.
3. Computer language and requirements
AutoSherlock was written in Visual Basic 2005, and requires Microsoft .NET Framework 3.0 (or later), Microsoft Excel 2003 and the Microsoft Office 2003 primary interop assemblies (PIA) redistributable. The resulting workbook files are separate from the AutoSherlock application and require only Microsoft Excel 2003. Macros must be enabled for most features to work properly.
4. Input requirements
AutoSherlock requires a results file (*.mso) generated by our image-review software, MacroScope. This file contains chemical information for each cocktail used, along with any scores that have been assigned by the MacroScope user. Although AutoSherlock requires that these files be XML-formatted, it contains a built-in interpreter to automatically convert the current plain-text files into XML.
Optionally, if the corresponding JPEG images are available on disk, they can be ‘linked’ physically to the workbook when AutoSherlock is run. This allows the user(s) to take full advantage of the workbook by viewing the images in the context of their scores and chemical composition. Because the JPEG images are normally RAR-compressed, a small utility program, BackPacker, is bundled with AutoSherlock to provide a convenient GUI for decompressing RAR archives.
5. Results
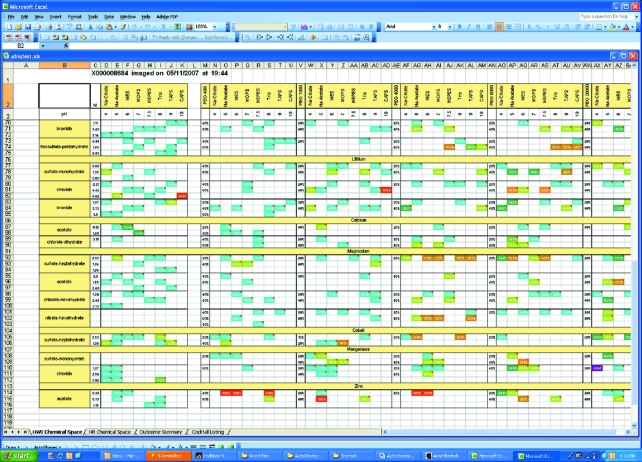
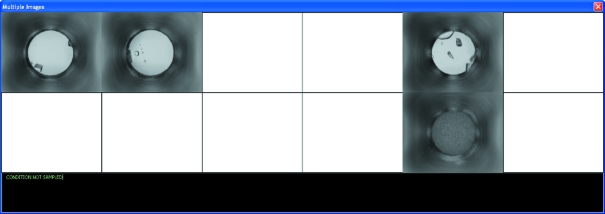
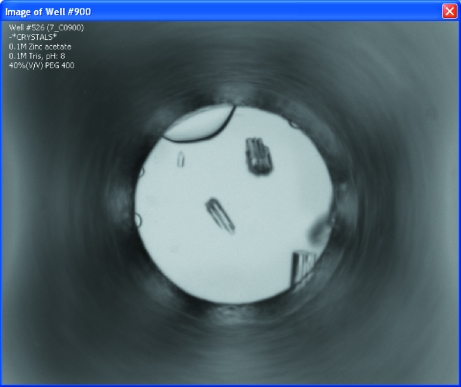
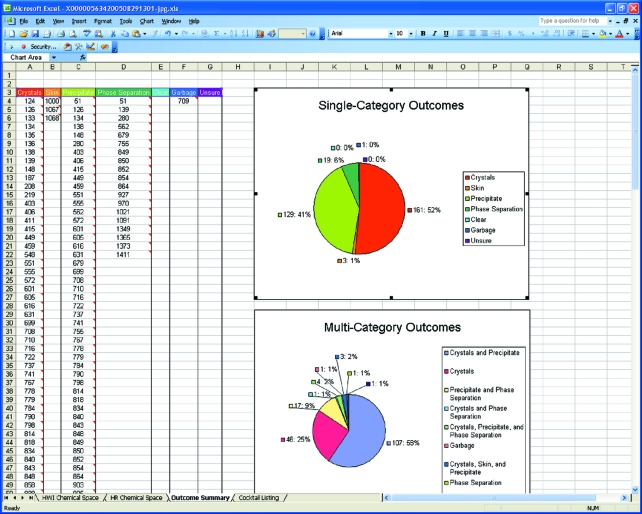
AutoSherlock produces a single Excel workbook that contains four worksheets. These show the results from the incomplete factorial (HWI) cocktails; results from commercial screens; a global overview of the results; and a listing of the image analysis scores, image names and biochemical conditions. Fig. 1 ▶ shows an example of part of the HWI chemical space produced. The results are color-coded according to the classification, with red signifying crystal(s) and turquoise being clear. Any unclassified experiments are colored in gray. The white spaces represent chemical space that is un-sampled. In Fig. 1 ▶, the space is arranged horizontally with groups 1 and 2 in order of increasing molecular weight as a function of pH. Vertically, it is sorted by cation then anion in an approximate Hofmeister series. Not all the space is visible in the figure. In Fig. 2 ▶, a 2 × 6 area of the spreadsheet has been selected and four images associated with the scores are seen. In this case the horizontal axis represents increasing pH while the vertical axis represents increasing PEG 400 concentration from 40 to 60%. Selecting any of these images enlarges it for closer examination (Fig. 3 ▶). It is also clear which conditions have not been sampled. An example of how these data can be used for optimization is presented elsewhere (Snell et al., 2008 ▶).
Figure 1.
A screenshot showing part of the ‘HWI chemical space’ worksheet. In this case all the images have been classified and are represented in chemical space by colored blocks on the sheet. Crystal hits are shown as red and other outcomes as different colors. In this case, the data are arranged horizontally by pH and increasing PEG molecular weight, ranging from no PEG (group 1) to PEG 20 K, and vertically by cation, with this subdivided by anion with the lowest concentration first. The cations and anions are ordered by default in an approximate Hofmeister series. All ordering is user controlled.
Figure 2.
Shown here is the window that results from selecting a 2 × 6 section of the worksheet in Fig. 1 ▶. Three images classified as crystals and one as precipitate are shown. Also clearly indicated is the experimental space that is un-sampled owing to the incomplete factorial design of the cocktails (i.e. the blank spaces). In this case, the cocktail is zinc acetate, with the concentration of PEG 400 increasing top to bottom from 40 to 80%, and the pH varying left to right. Classification and chemical information may be revealed by moving the cursor over each image. Each image may also be selected to show the full-sized image with matching data (see Fig. 3 ▶).
Figure 3.
Selecting any image from the window shown in Fig. 2 ▶ results in a full-sized image, which is shown here. In addition, this view displays chemical information and a score.
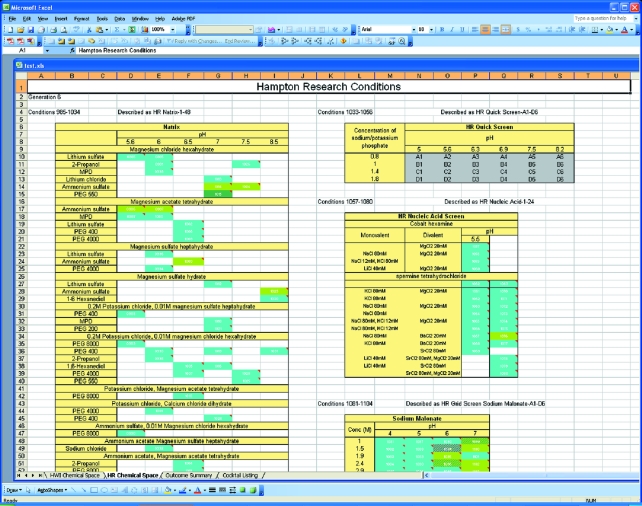
In Fig. 4 ▶, the commercial screen spreadsheet is shown. In this illustration, there are few hits visible and the Quik Screen has not been classified. Selecting a Grid Screen such as the Quik Screen produces rapid visual information on the sensitivity of the sample to fine changes in biochemical conditions. The summary worksheet is shown in Fig. 5 ▶. The outcomes are sorted by classification, and selecting any single outcome or multiple outcomes brings the associated images up for examination. This provides a rapid means of checking the accuracy of classification.
Figure 4.
A screenshot showing part of the ‘HR chemical space’ display. Here the commercial screens used in the 1536 cocktails are arranged in a pre-defined grid according to the most appropriate chemical space.
Figure 5.
A screenshot showing part of the ‘outcome summary’ worksheet. The outcomes are presented according to score with the cocktail number displayed. Pie charts are generated showing the breakdown of single and multiple category outcomes. Selecting any cell will bring up the associated image. Selecting multiple cells will bring up multiple images. This provides a rapid means to review image classification.
Finally, the last worksheet is a cocktail listing that provides the cocktail number, the image filename and the classifications associated with that cocktail (if applicable). If the cocktail is a commercial cocktail then the commercial name is also listed. The cocktail components are given in terms of the name, chemical formula, concentration, units and pH. In its present form, up to ten chemical components can be accommodated, but the maximum number currently used in the 1536 screen is six. This last worksheet is intended for export into laboratory database systems for data mining and record keeping, providing not only data on success, but also the outcome of the failure to aid optimization (Snell et al., 2008 ▶).
6. Continuing development
AutoSherlock grew out of a need for displaying large quantities of crystallization screening data in a manner that could be rapidly interpreted. It is in daily use in the laboratory and feedback is directing future developments. Currently, images are classified manually using an in-house image-viewing application, MacroScope. Scoring is a weakness of many high-throughput laboratories and a development effort is underway to automate this aspect. In the future, MacroScope will be combined with AutoSherlock in an application, independent from Microsoft Excel, that can both score and display screening results. The new application will be written in platform-independent Java code.
7. Distribution and documentation
AutoSherlock supports generation 5–8 of the HWI screening cocktails in addition to the current generation 8a. It is available on request to previous and current users of the HWI HTS Laboratory. Full documentation is available for the software. The authors would welcome adaption to other high-throughput crystallization systems.
Acknowledgments
The authors would like to acknowledge the support of the staff in the HWI High-Throughput Screening Laboratory for testing and suggestions for the software. In particular we would like to acknowledge Jennifer Wolfley and Meriem Said. Melvin Parker helped with initial coding ideas, and Ann Wojtaszczyk provided scored crystal examples. Dr Anna Gardberg at Oak Ridge National Laboratory is thanked for initial testing. Finally, Dr George DeTitta at HWI is acknowledged for insightful comments and support with this analysis. The John R. Oishei Foundation, the Cummings Foundation, NIH grants U54 GM074899-01, U54 GM07495-04 and GM-64655, and Erie County are acknowledged for funding support.
References
- Audic, S., Lopez, F., Claverie, J. M., Poirot, O. & Abergel, C. (1997). Proteins Struct. Funct. Genet.29, 252–257. [DOI] [PubMed]
- Kempkes, R., Stofko, E., Lam, K. & Snell, E. H. (2008). Acta Cryst. D64, 287–301. [DOI] [PubMed]
- Luft, J. R., Collins, R. J., Fehrman, N. A., Lauricella, A. M., Veatch, C. K. & DeTitta, G. T. (2003). J. Struct. Biol.142, 170–179. [DOI] [PubMed]
- Snell, E. H., Nagel, R. M., Wojtaszcyk, A., O’Neill, H., Wolfley, J. L. & Luft, J. R. (2008). Acta Cryst. D64, 1240–1249. [DOI] [PMC free article] [PubMed]


