

Abstract
Ribonuclease P (RNase P) is a ribonucleoprotein that catalyzes the 5′ maturation of precursor transfer RNA in the presence of magnesium ions. The bacterial RNase P holoenzyme consists of one catalytically active RNA component and a single essential but catalytically inactive protein. In contrast, yeast nuclear RNase P is more complex with one RNA subunit and nine protein subunits. We have devised an affinity purification protocol to gently and rapidly purify intact yeast nuclear RNase P holoenzyme for transient kinetic studies. In pre-steady-state kinetic studies under saturating substrate concentrations, we observed an initial burst of tRNA formation followed by a slower, linear, steady-state turnover, with the burst amplitude equal to the concentration of the holoenzyme used in the reaction. These data indicate that the rate-limiting step in turnover occurs after pre-tRNA cleavage, such as mature tRNA release. Additionally, the steady-state rate constants demonstrate a large dependence on temperature that results in nonlinear Arrhenius plots, suggesting that a kinetically important conformational change occurs during catalysis. Finally, deletion of the 3′ trailer in pre-tRNA has little or no effect on the steady-state kinetic rate constants. These data suggest that, despite marked differences in subunit composition, the minimal kinetic mechanism for cleavage of pre-tRNA catalyzed by yeast nuclear RNase P holoenzyme is similar to that of the bacterial RNase P holoenzyme.
Keywords: ribozyme, ribonuclease P, transient kinetics, mechanism
INTRODUCTION
Ribonuclease P (RNase P) catalyzes the endonucleolytic removal of the 5′ leader from precursors of transfer RNA (pre-tRNAs), an activity that is conserved in all domains of life. In most organisms characterized to date, RNase P is a ribonucleoprotein consisting of a single catalytic RNA (∼350–450 nucleotides [nt]) and a variable number of protein subunits (Bacteria = 1, Archaea ≥4, and Eukarya ≥9) (Hsieh et al. 2004; Walker and Engelke 2006; Gopalan 2007; Jarrous and Reiner 2007; Smith et al. 2007). The isolated RNA from bacterial RNase P is catalytically active in vitro under conditions of high ionic strength (Guerrier-Takada et al. 1983). Despite the demonstrated ribozyme activity in vitro, the bacterial protein is essential in vivo (Guerrier-Takada et al. 1983; Gossringer et al. 2006). Until recently, mechanistic studies of RNase P have focused on enzymes isolated from bacteria (especially from Escherichia coli and Bacillus subtilis). The relatively simple bacterial systems have allowed the dissection of the roles of both RNA and protein within a true multiple-turnover ribonucleoprotein enzyme (Christian et al. 2002; Hsieh et al. 2004; Smith et al. 2007). In this study, we take the first steps toward characterizing the kinetic mechanism of the more complex eukaryal holoenzyme.
The roles of the RNA and protein subunits in bacterial RNase P have been elucidated by studying the reaction catalyzed by either the RNA only (ribozyme) or the RNA–protein (holoenzyme) complex in vitro (for review, see Christian et al. 2002; Hsieh et al. 2004; Walker and Engelke 2006; Gopalan 2007; Smith et al. 2007). Steady-state kinetic measurements show that the activity of both the bacterial ribozyme and holoenzyme are dependent on divalent metals and pH. Mechanistic studies of the bacterial holoenzyme in vitro have indicated a number of specific roles for the protein (Hsieh et al. 2004; Smith et al. 2007). The single bacterial P protein increases the pre-tRNA affinity by interacting directly with the substrate, modestly enhances the cleavage activity, reduces the Mg(II) concentration required for optimal catalysis, and may promote PRNA folding (Kurz et al. 1998; Pomeranz Krummel and Altman 1999; Kurz and Fierke 2002; Buck et al. 2005; Sun et al. 2006; Niranjanakumari et al. 2007; Sun and Harris 2007). In kinetic studies of B. subtilis and E. coli ribozyme activity, a burst of product formation is observed, indicating that product dissociation is the rate-limiting step in the minimal kinetic mechanism (Reich et al. 1988; Tallsjo and Kirsebom 1993; Beebe and Fierke 1994; Kurz and Fierke 2002, and references therein).
In eukaryotes, a number of studies strongly support the proposal that the RNA subunit remains the catalytic component (Pfeiffer et al. 2000; Thomas et al. 2000; Kikovska et al. 2007). However, only trace ribozyme activity has been shown for a small number of eukaryal RNAs (Kikovska et al. 2007); therefore, the proteins are undoubtedly involved in assisting and potentially modifying the recognition of substrates and/or the catalytic activity of the RNA. In contrast to the bacterial enzymes, investigation of the precise functions of individual protein subunits has been hindered due to the increased complexity of the eukaryal holoenzymes. A full reconstitution of the yeast holoenzyme remains a technical challenge, although a partial reconstitution of the human enzyme has been reported (Mann et al. 2003). Genetic manipulations in yeast have shown that each of the nine proteins is essential for viability and RNase P activity in vivo (Xiao et al. 2002; Walker and Engelke 2006, and references therein). The study of the in vivo functions of the eukaryotic protein subunits is complicated by the existence of RNase MRP, a closely related ribonucleoprotein. RNase P and RNase MRP each has a distinctive RNA subunit, although the two RNAs share sequence and structural elements; MRP RNA is proposed to have evolved from RNase P RNA. Eight proteins are identical in the RNase P and RNase MRP holoenzymes from yeast and human, with each enzyme having at least one additional unique protein (for review, see Walker and Engelke 2006).
In the case of RNase P, purification of an active precursor to the mature RNase P demonstrated that at least two of the nine proteins are dispensable for pre-tRNA cleavage activity in vitro, including Rpr2p, which is unique to RNase P (Chamberlain et al. 1998; Srisawat et al. 2002). Mutational analysis of yeast nuclear RNase P has also been used to explore the roles of multiple conserved positions within both the RNA and the largest protein subunit, Pop1p (Xiao et al. 2005; Xiao et al. 2006). In the majority of cases, mutations either affect the stability of the RNase P RNA (interpreted as a defect in holoenzyme assembly/stability) or result in a deficiency in pre-tRNA cleavage (interpreted as a defect in catalytic proficiency).
The goal of this study is to elucidate a minimal kinetic mechanism for the eukaryotic/yeast nuclear RNase P. It is important to address whether the differences in composition between the bacterial RNase P holoenzyme (∼10% protein by mass) and the eukaryal RNase P holoenzyme (∼70% protein by mass) result in an altered kinetic mechanism for pre-tRNA cleavage. To this end, we have employed transient kinetic methods to probe the global mechanism of the eukaryal holoenzyme. A significant step has been the purification of the nuclear RNase P from yeast (Saccharomyces cerevisiae) in sufficient quantity and concentration to allow the measurement of transient kinetics. To date, this is the first detailed pre-steady-state kinetics study of nuclear RNase P from a eukaryotic organism. Similar to the bacterial holoenzymes, we have observed a burst of product formation in the pre-steady-state kinetics of pre-tRNA cleavage catalyzed by yeast RNase P. The burst amplitude varies with the enzyme concentration, indicating that a slow kinetic step following cleavage, such as tRNA dissociation, is rate limiting in the overall kinetic mechanism. We have obtained rate constants for pre-tRNA binding, cleavage, and product release from simultaneously fitting a set of kinetic time courses varying substrate and enzyme concentrations. These data support the hypothesis that bacterial and eukaryotic RNase P holoenzymes follow a similar kinetic mechanism.
RESULTS
Yeast nuclear RNase P preparation
The original purification of highly active, nuclear RNase P requires ammonium sulfate precipitation of the yeast lysate followed by multiple ion-exchange chromatography steps in which the enzyme is eluted at high salt conditions (Chamberlain et al. 1998). This protocol takes several days to complete, and the final enzyme concentration is low. To accelerate the purification procedure using milder conditions and to obtain RNase P at the highest concentration possible, we have attempted several affinity-tagged approaches. We successfully purified yeast nuclear RNase P using a tandem affinity purification tag (TAP-tag) (Puig et al. 2001) integrated into the C terminus of the unique Rpr2 protein subunit. Alternative strategies using tandem RNA aptamer tags (Srisawat and Engelke 2002) within the RPR1 RNA were also successful, but the enzyme yields were substantially lower over the dual purification steps (data not shown). The TAP-tag approach was carefully optimized to allow purification of RNase P in a single day under relatively mild conditions, with high purity and high final concentration (see Fig. 1; see Materials and Methods). The specific activity of the TAP-tag purified RNase P is comparable to that purified using a HA-tag affinity method (Xiao et al. 2006) and is slightly higher (∼20%) than enzyme purified by the original method (Ziehler et al. 2000). Northern blot analysis throughout the purification (Fig. 1) shows that several significant potential contaminants (RNase MRP and mitochondrial RNase P) are completely eliminated during the TAP-tag affinity purification. In these preparations, the precursor RPR1 RNA is detected in the purified enzyme and contributes up to 5% of the final yield. Previously precursor RNase P has been shown to be active in pre-tRNA cleavage in vitro (Srisawat et al. 2002). Therefore, estimates of the concentration reflect the entire RPR1 RNA population. The concentration of the final purified holoenzyme was measured by Northern blot analysis of the total RPR1 RNA (181 ± 4 nM). This value is similar to the RNase P concentration determined from the burst amplitude in pre-steady-state experiments (190 ± 6 nM) (see Fig. 3B below), indicating that the majority of the enzyme in this preparation is active.
FIGURE 1.

Large-scale purification of the yeast nuclear RNase P. Purification of yeast nuclear RNase P. (A) Northern blot analysis showing the fractionation of yeast nuclear RNase P (RPR1 RNA) from significant contaminants, mitochondrial RNase P (RMP1 RNA) and RNase MRP (NME1 RNA). (Input) Input (2.5 μL); (C-Elu) calmodulin elution (2.5 μL); (D-Elu) peak DEAE fraction (0.05 μL). (B) The peak DEAE fraction separated on a 12% SDS polyacrylamide gel and stained with silver. The bands are labeled according to their known migrations (Chamberlain et al. 1998), and the positions of various size markers are indicated.
FIGURE 3.

Pre-tRNATyr cleavage catalyzed by RNase P exhibits burst kinetics. The pre-steady-state kinetics of RNase P was determined using 32P-labeled (+5′, +3′) pre-tRNATyr in 20 mM MgCl2, 150 mM KCl, and 50 mM HEPES at pH 8.0, at 20°C. (A) Pre-tRNA cleavage time courses. Pre-steady-state cleavage reactions were performed with an excess concentration of substrate (1.0 μM) and increasing concentrations of RNase P; (●) 7.6 nM; (□) 10.0 nM; (▲) 16.4 nM. Each time course shows a burst of production formation, followed by a slower, linear phase in product formation. (Dotted lines) Extrapolation of the linear phase back to the Y-axis; (solid lines) the best fits of Equation 1 to the cleavage data. (B) The burst amplitudes obtained from the cleavage time courses. (Solid line) The least-squares linear fit of the dependence of the burst amplitude on the RNase P concentration, yielding a slope of 1.05 ± 0.02 pre-tRNA cleaved per RNase P in the burst phase.
Yeast RNase P exhibits burst kinetics
We performed pre-tRNA cleavage experiments catalyzed by yeast nuclear RNase P at saturating concentrations of substrate and measured the cleavage reaction at short times to observe the first few turnovers. This experiment analyzes whether the rate constant for cleavage of the first pre-tRNA catalyzed by RNase P is comparable to the rate constant for subsequent turnovers (Johnson 1992; Fierke and Hammes 1995). To fully capture the burst phase kinetics while minimizing the amount of purified enzyme used for the assay, we lowered the temperature to 20°C (100 mM KCl, 10 mM MgCl2, and 10 mM HEPES at pH 8.0) to slow the reaction sufficiently so that the rate constants could be measured without using rapid reaction equipment.
Figure 3 shows the pre-steady-state time courses for RNase P-catalyzed cleavage of a saturating concentration of wild-type yeast pre-tRNATyr containing both the normal 5′ leader and the 3′ poly(U) trailer (Fig. 2, [+5, +3] pre-tRNA) with increasing concentrations of RNase P. The pre-steady-state time courses have two distinct phases (Fig. 3A): an initial rapid formation of the cleavage products (the burst phase), followed by a linear, steady-state production of tRNA. Extrapolation of the linear phase to zero time intersects the Y-axis above the origin. The burst-phase amplitude (Fig. 3B) was obtained by fitting an equation (Eq. 1) describing a single-exponential followed by a linear, time-dependent formation of product to these time courses (Fig. 3B). The burstphase amplitude increases linearly with the RNase P concentration with a slope of 1.05 ± 0.02 mol of the product formed in the burst per mole of RNase P. These burst kinetics indicate a minimal two-step kinetic pathway: fast pre-tRNA cleavage followed by a second slower step that is needed to regenerate active enzyme. A burst amplitude that is comparable to the total enzyme concentration indicates both that cleavage is significantly faster than the second step and that RNase P is saturated with bound pre-tRNA under these conditions.
FIGURE 2.

pre-tRNA substrates used in this study. The yeast pre-tRNATyr used in these studies. (A) The (+5, +3) substrate in the full-length yeast pre-tRNATyr has both a 5′ 12-nt leader and 3′ poly(U) trailer. (B) The (+5, −3) substrate is pre-tRNATyr without the 3′ trailer (Lee et al. 1997).
Time courses for pre-steady-state cleavage catalyzed by RNase P were also measured at several concentrations of (+5, +3) pre-tRNATyr (Fig. 4A). In each reaction time course, a burst of production formation is followed by a linear phase, as observed in the previous experiments (Fig. 3A). Equation 1 was fit to these data to obtain the observed burst-phase rate constant, k obs,1; the burst-phase amplitude, A; and the steady-state turnover rate constant, k obs, 2. The observed rate constants for both the exponential and linear phases exhibit a hyperbolic dependence on the substrate concentration. The plateau value for the rate constant for the burst phase, k obs, 1, is 0.35 ± 0.03 sec−1 with a value of K 1/2 of 0.40 ± 0.07 μM (Fig. 4B). In contrast, the burst amplitude does not appear to depend on the concentration of pre-tRNATyr under these conditions, likely owing to its squared dependence on total enzyme concentration (Fig. 4C; Gutfreund 1995). The plateau value for the rate constant of the linear phase, k obs,2 (or k cat), is 0.10 ± 0.02 sec−1, with an apparent K M of 0.20 ± 0.08 μM (Fig. 4B). These values are consistent with values measured under steady-state conditions using the same substrate (Table 1), indicating that the linear phase in the pre-steady-state measurements is reflecting steady-state turnover.
FIGURE 4.

Dependence of burst rate constant and amplitude on the concentration of pre-tRNA. The pre-steady-state time courses for cleavage of (+5′, +3′) pre-tRNATyr catalyzed by RNase P were determined at 10 nM RNase P in Buffer A at 20°C. (A) Pre-tRNA cleavage time courses were measured with increasing concentrations of substrate; (▲) 100 nM; (□) 300 nM; (●) 600 nM; (◇) 1 μM. Each time course shows a burst, followed by a slower, linear phase in product formation. (Solid lines) The best fits of Equation 1 to the cleavage data. (B) The observed rate constants for the (●) burst and (○) steady-state (linear) phase at each substrate concentration. (C) The burst amplitudes obtained from the fit of Equation 1 to the cleavage time courses.
TABLE 1.
Isolation and enrichment of yeast nuclear RNase P

These data are consistent with a kinetic mechanism in which the RNase P-catalyzed steady-state turnover of (+5, +3) pre-tRNATyr is not limited by the cleavage step but by a step that occurs after cleavage. Therefore, the minimal kinetic mechanism for yeast nuclear RNase P has at least three kinetic events: substrate binding, cleavage, and product release/enzyme regeneration (Scheme 1). Based on this minimal mechanism, at saturating substrate concentrations, the burst phase indicates that pre-tRNA cleavage (measured by the burst rate constant) (Scheme 1, k 2) is faster than a subsequent step, such as dissociation of products (measured by the steady-state rate constant) (Scheme 1, k 3).
Scheme 1.

Global fitting of a minimal three-step mechanism (substrate binding, cleavage, and product release) (Scheme 1) to all of the pre-steady-state kinetic data using numerical integration techniques (Barshop et al. 1983; Zimmerle and Frieden 1989) leads to a set of kinetic rate constants that describes all of the measured time courses for yeast nuclear RNase P-catalyzed cleavage of (+5, +3) pre-tRNATyr (Fig. 5; Scheme 2), assuming that cleavage and product dissociation are essentially irreversible so that the values of k −2 and k −3[P] are small and negligible. (Under initial rate conditions, the concentration of products is small.) This analysis suggests that the value of the rate constant, k 1, for pre-tRNA association is 1.1 ± 0.2 μM−1 sec−1 under our experimental conditions, which is slower than predicted for a diffusion-controlled association reaction (see Berg and von Hippel 1985; Lohman 1986; Fersht, 1999 and references therein). The value for the rate constant for dissociation of pre-tRNA from the ES complex, k −1, cannot be directly determined from these data; only an upper boundary (≤0.1 sec−1) can be estimated. The global analysis indicates that the value for the apparent cleavage rate constant, k 2, is 0.37 ± 0.03 sec−1, while the value for the rate constant for product dissociation, k 3, is smaller (0.077 ± 0.008 sec−1) (Fig. 5). This fivefold difference in the values of k 2 and k 3 is the basis for the burst phase observed in the pre-steady-state kinetic time course: while cleavage of the first substrate is limited by pre-tRNA association (k 1[E][S]) and cleavage (k 2), subsequent turnovers are mainly limited by regeneration of active, free enzyme from the enzyme–product complex, which may reflect the rate constant for product dissociation. We have estimated that the value of k −3 is 2 × 10⁶ M−1 sec−1 from the tRNATyr inhibition constant (29.4 ± 0.8 nM) (Ziehler et al. 2000) and the value of k 3 (0.07 sec−1) assuming a single dissociation step. Although the concentration of tRNA product becomes comparable to the value of this inhibition constant in the pre-steady-state time courses (up to 60 nM), no obvious product inhibition is observed.
FIGURE 5.

Global analysis of the pre-steady-state cleavage data. We have performed a global analysis of the transient kinetic data and obtained a set of rate constants that best describes the pre-steady-state cleavage data collected at 10 nM RNase P and 0.1, 0.2, 0.3, 0.6, and 1.0 μM (+5′, +3′) pre-tRNATyr in buffer A at 20°C. (A) Global fitting of the pre-steady-state cleavage time courses. (Solid lines) Simulations of the pre-steady-state pre-tRNA cleavage time courses catalyzed by RNase P using the rate constants determined from the global fit (Scheme 2). (B) Direct comparison of the formation of tRNA using a chemical quench and a cold chase. These experiments were performed using 37 nM yeast RNase P and 200 nM radiolabeled (+5′, +3′) pre-tRNATyr. Reactions were stopped with (●) 50 mM EDTA and urea or (○) 10 μM unlabeled substrate incubated for at least 81 sec (10 turnovers) followed by addition of EDTA quench. (Solid lines overlaying the cleavage data) Simulated time course for tRNA formation for EDTA quench or substrate chase experiments, using the rate constants shown in Scheme 2 with k −1 = 0.05 sec−1 and k 3 = 2 × 10⁶ M−1 sec−1. The thick line is the calculated concentration of the ES complex over time.
Scheme 2.

Global analysis of the burst kinetic time courses only provides an upper limit for the dissociation rate constant, k −1, of pre-tRNA from the E•S complex. A better estimation for k −1 can be obtained from a comparison of the burst amplitude when the reaction is quenched by addition of EDTA and urea at acidic pH (chemical quench) compared to addition of excess unlabeled pre-tRNA (cold chase experiments) (Fig. 5B). The chemical quench rapidly stops the cleavage activity of RNase P so that the E•pre-tRNA complex is observed as pre-tRNA. However, the cold chase allows the E•pre-tRNA complex to partition between cleavage to form product (tRNA) and dissociation from the ES complex as pre-tRNA. In a pre-steady-state time course, the tRNA product observed using the cold chase is only 10% to 15% higher than the product obtained by the chemical quench method (Fig. 5B). These experiments were carried out using saturating concentrations of pre-tRNA such that the E•pre-tRNA complex accumulates. However, under these conditions, the maximal concentration of the E•pre-tRNA is predicted to occur before our first time point (between 5 and 7 sec in the reaction time course). Therefore, these data essentially reflect the concentration of the enzyme•pre-tRNA (ES) complex under steady-state conditions. The observation of a significant difference in the product concentration obtained by chemical-quench and cold-chase techniques indicates that the ES complex does not rapidly equilibrate with unbound substrate before cleavage occurs (k −1 ≫ k −2). Instead, in the presence of the cold chase a significant portion of the substrate in the E•pre-tRNA complex partitions to form tRNA. Based on Scheme 1, the fraction of the ES intermediate that partitions to form tRNA instead of dissociating pre-tRNA is defined by k 2/(k −1 + k −2) (Eq. 8) (Patel et al. 1991; Gilbert and Johnson 1994; see Materials and Methods). By using the value of 0.37 sec−1 for k 2, we estimate that k −1 is in the range of 0.05 ± 0.02 sec−1 (Fig. 5B).
To test the validity of the three-step kinetic scheme derived from the global analysis (Scheme 2, where k −1 = 0.05 sec−1), we calculated values for the steady-state kinetic parameters derived for this mechanism (Eqs. 4–6) (Materials and Methods). The experimental and calculated values for these steady-state parameters (Table 2) are within experimental uncertainty (a factor of 2), suggesting that this scheme adequately describes the kinetic mechanism for yeast RNase P.
TABLE 2.
Observed rate constants for pre-tRNA cleavage catalyzed by RNase P

The 3′ trailer of pre-tRNA enhances the RNase P cleavage kinetics
In vivo, pre-tRNA is transcribed by RNA polymerase III, and these transcripts contain short 3′ poly(rU) tails (Lee et al. 1997). We have performed pre-steady-state kinetic experiments using a pre-tRNATyr construct without the 3′ poly(U) trailer [referred to as the ([+5′, −3′] pre-tRNA) (Fig. 2) to probe the importance of this trailer for efficient catalysis of pre-tRNA cleavage (Fig. 6). A prominent burst phase is observed in pre-steady-state kinetic experiments varying either the concentration of RNase P or pre-tRNA (Fig. 6A,B, respectively). The observed burst-phase rate constant plateaus at 0.11 ± 0.02 sec−1 (Fig. 6C; Table 2); threefold slower than the maximal burst-phase rate constant for cleavage of pre-tRNA containing a 3′ trailer. Therefore, the presence of the short duplex between the 5′ leader and 3′ trailer (potentially a 5 AU-bp duplex) (Fig. 1) enhances the apparent cleavage rate constant (Scheme 1, k 2). However, the turnover number (k cat) for RNase P-catalyzed cleavage of this substrate is comparable to that of the full-length (+5′, +3′) pre-tRNA, while the values for k cat/K M and K M are altered modestly (1.5-fold) (Table 2). These data are consistent with previous observations that the absence of the 3′ trailer does not significantly affect the substrate specificity of RNase P under steady-state turnover conditions (Lee et al. 1997; Ziehler et al. 2000).
FIGURE 6.

Pre-steady-state cleavage kinetics of the (+5′, −3′) pre-tRNATyr substrate by RNase P. Pre-steady-state cleavage of 32P-labeled yeast (+5′, −3′) pre-tRNATyr catalyzed by yeast RNase P was determined in Buffer A at 20°C. (A) Pre-tRNA cleavage time courses of 1.0 μM substrate at increasing concentrations of RNase P; (●) 5 nM; (□) 7.6 nM; (■) 15.0 nM; (○) 18.7 nM. (B) Pre-tRNA cleavage time courses at 10 nM yeast RNase P and increasing concentrations of substrate substrate; (▲) 0.1 μM; (○) 0.2 μM; (■) 0.5 μM; (●) 0.6 μM; (□) 1.0 μM. Each time course shows an initial burst, followed by a slower, linear phase in product formation. (Dotted lines) Extrapolation of the linear phase back to the Y-axis. (Solid lines) The best fits of Equation 1 to the cleavage data. (C) The burst rate constant obtained from the cleavage time courses. (Solid line) The best fit of the data to a square-hyperbola with a maximum value for k obs, 1 = 0.12 ± 0.01 sec−1.
Temperature dependence of the steady-state kinetic data suggests additional steps in the mechanism
We have measured the temperature dependence of the steady-state parameters (k cat and k cat/KM) for yeast RNase P cleaving both the (+5′, +3′) and (+5′, −3′) pre-tRNA substrates. Arrhenius analyses for these steady-state kinetic parameters are shown in Figure 7. The steady-state kinetic parameters demonstrate the same temperature dependence for both substrates, consistent with the small effect of the 3′ trailer on the values of the steady-state kinetic parameters. The Arrhenius plot is nonlinear for both k cat and k cat/K M, suggesting that the rate-limiting step changes as the temperature varies. At high temperature (≥30°C), neither k cat nor k cat/K M exhibits a large dependence on temperature. This small temperature dependence is consistent with diffusion-controlled association of pre-tRNA as the rate-limiting step for k cat/K M. However, as the temperature decreases, the values for both k cat and k cat/K M decrease significantly (300- and 240-fold from 37°C to 15°C, respectively); the apparent linear range for both log(k cat/K M) and log(k cat) versus (1/T) lies between 15°C and 25°C, with an apparent Arrhenius activation energy (E a) of 55 ± 4 kcal/mol and 60 ± 10 kcal/mol, respectively. These observations suggest that a change in the rate-limiting step might occur at low temperatures for both the k cat and k cat/K M kinetic parameters, and that the minimal kinetic mechanism shown in Scheme 1 might be too simplistic to completely describe the kinetics of RNase P-catalyzed cleavage of pre-tRNA.
FIGURE 7.

Temperature dependence of the steady-state kinetic parameters, k cat and k cat/K M. Arrhenius plots of log(k cat) and log(k cat/K M) versus 1/T. Steady-state turnover catalyzed by RNase P was determined using 32P-labeled pre-tRNATyr in 2–5 pM RNase P, 20 mM MgCl2, 150 mM KCl, and 50 mM HEPES (pH 8.0), and at temperatures ranging from 15°C to 37°C. (●,■) Kinetic parameters obtained using (+5′, +3′) pre-tRNATyr; (○,□) those using (+5′, −3′) pre-tRNATyr. (Circles) The k cat data; (squares) the k cat/K M data. (Solid line) Obtained by fitting Equation 3 to the linear portion of k cat/K M for the (+5′, +3′) substrate (between 15°C and 25°C) to yield the Arrhenius activation energy, E a. (Dashed line) Fitting to the linear portions of k cat. (Gray line) Simulated using the estimated rate constant and Arrhenius activation energy for a diffusion-controlled substrate-binding reaction (Berg and von Hippel 1985; Lohman 1986).
DISCUSSION
The minimal kinetic mechanism for yeast nuclear RNase P is similar to that of the bacterial RNase P
Based on our kinetic data, the minimal kinetic mechanism for yeast nuclear RNase P consists of at least three steps: pre-tRNA binding, phosphodiester bond cleavage, and slow product release or regeneration of active enzyme. For simplicity, this mechanism explicitly includes dissociation of only one of the two products (Scheme 1). This is a reasonable simplification as long as dissociation of one of the products (such as the short leader) is rapid relative to dissociation of tRNA. For cleavage of yeast pre-tRNATyr under our solution conditions, the rate-limiting step under steady-state turnover is twofold to fivefold slower than the apparent rate constant for cleavage, which leads to the observed pre-steady-state burst in tRNA formation.
Burst kinetics has also been observed for the bacterial RNase P ribozyme and the holoenzyme (Reich et al. 1988; Tallsjo and Kirsebom 1993; Beebe and Fierke 1994). Therefore, rate-limiting product dissociation/enzyme regeneration might be a common property shared by the majority of RNase P ribonucleoproteins. Additionally, under k cat/K M conditions at higher temperatures and moderate salt, substrate association is the rate-limiting step for both bacterial and yeast enzymes as pre-tRNA cleavage is faster than dissociation from the ES complex. Consequently, discrimination between pre-tRNA substrates by RNase P based on binding affinity is diminished so that RNase P can cleave a variety of substrates.
Conformational change might occur prior to catalysis
The minimal three-step mechanism proposed for the yeast nuclear RNase P (Schemes 1, 2) is sufficient to explain the observed transient kinetic data at 20°C. Furthermore, the values calculated for the steady-state kinetic parameters (Eqs. 4–6) using the microscopic rate constants shown in Scheme 2 (with k −1 = 0.05 sec−1) are within experimental uncertainly (a factor of 2) of the measured values for these parameters (Table 2). Therefore, this scheme is also sufficient to describe the steady-state turnover at room temperature.
However, the nonlinear Arrhenius plots observed for both k cat/K M and k cat (Fig. 7) are difficult to rationalize using the three-step kinetic mechanism in Scheme 2. There are several possible explanations for nonlinearity in Arrhenius plots, such as a temperature-dependent change in the rate-limiting step observed in a multistep mechanism, the reaction mechanism, or the structure of the reactants (Gutfreund 1995). Since the reaction catalyzed by RNase P is a multistep kinetic mechanism, we propose that a change in the rate-limiting step is the most likely cause for the observed nonlinear Arrhenius plots. The similar behavior observed for both k cat and k cat/K M suggests that the temperature-dependent step occurs at or before cleavage, as this is likely the first irreversible step in the mechanism (Schemes 2, 3). Furthermore, the large magnitude of the measured activation energy (∼50 kcal/mol) of this step suggests that the temperature-dependent step is neither substrate association (E a ∼6 kcal/mol) (Berg and von Hippel 1985; Lohman 1986) nor phosphodiester bond cleavage (E a = 13–20 kcal/mol) (Uhlenbeck 1987; Thomson and Lilley 1999; Torres et al. 2003). To explain these data, we propose a reaction scheme with an additional step: a temperature-dependent conformational change in the enzyme-substrate complex prior to catalysis (Scheme 3, ES–E′S), or a temperature-dependent interconversion of RNase P between active and inactive states prior to substrate binding and cleavage (Scheme 3, E, E′, respectively). Presently, we cannot differentiate between these possibilities.
Scheme 3.

Curved Arrhenius plots with large energies of activation (Ea > 40 kcal/mol) at lower temperatures have been observed previously for the kinetics of complex reactions, such as actin filaments moving with respect to myosin (Anson 1992), rhodopsin activation (Kahlert and Hofmann 1991), and formation of E. coli RecA protein filaments (Wilson and Benight 1990). In addition, nonlinear Arrhenius plots with similar activation energies (∼40–50 kcal/mol) have been observed previously for association kinetics for nucleic acids and protein–nucleic acid complexes, in-cluding the migration of DNA cruciforms (Lilley 1985), association of E. coli σ70 RNA polymerase with the λPR promoter (Roe et al. 1985; Saecker et al. 2002), E. coli RecA protein binding to duplex DNA (Pugh and Cox 1988), and substrate binding to the hammerhead ribozyme (Peracchi 1999) or to a small deoxyribozyme (Bonaccio et al. 2004). A commonality between the systems involving nucleic acids is a change in base-pairing (melting or annealing) during the macroscopic rate constant monitored. However, this observation does not rule out other temperature-dependent reactions such as conformational changes or net changes in counter-ion uptake/release that could accompany the binding reaction.
A simple model for the two proposed conformational states for the holoenzyme–substrate (ES and E′S) complex would be a lower-affinity, “open” conformation, followed by formation of a higher affinity, “closed” or “docked” conformational state for the ES complex, as previously suggested for bacterial RNase P, hairpin ribozyme, and Group I intron (Loria and Pan 1999; Zahler et al. 2003; Hougland et al. 2006; Sun et al. 2006). Conformational changes are commonly observed in enzymes to increase substrate affinity and to rearrange the active site for optimal catalysis (Narlikar and Herschlag 1997). A conformational change step in the E•pre-tRNA complex of yeast RNase P could serve both purposes.
The results presented here are the first detailed pre-steady-state kinetic studies of a eukaryotic RNase P. We have shown that a minimal kinetic mechanism for yeast RNase P consists of substrate binding, cleavage, and slow product release/regeneration of active enzyme steps, as observed in bacterial RNase P. Furthermore, these data demonstrate that the kinetic behavior of S. cerevisiae nuclear (eukaryotic) and B. subtilis (bacterial) RNase P is similar at moderate temperatures and ionic strength: diffusion-controlled binding of pre-tRNA to form the E•pre-tRNA followed by cleavage of pre-tRNA that occurs more rapidly than pre-tRNA dissociation and, finally, a slow step after cleavage, such as dissociation of products, that limits the steady-state turnover rate.
MATERIALS AND METHODS
Chemicals and buffers
Chemicals of the highest purity were purchased from Sigma Chemical Company unless otherwise specified. Nucleotide triphosphates were purchased from Amersham BioScience. TAP buffer is 50 mM K-HEPES at pH 7.5, 100 mM NaCl, 10 mM MgCl2, 0.1% Triton X-100, 10% glycerol, and 1 mM dithiothreitol. Buffer A is 10 mM MgCl2, 100 mM KCl, and 10 mM HEPES at pH 8.0, at 20°C. TE buffer is 1 mM EDTA and 10 mM Tris-HCl (pH 8.0) at 25°C. Buffers were prepared using deionized water filtered with Mini-Q system (Waters) and degassed before use.
Strains and plasmids
Yeast nuclear RNase P was isolated from the S. cerevisiae strain SCWY10 (MATa his3Δ1 leu2Δ0 met15Δ0 ura3Δ0 rpr2::TAP-HIS3 rpr1Δ::NAT1). The strain is a derivative of S288C bearing a C-terminal TAP tag on the RPR2 protein (Open Biosystems) and modified with a chromosomal deletion of the essential RPR1 gene, which is present on the plasmid YCp50-RPR1 (Chamberlain et al. 1998).
Preparation of yeast extracts
The yeast strain SCWY10 was grown overnight in YPD media at 30°C and harvested at an OD600 of ∼3. For a single enzyme preparation cell pellets from 18 L of yeast culture (∼240 g of wet cell paste) were prepared and stored at −80°C until a total of 90 L of cell culture were obtained. Two different enzyme preparations were used in this study. An initial enzyme preparation was used to test the feasibility of kinetic analysis and to perform an initial exploratory analysis. The results of our second purification are shown in Figure 1 and Table 1, and this enzyme preparation was used to collect all of the kinetic data presented here. Yeast extracts were prepared by lysing cell pellets in TAP buffer containing Complete protease inhibitors with no EDTA (Roche) at the recommended concentrations. Cell pellets were suspended in TAP buffer (3 mL/10 g wet cell paste) and passed through a model 110-Y Microfluidizer (Microfluidics Corporation) using four passes in a single 200-μm configuration followed by six passes using a dual 200 μm/100 μm configuration. Particular care was taken to ensure adequate cooling during the lysis procedure. Following lysis, the cell debris was removed via high-speed centrifugation (4°C/24.3 K×g/10 min). The extract was then cleared via ultracentrifugation (4°C/142.0 K×g/1 h).
Purification of yeast nuclear RNase P
Purification was performed using the C-terminal TAP tag of the Rpr2 protein. The extract was incubated for 2 h at 4°C with 17 μL of rabbit IgG-agarose beads (Sigma) per milliliter of extract. The beads were initially washed with TAP buffer (1 × 40 vol) before being transferred to disposable columns and washed further (5 × 10 vol). The complex was eluted from the IgG beads with TEV protease (Carrington and Dougherty 1988; Kapust et al. 2001). Optimal conditions for TEV cleavage were determined to be 1 μg of TEV per 10 μL of beads, allowing a complete elution in 2 h at 4°C. The eluate was adjusted to 2 mM CaCl2 and 1 mM imidazole then applied to calmodulin affinity resin (Stratagene; 60 μL/mL eluate) and incubated for 2 h at 4°C. The calmodulin beads were washed with 5 × 10 vol calmodulin buffer (TAP buffer + 2 mM CaCl2, 1 mM imidazole) and eluted with calmodulin elution buffer (TAP buffer + 20 mM EGTA, 1 mM imidazole). The TAP-tag elution was diluted to a salt equivalent of 100 mM NaCl (measured by conductivity) and applied to a small DEAE-Sephacel column (0.5 mL). The column was washed with TAP buffer (5 × 5 vol) and eluted with 2 vol of TAP buffer (adjusted to 400 mM NaCl), collecting four-drop fractions (80–100 μL). The elution concentration was detected by Northern blotting to the RNA subunit (RPR1 RNA) using a dot blot apparatus. Care was taken to estimate the concentration within the linear range of the standard loads of RPR1 RNA upon Nytran Supercharge Membrane (Schleicher and Schuell). Estimates for the final peak fractions were repeated in triplicate.
RNase P assays
The RNase P substrates, wild-type S. cerevisiae pre-tRNATyr with the intervening sequence, 5′ 12-nt leader, and with or without the 3′-UUUUU trailer [designated as (+5′, +3′) or (+5′, −3′) substrates, respectively] are prepared by in vitro transcription from linearized plasmids catalyzed by T7 RNA polymerase (Milligan and Uhlenbeck 1989). Pre-tRNA substrates labeled at the 5′ terminus with 32P were prepared post-transcriptionally by treating RNA with calf intestinal alkaline phosphatase followed by incubation with [γ-32P]ATP and T4 polynucleotide kinase (KinaseMax 5′ Labeling Kit; Ambion, Inc.). The pH value for 1.0 M HEPES stock buffer was determined at 25°C and corrected for the temperature dependence of its pK a (−0.014/°C) (Good et al. 1966) so the pH of the buffer is 8.0 at the experimental temperature.
The pre-steady-state and steady-state kinetics catalyzed by yeast nuclear RNase P holoenzyme were characterized under conditions where the substrate concentration is in excess to the enzyme ([S] > [E]) in Buffer A (Ziehler et al. 2000; Xiao et al. 2005). Pre-steady-state kinetics were measured during the first few turnovers (<100 sec), while the steady-state kinetics (the initial rate constants) were determined from the initial rate of pre-tRNA cleavage when <10% of the substrate was cleaved. Unlabeled pre-tRNA with trace concentrations of radio-labeled substrate was refolded by heat denaturation for 3 min at 95°C in TE buffer followed by incubation for 15 min at 37°C and then addition of an equal volume of 2× buffer A. Both the enzyme and the substrate were pre-equilibrated at the reaction temperature for 10 min before initiating the experiments. The assay was started by the addition of the substrate (25–1000 nM) to purified RNase P holoenzyme (7.15 nM to 20 nM final concentration). An aliquot of the reaction mixture was removed and mixed with an equal volume of the stop solution (200 mM EDTA, 0.05% bromophenol blue, 0.05% xylene cyanol, 8 M urea, 20 mM Tris-HCl at pH 8). For cold-chase experiments, reaction aliquots were incubated with an equal volume of the unlabeled substrate (10 μM pre-tRNA in Buffer A using 200 nM labeled substrate) for at least 10 turnovers (>81 sec) before being quenched with the stop solution. Substrate and products were separated by PAGE under denaturing conditions (12% polyacrylamide–7 M urea), and analyzed using a PhosphorImager (Molecular Dynamics).
Data analysis
Kinetics parameters were determined by fitting a burst equation to the pre-steady-state time courses (Johnson 1992):
where A is the burst amplitude, and k obs,1 and k obs,2 are the observed rate constants at the burst and the linear phases, respectively. Steady-state kinetic parameters (k cat, K M, and k cat/K M) were obtained by fitting the Michaelis-Menten equation to the initial velocities, vi, (Fersht 1999).
 |
Data fitting was performed using KaleidaGraph software (Synergy Software). The reported errors are the asymptotic standard errors.
Arrhenius activation energies (E a) for the steady-state kinetic parameters were estimated by fitting Equation 3 to the linear portion of the temperature dependence of k cat and k cat/K M:
 |
where X is either k cat or k cat/K M, R is the universal gas constant (1.987 × 10⁻³ kcal K−1 mol−1), and T the absolute temperature (in K).
Calculating steady-state parameters based on Scheme 1
Mathematical expressions for the steady-state parameters using the microscopic rate constants in Scheme 1 were derived by the King–Altman method (Segel 1975). To simplify the expressions, we assumed that k −2, the rate constant for phosphodiester bond formation, and k −3 [P], binding of tRNA, are negligible.
 |
 |
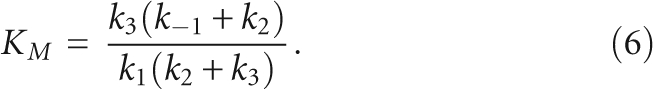 |
Kinetic simulation and global analysis of kinetic data were performed using KINSIM and FITSIM by numerical integration techniques (Barshop et al. 1983; Zimmerle and Frieden 1989). Briefly, the KIMSIM program sets up the rate laws of each chemical step in a kinetic mechanism as a set of coupled differential equations that relates the derivatives of the reactant and product concentrations to their instantaneous concentrations. The time axis of a simulation is divided into small time intervals, and the calculated derivatives at each discrete time point are used to calculate the concentrations at the subsequent time point (Euler's stepping method). We use the rate constants determined from pre-steady-state experiments as the initial values for the rate constants in global analysis (for example, the observed value of k cat/K M for k 1, the plateau values of k obs,1 and k obs,2 for k 2 and k 3, respectively). The values of k 1 have to increase to greater than 1 × 10⁷ M−1 sec−1 to obtain correct burst amplitudes in simulations. We use the FITSIM program to determine the best fit of the kinetic parameters in a given mechanism to sets of data using the Marquardt method of convergence. All curves were fit to the single mechanism in Scheme 1, and the results are shown in Scheme 2. In the simulation of the chemical quench experiments, the observed tRNA product reflects:
For the cold tRNA pulse-chase experiments, the tRNA products include the partitioning of the ES intermediate between cleavage and dissociation, as follows:
ACKNOWLEDGMENTS
We thank members of the Engelke and Fierke laboratories, especially Dr. Nathan Zahler and Kristin Smith, for thoughtful comments and discussions. This research is supported by National Institutes of Health (NIH) grants GM34869 (D.R.E.) and GM55387 (C.A.F.).
Footnotes
Article published online ahead of print. Article and publication date are at http://www.rnajournal.org/cgi/doi/10.1261/rna.1309409.
REFERENCES
- Anson M. Temperature dependence and Arrhenius activation energy of F-actin velocity generated in vitro by skeletal myosin. J. Mol. Biol. 1992;224:1029–1038. doi: 10.1016/0022-2836(92)90467-x. [DOI] [PubMed] [Google Scholar]
- Barshop B.A., Wrenn R.F., Frieden C. Analysis of numerical methods for computer simulation of kinetic processes: Development of KINSIM—A flexible, portable system. Anal. Biochem. 1983;130:134–145. doi: 10.1016/0003-2697(83)90660-7. [DOI] [PubMed] [Google Scholar]
- Beebe J.A., Fierke C.A. A kinetic mechanism for cleavage of precursor tRNA(Asp) catalyzed by the RNA component of Bacillus subtilis ribonuclease P. Biochemistry. 1994;33:10294–10304. doi: 10.1021/bi00200a009. [DOI] [PubMed] [Google Scholar]
- Berg O.G., von Hippel P.H. Diffusion-controlled macromolecular interactions. Annu. Rev. Biophys. Biophys. Chem. 1985;14:131–160. doi: 10.1146/annurev.bb.14.060185.001023. [DOI] [PubMed] [Google Scholar]
- Bonaccio M., Credali A., Peracchi A. Kinetic and thermodynamic characterization of the RNA-cleaving 8-17 deoxyribozyme. Nucleic Acids Res. 2004;32:916–925. doi: 10.1093/nar/gkh250. [DOI] [PMC free article] [PubMed] [Google Scholar]
- Buck A.H., Kazantsev A.V., Dalby A.B., Pace N.R. Structural perspective on the activation of RNase P RNA by protein. Nat. Struct. Mol. Biol. 2005;12:958–964. doi: 10.1038/nsmb1004. [DOI] [PubMed] [Google Scholar]
- Carrington J.C., Dougherty W.G. A viral cleavage site cassette: Identification of amino acid sequences required for tobacco etch virus polyprotein processing. Proc. Natl. Acad. Sci. 1988;85:3391–3395. doi: 10.1073/pnas.85.10.3391. [DOI] [PMC free article] [PubMed] [Google Scholar]
- Chamberlain J.R., Lee Y., Lane W.S., Engelke D.R. Purification and characterization of the nuclear RNase P holoenzyme complex reveals extensive subunit overlap with RNase MRP. Genes & Dev. 1998;12:1678–1690. doi: 10.1101/gad.12.11.1678. [DOI] [PMC free article] [PubMed] [Google Scholar]
- Christian E.L., Zahler N.H., Kaye N.M., Harris M.E. Analysis of substrate recognition by the ribonucleoprotein endonuclease RNase P. Methods. 2002;28:307–322. doi: 10.1016/s1046-2023(02)00238-4. [DOI] [PubMed] [Google Scholar]
- Fersht A. Structure and mechanism in protein science: A guide to enzyme catalysis and protein folding. W.H. Freeman; New York: 1999. [Google Scholar]
- Fierke C.A., Hammes G.G. Transient kinetic approaches to enzyme mechanisms. Methods Enzymol. 1995;249:3–37. doi: 10.1016/0076-6879(95)49029-9. [DOI] [PubMed] [Google Scholar]
- Gilbert S.P., Johnson K.A. Pre-steady-state kinetics of the microtubule-kinesin ATPase. Biochemistry. 1994;33:1951–1960. doi: 10.1021/bi00173a044. [DOI] [PubMed] [Google Scholar]
- Good N.E., Winget G.D., Winter W., Connolly T.N., Izawa S., Singh R.M. Hydrogen ion buffers for biological research. Biochemistry. 1966;5:467–477. doi: 10.1021/bi00866a011. [DOI] [PubMed] [Google Scholar]
- Gopalan V. Uniformity amid diversity in RNase P. Proc. Natl. Acad. Sci. 2007;104:2031–2032. doi: 10.1073/pnas.0611193104. [DOI] [PMC free article] [PubMed] [Google Scholar]
- Gossringer M., Kretschmer-Kazemi Far R., Hartmann R.K. Analysis of RNase P protein (rnpA) expression in Bacillus subtilis utilizing strains with suppressible rnpA expression. J. Bacteriol. 2006;188:6816–6823. doi: 10.1128/JB.00756-06. [DOI] [PMC free article] [PubMed] [Google Scholar]
- Guerrier-Takada C., Gardiner K., Marsh T., Pace N., Altman S. The RNA moiety of ribonuclease P is the catalytic subunit of the enzyme. Cell. 1983;35:849–857. doi: 10.1016/0092-8674(83)90117-4. [DOI] [PubMed] [Google Scholar]
- Gutfreund H. Kinetics for the life sciences: Receptors, transmitters and catalysts. Cambridge University Press; Cambridge, UK: 1995. [Google Scholar]
- Hougland J.L., Piccirilli J.A., Forconi M., Lee J., Herschlag D. How the Group I intron works: A case study of RNA structure and function. In: Gesteland R.F., et al., editors. The RNA world. Cold Spring Harbor Laboratory Press; Cold Spring Harbor, NY: 2006. pp. 133–206. [Google Scholar]
- Hsieh J., Andrews A.J., Fierke C.A. Roles of protein subunits in RNA–protein complexes: Lessons from ribonuclease P. Biopolymers. 2004;73:79–89. doi: 10.1002/bip.10521. [DOI] [PubMed] [Google Scholar]
- Jarrous N., Reiner R. Human RNase P: A tRNA-processing enzyme and transcription factor. Nucleic Acids Res. 2007;35:3519–3524. doi: 10.1093/nar/gkm071. [DOI] [PMC free article] [PubMed] [Google Scholar]
- Johnson K.A. Transient-state kinetic analysis of enzyme reaction pathways. In: Sigman D.S., editor. The enzymes. Academic Press; New York: 1992. pp. 1–61. [Google Scholar]
- Kahlert M., Hofmann K.P. Reaction rate and collisional efficiency of the rhodopsin-transducin system in intact retinal rods. Biophys. J. 1991;59:375–386. doi: 10.1016/S0006-3495(91)82231-7. [DOI] [PMC free article] [PubMed] [Google Scholar]
- Kapust R.B., Tozser J., Fox J.D., Anderson D.E., Cherry S., Copeland T.D., Waugh D.S. Tobacco etch virus protease: Mechanism of autolysis and rational design of stable mutants with wild-type catalytic proficiency. Protein Eng. 2001;14:993–1000. doi: 10.1093/protein/14.12.993. [DOI] [PubMed] [Google Scholar]
- Kikovska E., Svard S.G., Kirsebom L.A. Eukaryotic RNase P RNA mediates cleavage in the absence of protein. Proc. Natl. Acad. Sci. 2007;104:2062–2067. doi: 10.1073/pnas.0607326104. [DOI] [PMC free article] [PubMed] [Google Scholar]
- Kurz J.C., Fierke C.A. The affinity of magnesium binding sites in the Bacillus subtilis RNase P·pre-tRNA complex is enhanced by the protein subunit. Biochemistry. 2002;41:9545–9558. doi: 10.1021/bi025553w. [DOI] [PubMed] [Google Scholar]
- Kurz J.C., Niranjanakumari S., Fierke C.A. Protein component of Bacillus subtilis RNase P specifically enhances the affinity for precursor-tRNAAsp . Biochemistry. 1998;37:2393–2400. doi: 10.1021/bi972530m. [DOI] [PubMed] [Google Scholar]
- Lee Y., Kindelberger D.W., Lee J.Y., McClennen S., Chamberlain J., Engelke D.R. Nuclear pre-tRNA terminal structure and RNase P recognition. RNA. 1997;3:175–185. [PMC free article] [PubMed] [Google Scholar]
- Lilley D.M. The kinetic properties of cruciform extrusion are determined by DNA base-sequence. Nucleic Acids Res. 1985;13:1443–1465. doi: 10.1093/nar/13.5.1443. [DOI] [PMC free article] [PubMed] [Google Scholar]
- Lohman T.M. Kinetics of protein–nucleic acid interactions: Use of salt effects to probe mechanisms of interaction. CRC Crit. Rev. Biochem. 1986;19:191–245. doi: 10.3109/10409238609084656. [DOI] [PubMed] [Google Scholar]
- Loria A., Pan T. The cleavage step of ribonuclease P catalysis is determined by ribozyme–substrate interactions both distal and proximal to the cleavage site. Biochemistry. 1999;38:8612–8620. doi: 10.1021/bi990691f. [DOI] [PubMed] [Google Scholar]
- Mann H., Ben-Asouli Y., Schein A., Moussa S., Jarrous N. Eukaryotic RNase P: Role of RNA and protein subunits of a primordial catalytic ribonucleoprotein in RNA-based catalysis. Mol. Cell. 2003;12:925–935. doi: 10.1016/s1097-2765(03)00357-5. [DOI] [PubMed] [Google Scholar]
- Milligan J.F., Uhlenbeck O.C. Synthesis of small RNAs using T7 RNA polymerase. Methods Enzymol. 1989;180:51–62. doi: 10.1016/0076-6879(89)80091-6. [DOI] [PubMed] [Google Scholar]
- Narlikar G.J., Herschlag D. Mechanistic aspects of enzymatic catalysis: Lessons from comparison of RNA and protein enzymes. Annu. Rev. Biochem. 1997;66:19–59. doi: 10.1146/annurev.biochem.66.1.19. [DOI] [PubMed] [Google Scholar]
- Niranjanakumari S., Day-Storms J.J., Ahmed M., Hsieh J., Zahler N.H., Venters R.A., Fierke C.A. Probing the architecture of the B. subtilis RNase P holoenzyme active site by crosslinking and affinity cleavage. RNA. 2007;13:512–535. doi: 10.1261/rna.308707. [DOI] [PMC free article] [PubMed] [Google Scholar]
- Patel S.S., Wong I., Johnson K.A. Pre-steady-state kinetic analysis of processive DNA replication including complete characterization of an exonuclease-deficient mutant. Biochemistry. 1991;30:511–525. doi: 10.1021/bi00216a029. [DOI] [PubMed] [Google Scholar]
- Peracchi A. Origins of the temperature dependence of hammerhead ribozyme catalysis. Nucleic Acids Res. 1999;27:2875–2882. doi: 10.1093/nar/27.14.2875. [DOI] [PMC free article] [PubMed] [Google Scholar]
- Pfeiffer T., Tekos A., Warnecke J.M., Drainas D., Engelke D.R., Seraphin B., Hartmann R.K. Effects of phosphorothioate modifications on precursor tRNA processing by eukaryotic RNase P enzymes. J. Mol. Biol. 2000;298:559–565. doi: 10.1006/jmbi.2000.3655. [DOI] [PubMed] [Google Scholar]
- Pomeranz Krummel D.A., Altman S. Multiple binding modes of substrate to the catalytic RNA subunit of RNase P from Escherichia coli . RNA. 1999;5:1021–1033. doi: 10.1017/s1355838299990416. [DOI] [PMC free article] [PubMed] [Google Scholar]
- Pugh B.F., Cox M.M. General mechanism for RecA protein binding to duplex DNA. J. Mol. Biol. 1988;203:479–493. doi: 10.1016/0022-2836(88)90014-9. [DOI] [PubMed] [Google Scholar]
- Puig O., Caspary F., Rigaut G., Rutz B., Bouveret E., Bragado-Nilsson E., Wilm M., Seraphin B. The tandem affinity purification (TAP) method: A general procedure of protein complex purification. Methods. 2001;24:218–229. doi: 10.1006/meth.2001.1183. [DOI] [PubMed] [Google Scholar]
- Reich C., Olsen G.J., Pace B., Pace N.R. Role of the protein moiety of ribonuclease P, a ribonucleoprotein enzyme. Science. 1988;239:178–181. doi: 10.1126/science.3122322. [DOI] [PubMed] [Google Scholar]
- Roe J.H., Burgess R.R., Record M.T., Jr Temperature dependence of the rate constants of the Escherichia coli RNA polymerase-λ PR promoter interaction. Assignment of the kinetic steps corresponding to protein conformational change and DNA opening. J. Mol. Biol. 1985;184:441–453. doi: 10.1016/0022-2836(85)90293-1. [DOI] [PubMed] [Google Scholar]
- Saecker R.M., Tsodikov O.V., McQuade K.L., Schlax P.E., Jr, Capp M.W., Record M.T., Jr Kinetic studies and structural models of the association of E. coli σ70 RNA polymerase with the λPR promoter: Large scale conformational changes in forming the kinetically significant intermediates. J. Mol. Biol. 2002;319:649–671. doi: 10.1016/S0022-2836(02)00293-0. [DOI] [PubMed] [Google Scholar]
- Segel I.H. Enzyme kinetics: Behavior and analysis of rapid equilibrium and steady-state enzyme systems. Wiley; New York: 1975. [Google Scholar]
- Smith J.K., Hsieh J., Fierke C.A. Importance of RNA–protein interactions in bacterial ribonuclease P structure and catalysis. Biopolymers. 2007;87:329–338. doi: 10.1002/bip.20846. [DOI] [PubMed] [Google Scholar]
- Srisawat C., Engelke D.R. RNA affinity tags for purification of RNAs and ribonucleoprotein complexes. Methods. 2002;26:156–161. doi: 10.1016/S1046-2023(02)00018-X. [DOI] [PMC free article] [PubMed] [Google Scholar]
- Srisawat C., Houser-Scott F., Bertrand E., Xiao S., Singer R.H., Engelke D.R. An active precursor in assembly of yeast nuclear ribonuclease P. RNA. 2002;8:1348–1360. doi: 10.1017/s1355838202027048. [DOI] [PMC free article] [PubMed] [Google Scholar]
- Sun L., Harris M.E. Evidence that binding of C5 protein to P RNA enhances ribozyme catalysis by influencing active site metal ion affinity. RNA. 2007;13:1505–1515. doi: 10.1261/rna.571007. [DOI] [PMC free article] [PubMed] [Google Scholar]
- Sun L., Campbell F.E., Zahler N.H., Harris M.E. Evidence that substrate-specific effects of C5 protein lead to uniformity in binding and catalysis by RNase P. EMBO J. 2006;25:3998–4007. doi: 10.1038/sj.emboj.7601290. [DOI] [PMC free article] [PubMed] [Google Scholar]
- Tallsjo A., Kirsebom L.A. Product release is a rate-limiting step during cleavage by the catalytic RNA subunit of Escherichia coli RNase P. Nucleic Acids Res. 1993;21:51–57. doi: 10.1093/nar/21.1.51. [DOI] [PMC free article] [PubMed] [Google Scholar]
- Thomas B.C., Chamberlain J., Engelke D.R., Gegenheimer P. Evidence for an RNA-based catalytic mechanism in eukaryotic nuclear ribonuclease P. RNA. 2000;6:554–562. doi: 10.1017/s1355838200991477. [DOI] [PMC free article] [PubMed] [Google Scholar]
- Thomson J.B., Lilley D.M. The influence of junction conformation on RNA cleavage by the hairpin ribozyme in its natural junction form. RNA. 1999;5:180–187. doi: 10.1017/s1355838299981670. [DOI] [PMC free article] [PubMed] [Google Scholar]
- Torres R.A., Himo F., Bruice T.C., Noodleman L., Lovell T. Theoretical examination of Mg2+-mediated hydrolysis of a phosphodiester linkage as proposed for the hammerhead ribozyme. J. Am. Chem. Soc. 2003;125:9861–9867. doi: 10.1021/ja021451h. [DOI] [PubMed] [Google Scholar]
- Uhlenbeck O.C. A small catalytic oligoribonucleotide. Nature. 1987;328:596–600. doi: 10.1038/328596a0. [DOI] [PubMed] [Google Scholar]
- Walker S.C., Engelke D.R. Ribonuclease P: The evolution of an ancient RNA enzyme. Crit. Rev. Biochem. Mol. Biol. 2006;41:77–102. doi: 10.1080/10409230600602634. [DOI] [PMC free article] [PubMed] [Google Scholar]
- Wilson D.H., Benight A.S. Kinetic analysis of the pre-equilibrium steps in the self-assembly of RecA protein from Escherichia coli . J. Biol. Chem. 1990;265:7351–7359. [PubMed] [Google Scholar]
- Xiao S., Scott F., Fierke C.A., Engelke D.R. Eukaryotic ribonuclease P: A plurality of ribonucleoprotein enzymes. Annu. Rev. Biochem. 2002;71:165–189. doi: 10.1146/annurev.biochem.71.110601.135352. [DOI] [PMC free article] [PubMed] [Google Scholar]
- Xiao S., Day-Storms J.J., Srisawat C., Fierke C.A., Engelke D.R. Characterization of conserved sequence elements in eukaryotic RNase P RNA reveals roles in holoenzyme assembly and tRNA processing. RNA. 2005;11:885–896. doi: 10.1261/rna.7282205. [DOI] [PMC free article] [PubMed] [Google Scholar]
- Xiao S., Hsieh J., Nugent R.L., Coughlin D.J., Fierke C.A., Engelke D.R. Functional characterization of the conserved amino acids in Pop1p, the largest common protein subunit of yeast RNases P and MRP. RNA. 2006;12:1023–1037. doi: 10.1261/rna.23206. [DOI] [PMC free article] [PubMed] [Google Scholar]
- Zahler N.H., Christian E.L., Harris M.E. Recognition of the 5′ leader of pre-tRNA substrates by the active site of ribonuclease P. RNA. 2003;9:734–745. doi: 10.1261/rna.5220703. [DOI] [PMC free article] [PubMed] [Google Scholar]
- Ziehler W.A., Day J.J., Fierke C.A., Engelke D.R. Effects of 5′ leader and 3′ trailer structures on pre-tRNA processing by nuclear RNase P. Biochemistry. 2000;39:9909–9916. doi: 10.1021/bi000603n. [DOI] [PubMed] [Google Scholar]
- Zimmerle C.T., Frieden C. Analysis of progress curves by simulations generated by numerical integration. Biochem. J. 1989;258:381–387. doi: 10.1042/bj2580381. [DOI] [PMC free article] [PubMed] [Google Scholar]