

Abstract
Background
Amyloid fibrillar aggregates of proteins or polypeptides are known to be associated with many human diseases. Recent studies suggest that short protein regions trigger this aggregation. Thus, identifying these short peptides is critical for understanding diseases and finding potential therapeutic targets.
Results
We propose a method, named Pafig (Prediction of amyloid fibril-forming segments) based on support vector machines, to identify the hexpeptides associated with amyloid fibrillar aggregates. The features of Pafig were obtained by a two-round selection from AAindex. Using a 10-fold cross validation test on Hexpepset dataset, Pafig performed well with regards to overall accuracy of 81% and Matthews correlation coefficient of 0.63. Pafig was used to predict the potential fibril-forming hexpeptides in all of the 64,000,000 hexpeptides. As a result, approximately 5.08% of hexpeptides showed a high aggregation propensity. In the predicted fibril-forming hexpeptides, the amino acids – alanine, phenylalanine, isoleucine, leucine and valine occurred at the higher frequencies and the amino acids – aspartic acid, glutamic acid, histidine, lysine, arginine and praline, appeared with lower frequencies.
Conclusion
The performance of Pafig indicates that it is a powerful tool for identifying the hexpeptides associated with fibrillar aggregates and will be useful for large-scale analysis of proteomic data.
Background
Understanding protein aggregation has become increasingly important with the discovery of a correlation between amyloid-like fibrils resulting from protein aggregation and diseases such as Alzheimer's disease, Parkinson's disease, transmissible spongiform encephalopathies, and type II diabetes [1-4].
Not only the intrinsically disordered proteins, but also natively folded proteins can aggregate into amyloid-like fibrils, as has been found in β2-microglobulin, lysozyme, transthyretin, and the prion protein [5-7]. It is believed that specific continuous regions within the amyloid fibril-forming proteins can act as facilitators or inhibitors of amyloid fibril formation and determine the proteins' aggregation tendency [6,8-12]. Therefore, recognizing the specific regions that determine the aggregation propensity of a protein is of fundamental interest, since this will help in understanding the mechanism of amyloid formation and lead to effective treatments for amyloid illnesses [13].
As reviewed recently [13], there are two types of computational approaches used to investigate the aggregation propensity of peptides or proteins and to identify the segments most prone to form fibrils (hot spots). The first approach uses phenomenological models based on the physicochemical properties of the amino acids (e.g. β-propensity, hydrophobicity, aromatic content, and charge) to predict changes in aggregation rates with mutation as well as absolute aggregation rates and hot spots [5,6,14-19]. The second approach combines atomistic simulations of a protein segment with the microcrystal structure of short fibril-forming peptides to gain insight into aggregation propensity [1,20-22]. This approach may help to elucidate the structural details of ordered aggregates. In addition to the approaches described above, a sequence pattern obtained by saturation mutagenesis analysis [11] has been proposed to identify amyloidogenic stretches in proteins.
In this study, we proposed the Pafig (Prediction of amyloid fibril-forming segments) to identify fibril-forming segments in proteins based on a support vector machine (SVM) [23,24]. The predictive model of Pafig was also a phenomenological model, which was based on 41 physicochemical properties selected by a two-round selection from 531 physicochemical properties in the Amino acid index database (AAindex) [25,26]. Because short regions of a protein were responsible for its amyloidogenic behavior [1,5,6,11,18], Pafig was trained by hexpeptides, which were decomposed by scanning for segments that could form fibrils with a six-residue sliding window. Pafig is simple, fast, and suitable for large-scale calculations such as proteomics analyses.
Methods
Datasets and physicochemical properties
In this study, we constructed a dataset, the Hexpepset dataset, to train the model and test the robustness of Pafig. The six-residue peptides that could form fibrils were defined as positive samples and those that could not form fibrils as negative samples. The Hexpepset dataset consisted of 2452 hexpeptides (1226 positive samples and 1226 negative samples). The positive samples in the Hexpepset dataset were collected by scanning known fibril-forming fragments [1,5,6,8,14,18,20,27] (Additional file 1) with a six-residue window. Because a large difference between the positive and negative samples can hamper training of the SVM [28,29], the negative set also contained 1226 hexpeptides selected from two different sources. The first negative sample part contained 876 samples, which was selected by scanning the fragments that had been proved not to form fibrils by experiments[18,20]. The second negative sample part consisted of 350 samples. These samples were randomly selected from the hexpeptides obtained by scanning the fragments except the experimentally determined amyloidogenic regions of five proteins (Transthyretin, Genbank Accession No. AAB35640.1; Major prion protein precursor, Genbank Accession No. P04156; Apo-AI, Genbank Accession No. P02647; Alpha-synuclein, Genbank Accession No. P37840.1; Beta-2-Microglobulin, Genbank Accession No. 1LDS) [1,6,27]. The Hexpepset dataset could be downloaded from website of Pafig [30].
There are totally 544 physicochemical properties in the amino acid index database version 9.0 (AAindex) [25,26], which is a collection of published amino acid indices representing different physicochemical and biological properties of amino acids. Each physicochemical property consists of a set of 20 numerical values for amino acids. The property having the value 'NA' in a value set of amino acid index was discarded. Finally, 531 properties were used for the following mining method.
Physicochemical properties selection and Encoding Schemes of Pafig
The input feature of Pafig consisted of 123 elements based on 41 physicochemical properties. The properties selection and encoding schemes of Pafig was illustrated in Figure 1 and calculated as follows:
Figure 1.

Physicochemical property selection and encoding schemes of Pafig.
The 531 physicochemical properties were downloaded from Aaindex [25]. The values of each property were scaled to zero mean and a standard deviation of 1.
According to a physicochemical property pi, a hexpeptide hk could be mapped to feature vector Fi with three elements. , , . If the value of was greater than zero, the value of δ(n) is 1; otherwise it was 0. . If the value of was smaller than zero, the value of δ(n) was 1; otherwise it was 0. Here was one of physicochemical property corresponding to the nth amino acid.
The Support vector machine was used to evaluate the classification ability of each property. The property, which obtained the overall accuracy greater or equal than 60%, was selected as the candidate of Pafig.
A standard genetic algorithm [31] was used to select the final physicochemical properties of Pafig with population size of 10, crossover probability of 0.8, mutation probability of 0.01 and predetermined number of 200 generations. The overall accuracy (Q2) was adopted as the fitness.
Support vector machine
Support vector machine (SVM) was used to identify an optimal hyperplane in order to separate two classes of samples [23,24]. SVM uses kernel functions to map the original data to a feature space of higher dimensions and also locates an optimal separating hyperplane. For SVM implementation, we used LIBSVM [32] with a Radial Basis Function (RBF kernel) and a Polynomial kernel. The parameters were selected with the LIBSVM parameter selection tool (easy.py).
Prediction system assessment
True positives (TP) and true negatives (TN) were identified as the positive and negative samples, respectively. False positives (FP) were negative samples identified as positive. False negatives (FN) were positive samples identified as negative. The prediction performance was tested with sensitivity (TP/(TP+FN)), specificity (TN/(TN+FP)), overall accuracy (Q2), and the Matthews correlation coefficient (MCC). The Q2 and MCC were calculated as follows:
Results
Properties selection
The properties of Pafig were selected by a two-round selection on Hexpepset dataset from the AAindex [25,26]. Firstly, a preliminary properties selection on all of the physicochemical properties (531 properties) was performed using the following steps. (1) Every hexpeptide in the Hexpepset dataset was encoded by each physicochemical property. (2) The overall prediction accuracy (Q2) corresponding to each property was calculated by LIBSVM with a 10-Cross validation on Hexpepset dataset. (3) All performance of each physicochemical property was ranked according to their overall prediction accuracy (Q2). (4) The overall prediction accuracy (Q2 = 60%) was used as the cut off to select properties. As a result, 155 physicochemical properties were selected from 531 properties in AAindex and used as the candidates for further selection. Secondly, an efficient bi-objective genetic algorithm with population size of 10, crossover probability of 0.8, mutation probability of 0.01 and predetermined number of 200 generations was utilized to mine informative physicochemical properties and combine the selected properties to build a prediction model. The overall prediction accuracy (Q2) was adopted as the fitness. All results of genetic algorithm were obtained by LIBSVM with a 10-Cross validation on Hexpepset dataset and were shown in Figure 2.
Figure 2.

Average overall accuracy among the individuals and the best overall accuracy of different generations. The results were obtained by LIBSVM with 10-cross validation on Hexpepset dataset. Q2: overall accuracy.
As shown in Figure 2, the SVM classifier obtained the best overall accuracy Q2 = 81% and MCC = 0.63 in an individual of the 186th generation, where the number of selected physicochemical properties was 41. The standard deviations of Q2 and MCC among the 10-fold cross-validation of the best individual were 1% and 0.01, respectively. Table 1 shows the selected physicochemical properties by Genetic Algorithm and the overall accuracy obtained by the corresponding property. The best property of all the selected properties was VINM940104, which obtained the best overall accuracy Q2 = 66% and corresponds to the "Normalized flexibility parameters (B-values) for each residue surrounded by two rigid neighbours" [33].
Table 1.
The AAindex identities and the overall accuracy (Q2) of the 41 properties selected by Genetic Algorithm. The overall prediction accuracy (Q2) was calculated using the corresponding property by LIBSVM with RBF kernel of 10-Cross validation on Hexpepset dataset.
| ID of AAindex | Q2 | ID of AAindex | Q2 |
| VINM940104 | 66 | CHOC760104 | 62 |
| JACR890101 | 64 | CORJ870103 | 62 |
| NADH010103 | 63 | CHOP780211 | 62 |
| MONM990201 | 63 | EISD860101 | 62 |
| DESM900101 | 63 | CIDH920104 | 62 |
| JANJ780103 | 63 | NAKH920105 | 62 |
| ROSM880102 | 63 | WOLR810101 | 62 |
| PONP800102 | 63 | ZIMJ680103 | 61 |
| NADH010104 | 63 | PARS000101 | 61 |
| MEIH800102 | 62 | KIMC930101 | 61 |
| VINM940103 | 62 | NAKH900108 | 61 |
| RACS770102 | 62 | CORJ870106 | 61 |
| BEGF750102 | 62 | RICJ880113 | 60 |
| CHOP780210 | 62 | KOEP990102 | 60 |
| MONM990101 | 62 | COWR900101 | 60 |
| BAEK050101 | 62 | GUYH850102 | 60 |
| OLSK800101 | 62 | NADH010105 | 60 |
| PONP930101 | 62 | WERD780101 | 60 |
| PALJ810104 | 62 | CHAM830101 | 60 |
| FASG890101 | 62 | RACS770101 | 60 |
| MIYS990105 | 62 |
Prediction performance of Pafig
We investigated the performances using 41, 155, or 531 physicochemical properties. The 10-fold cross validation tests on the Hexpepset dataset were carried out by LIBSVM with RBF kernel. As shown in Table 2, the classifier employing the 41 properties obtained the best performance, with the overall prediction accuracy (Q2) of 81% and the Matthews correlation coefficient (MCC) of 0.63, which was better than using 155 and 531 physicochemical properties. This improvement is mainly due to the reduction in noise and outliers present in the 378 and 531 physicochemical properties, which influence the performance of the Support Vector Machine [34]. In addition, we also evaluated the effect of different SVM kernel and found that the performance with the Radial Basis Function (RBF) kernel was better than the Polynomial kernel, which only obtained an overall accuracy (Q2) of 77% and a Matthews correlation coefficient (MCC) of 0.54 using the selected 41 physicochemical properties with best parameter of d = 3.
Table 2.
Prediction performance on the Hexpepset dataset with different properties. All of the results were obtained by LIBSVM with RBF kernel.
| Number of properties | Specificity(%) | Sensitivity(%) | Q2a (%) | MCCb |
| 1c | 61 | 70 | 66 | 0.31 |
| 41d | 80 | 82 | 81 | 0.63 |
| 155e | 71 | 73 | 72 | 0.45 |
| 531f | 98 | 15 | 57 | 0.24 |
aoverall prediction accuracy; bMCC, Matthews correlation coefficient; cthe property of VINM940104; dproperties selected by Genetic Algorithm; eproperties that obtained the Q2 higher or equal than 60%; fall physicochemical properties in the AAindex.
The receiver operating characteristics (ROC) score was usually used as the primary measure of the machine learning method performance and provided an overview of the possible cut-off levels in the test performance [35]. The ROC curves for the random classifier and classifiers with property of VINM940104, properties with overall prediction accuracy (Q2) ≥ 60% and properties selected by Genetic Algorithm were shown in Figure 3. The result revealed that the classifier with the 41 predictive properties selected by genetic algorithm was better than the property of VINM940104 and properties with overall prediction accuracy (Q2) ≥ 60%.
Figure 3.
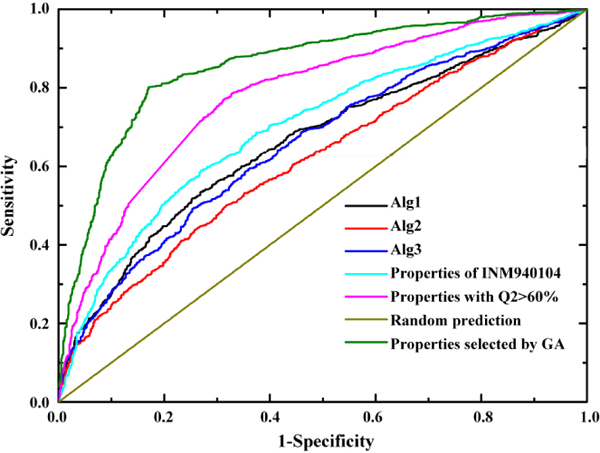
ROC curves of random classifier, classifier with property of VINM940104, properties with overall prediction accuracy (Q2) ≥ 60% and properties selected by Genetic Algorithm and some published classifiers (Alg1 [27] Alg2 [5] and Alg3 [6]).
In addition, we also compared the performance of Pafig with other methods [5,6,27] using the same dataset. The Alg1 [27] is based on the intrinsic aggregation propensities to identify the regions of the protein sequence that are most important for promoting amyloid formation. The Alg2 [5] and Alg3 [6] were used the observed packing density and the relative experimental aggregation propensities of the 20 natural amino acids to detect the amyloid fibril-forming segments. As shown in the Figure 3, we could clearly found that performance of Pafig was better than these popular methods. Moreover, these results also indicate that Pafig is a powerful tool for predicting the amyloid fibril-forming segments in the protein sequence.
Reliability index for Pafig predictions
When machine learning approaches are selected to classify the samples, it is important to know the reliability of the prediction result [36-39]. In this study, a reliability index (RI) was assigned to a predicted hexpeptide based on the output of LIBSVM. Provided that an output of LIBSVM for a hexpeptide is O, the RI value is thus computed as RI = INTEGER (20 × abs(O-0.5)). The value of RI could provide information about the certainty of the classification and could be used as an indicator of prediction certainty for a particular hexpeptide. Figure 4 showed the expected prediction accuracies and the fraction of hexpeptides with a given RI value. For example, about 42% of the hexpeptides had an RI ≥ 7, and of these, 89% were correctly predicted. The result was obtained by LIBSVM with 10-fold cross validations on the Hexpepset dataset.
Figure 4.

Average prediction accuracy calculated cumulatively with RI above a given value. For example, 42% of all hexpeptides had an RI ≥ 7, and of these hexpeptides, 89% were correctly predicted. The results were based on the Hexpepset dataset with 10-fold cross validations.
Identification of fibril forming peptides in all hexpeptides
Pafig was used to predict the potential fibril-forming hexpeptides in all of the 64,000,000 hexpeptides. The fraction of possible fibril-forming hexpeptides with different RI cutoffs was shown in Figure 5. We found that 5.08% of fibril-forming hexpeptides had an RI ≥ 7, which was the minority of all hexpeptides [11]. As shown in Figure 5, the hydrophobic amino acids (alanine, phenylalanine, isoleucine, leucine and valine) occurred at the higher frequencies in the predicted fibril formation hexpeptides. These results matched the hypothesis [6,27,40] that hydrophobic residues usually induced aggregation. However, the amino acids with positive or negative charges, such as aspartic acid, glutamic acid, histidine, lysine and arginine appeared in the predicted fibril formation hexpeptides with lower frequencies. In addition, proline was found with the lowest frequency in the predicted fibril-forming hexpeptides, as expected, as proline was a β-sheet breaker and most fibrils had crossing β-structures [11,41].
Figure 5.
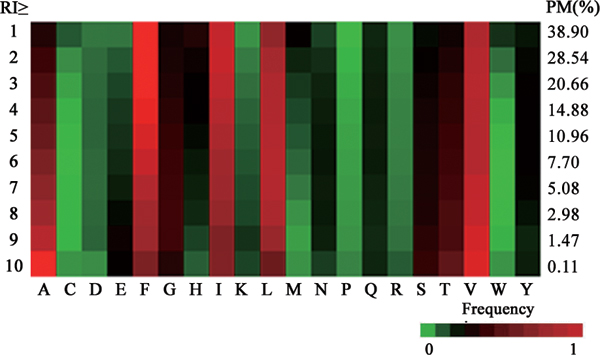
The frequency of amino acid in the predicted fibril-forming hexpeptides with different RI cutoffs. The left column is the different RI cutoffs. PM(%) in the right column is the percentage of predicted fibril-forming hexpeptides in all hexpeptides. The other columns represent the frequency of different amino acids in the predicted fibril-forming hexpeptides with different RI cutoffs. Red represents higher frequency, green represents lower frequency and black represents equal levels of frequency.
Identification of the frequency of fibril-forming hexpeptides in proteins of the UniProt database
The UniProt Knowledgebase (Release 13.5) analysed here was taken from the European Bioinformatics Institute (EBI), since it was the central access point for extensively curated protein information, including function, classification and cross-references. Pafig was used to predict the possible fibril forming hexpeptides of every protein in the database. As shown in Table 3, archaea, bacteria and plants had a consistently higher frequency of fibril-forming hexpeptides. However, human had a relatively lower aggregation propensity. These results also suggested that evolution was as a factor to oppose protein aggregation by minimizing the amount of strongly aggregating sequence stretches [42]. Moreover, we classified the UniProt Knowledgebase based on the gene ontology [43]. As shown in Table 4, the frequency of fibril forming hexpeptides was very similar among the gene ontology Biological process, Cellular component and Molecular function classes. However, the sub-classes of GO:0009055(electron carrier activity) and GO:0005215(transporter activity) in the molecular function class, which consisted of many membrane proteins, had higher frequency of fibril-forming hexpeptides. This result indicated that the aggregation propensity of membrane proteins was somewhat higher than other proteins.
Table 3.
Fibril-forming Propensity of proteins in the Uniprot Knowledgebase classed based on taxonomy. The Predicted fibril-forming hexpeptides were identified by obtaining RI ≥ 7.
| Taxonomic divisionsa | Number of Proteins | Number of hexpeptides | Frequency of Predicted fibril-forming hexpeptides |
| Archaea | 14617 | 4124738 | 0.12 ± 0.18 |
| Bacteria | 222363 | 68121983 | 0.12 ± 0.18 |
| Fungi | 21711 | 10261229 | 0.11 ± 0.16 |
| Human | 19804 | 10726378 | 0.09 ± 0.14 |
| Invertebrates | 16589 | 6276047 | 0.10 ± 0.15 |
| Mammals | 18319 | 6547411 | 0.11 ± 0.16 |
| Plants | 25129 | 8265929 | 0.12 ± 0.19 |
| Rodents | 24350 | 12441185 | 0.10 ± 0.14 |
| Vertebrates | 13852 | 4709586 | 0.10 ± 0.15 |
| Viruses | 12283 | 5518406 | 0.10 ± 0.15 |
aThe division of proteins is same to the Uniprot database. Every protein is present in exactly one taxonomic division. Human contains all human related proteins. Mammals contain all mammalian proteins except those from human and rodents. Vertebrates contain all vertebrate proteins except those from mammals. Invertebrates contain all eukaryotic proteins except those from vertebrates, fungi and plants.
Table 4.
Fibril-forming Propensity of proteins in the Uniprot Knowledgebase classed based on Gene Ontology. The Predicted fibril-forming hexpeptides were identified by obtaining RI ≥ 7.
| Accession number of Gene Ontology | Number of Proteins | Number of hexpeptides | Frequency of Predicted fibril-forming hexpeptides |
| Biological process | 369935 | 131289447 | 0.12 ± 0.17 |
| 0065007 | 2963 | 1742818 | 0.10 ± 0.15 |
| 0009987 | 152145 | 50481819 | 0.12 ± 0.17 |
| 0032502 | 6179 | 3665307 | 0.09 ± 0.13 |
| 0051234 | 13655 | 6183514 | 0.13 ± 0.20 |
| 0002376 | 1070 | 442485 | 0.10 ± 0.14 |
| 0008152 | 151601 | 48557241 | 0.12 ± 0.17 |
| 0051704 | 1065 | 363310 | 0.10 ± 0.16 |
| 0032501 | 2209 | 1330066 | 0.10 ± 0.15 |
| 0048519 | 4002 | 1972548 | 0.09 ± 0.14 |
| 0048518 | 3638 | 1908650 | 0.09 ± 0.13 |
| 0050789 | 15286 | 7280097 | 0.10 ± 0.14 |
| 0050896 | 12705 | 5229936 | 0.11 ± 0.16 |
| Cellular component | 162913 | 69117049 | 0.12 ± 0.18 |
| 0044464 | 125461 | 50190897 | 0.13 ± 0.19 |
| 0032991 | 5476 | 2915149 | 0.10 ± 0.14 |
| 0043226 | 12336 | 6332565 | 0.10 ± 0.14 |
| 0044422 | 16365 | 7892350 | 0.11 ± 0.17 |
| 0044423 | 1082 | 429344 | 0.10 ± 0.15 |
| Molecular function | 251671 | 97593593 | 0.12 ± 0.17 |
| 0005488 | 93440 | 36212221 | 0.11 ± 0.16 |
| 0003824 | 131187 | 50137625 | 0.12 ± 0.18 |
| 0009055 | 1826 | 477887 | 0.16 ± 0.25 |
| 0030234 | 1107 | 631219 | 0.09 ± 0.14 |
| 0060089 | 2090 | 1299918 | 0.11 ± 0.16 |
| 0030528 | 4651 | 1815311 | 0.09 ± 0.13 |
| 0045182 | 4989 | 2029483 | 0.11 ± 0.17 |
| 0005215 | 10663 | 4173787 | 0.14 ± 0.21 |
Discussion
Amyloid fibrillar aggregates of proteins or polypeptides are potentially lethal and related to many diseases, such as Alzheimer's disease, Parkinson's disease, transmissible spongiform encephalopathies, and type II diabetes [1-4]. Here, we have described a method for predicting the amyloid fibril-forming propensities of hexpeptides. Moreover, we used this approach to identify the possible fibril- forming peptides in all hexpeptides and the frequency of amyloid fibril-forming hexpeptides in proteins of the UniProt database. All of these results will help us in understanding the cause of the amyloid fibrillar aggregates of peptides.
In this study, we did not start from some properties which had been proved to relate with the amyloid fibrillar aggregates of peptides, such as the Packing Density, Hydrophobicity, Charge β-sheet propensity and so on [5,6,14,27]. However, we firstly evaluated every physicochemical property in the AAindex and found some physicochemical properties related to amyloid fibrillar aggregates of proteins or polypeptides. Secondly, the genetic algorithm was used to select a physicochemical property set. The results indicated that the selected properties could complement one another to yield a powerful and efficient predictor. In addition, a hexpeptide with every physicochemical property was encoded by three elements rather than the average value of the corresponding property. The performance of employing this encode scheme was better than using one element (data not shown). The detailed encode schemes was shown in the section of Methods.
The features of Pafig did not directly contain the structural features of the proteins. Thus, it is possible that some of the structure information was ignored by Pafig, which also existed as the protein aggregation and fibril forming factors [1,20]. However, the lack of structural information was likely overcome by the inclusion of different physicochemical properties in the Pafig [39]. Moreover, the sample size of the training dataset of Pafig compared with the number of all hexpeptides was very small, which would affect the performance of Pafig. Therefore, the future work is to collect more data by combining biological knowledge and related sources and add some structure feature into Pafig.
Conclusion
In this study, we used 41 physicochemical properties to identify the specific regions (six consecutive residues) associated with amyloid fibrillar aggregates. As this method is computationally efficient and accurate, it can be used to analyze large systems, such as entire proteomics data. Moreover, we have found that the amino acids – alanine, phenylalanine, isoleucine, leucine and valine occurred at the higher frequencies and the amino acids – aspartic acid, glutamic acid, histidine, lysine, arginine and proline appeared with the lower frequencies in the predicted fibril-forming hexpeptides. The amyloid fibrillar aggregation propensity of membrane proteins was somewhat higher than other proteins.
Availability and requirements
Project name: Pafig [30]
Operating systems: Windows
Programming language: Perl
License: GNU General Public License. This license allows the source code to be redistributed and/or modified under the terms of the GNU General Public License as published by the Free Software Foundation. The source code for the application is available at no charge.
Any restrictions to use by non-academics: None
Competing interests
The authors declare that they have no competing interests.
Authors' contributions
Jian Tian wrote the code of Pafig. Ningfeng Wu and Yunliu Fan supervised the work. Jian Tian, Ningfeng Wu, and Jun Guo were involved in the preparation of the manuscript. Jian Tian, Ningfeng Wu, Jun Guo and Yunliu Fan read and approved the manuscript.
Supplementary Material
Table S1. The fibril-forming peptides. The file can be viewed by the software word.
Acknowledgments
Acknowledgements
The authors thank Professor Chih-Jen Lin for help using LIBSVM. We would also like to thank Mr Xing Qi for help us revision the paper. This work was supported by the National Natural Science Foundation of China (Grant no. 30770038).
This article has been published as part of BMC Bioinformatics Volume 10 Supplement 1, 2009: Proceedings of The Seventh Asia Pacific Bioinformatics Conference (APBC) 2009. The full contents of the supplement are available online at http://www.biomedcentral.com/1471-2105/10?issue=S1
Contributor Information
Jian Tian, Email: tianjian3721@163.com.
Ningfeng Wu, Email: wunf@caas.net.cn.
Jun Guo, Email: gcaasj@yahoo.com.cn.
Yunliu Fan, Email: fan_yunliu@163.com.
References
- Zhang Z, Chen H, Lai L. Identification of amyloid fibril-forming segments based on structure and residue-based statistical potential. Bioinformatics. 2007;23:2218–2225. doi: 10.1093/bioinformatics/btm325. [DOI] [PubMed] [Google Scholar]
- Ross CA, Poirier MA. Protein aggregation and neurodegenerative disease. Nat Med. 2004;10:S10–17. doi: 10.1038/nm1066. [DOI] [PubMed] [Google Scholar]
- Dobson CM. The structural basis of protein folding and its links with human disease. Philos Trans R Soc Lond B Biol Sci. 2001;356:133–145. doi: 10.1098/rstb.2000.0758. [DOI] [PMC free article] [PubMed] [Google Scholar]
- Rochet JC, Lansbury PT., Jr Amyloid fibrillogenesis: themes and variations. Curr Opin Struct Biol. 2000;10:60–68. doi: 10.1016/S0959-440X(99)00049-4. [DOI] [PubMed] [Google Scholar]
- Galzitskaya OV, Garbuzynskiy SO, Lobanov MY. Prediction of amyloidogenic and disordered regions in protein chains. PLoS Comput Biol. 2006;2:e177. doi: 10.1371/journal.pcbi.0020177. [DOI] [PMC free article] [PubMed] [Google Scholar]
- Sanchez de Groot N, Pallares I, Aviles FX, Vendrell J, Ventura S. Prediction of "hot spots" of aggregation in disease-linked polypeptides. BMC Struct Biol. 2005;5:18. doi: 10.1186/1472-6807-5-18. [DOI] [PMC free article] [PubMed] [Google Scholar]
- Kelly JW. The alternative conformations of amyloidogenic proteins and their multi-step assembly pathways. Curr Opin Struct Biol. 1998;8:101–106. doi: 10.1016/S0959-440X(98)80016-X. [DOI] [PubMed] [Google Scholar]
- Nelson R, Sawaya MR, Balbirnie M, Madsen AO, Riekel C, Grothe R, Eisenberg D. Structure of the cross-beta spine of amyloid-like fibrils. Nature. 2005;435:773–778. doi: 10.1038/nature03680. [DOI] [PMC free article] [PubMed] [Google Scholar]
- Makin OS, Atkins E, Sikorski P, Johansson J, Serpell LC. Molecular basis for amyloid fibril formation and stability. Proc Natl Acad Sci USA. 2005;102:315–320. doi: 10.1073/pnas.0406847102. [DOI] [PMC free article] [PubMed] [Google Scholar]
- Ventura S, Zurdo J, Narayanan S, Parreno M, Mangues R, Reif B, Chiti F, Giannoni E, Dobson CM, Aviles FX, et al. Short amino acid stretches can mediate amyloid formation in globular proteins: the Src homology 3 (SH3) case. Proc Natl Acad Sci USA. 2004;101:7258–7263. doi: 10.1073/pnas.0308249101. [DOI] [PMC free article] [PubMed] [Google Scholar]
- Lopez de la Paz M, Serrano L. Sequence determinants of amyloid fibril formation. Proc Natl Acad Sci USA. 2004;101:87–92. doi: 10.1073/pnas.2634884100. [DOI] [PMC free article] [PubMed] [Google Scholar]
- Ivanova MI, Sawaya MR, Gingery M, Attinger A, Eisenberg D. An amyloid-forming segment of beta2-microglobulin suggests a molecular model for the fibril. Proc Natl Acad Sci USA. 2004;101:10584–10589. doi: 10.1073/pnas.0403756101. [DOI] [PMC free article] [PubMed] [Google Scholar]
- Caflisch A. Computational models for the prediction of polypeptide aggregation propensity. Curr Opin Chem Biol. 2006;10:437–444. doi: 10.1016/j.cbpa.2006.07.009. [DOI] [PubMed] [Google Scholar]
- Tartaglia GG, Cavalli A, Pellarin R, Caflisch A. Prediction of aggregation rate and aggregation-prone segments in polypeptide sequences. Protein Sci. 2005;14:2723–2734. doi: 10.1110/ps.051471205. [DOI] [PMC free article] [PubMed] [Google Scholar]
- Tartaglia GG, Cavalli A, Pellarin R, Caflisch A. The role of aromaticity, exposed surface, and dipole moment in determining protein aggregation rates. Protein Sci. 2004;13:1939–1941. doi: 10.1110/ps.04663504. [DOI] [PMC free article] [PubMed] [Google Scholar]
- DuBay KF, Pawar AP, Chiti F, Zurdo J, Dobson CM, Vendruscolo M. Prediction of the absolute aggregation rates of amyloidogenic polypeptide chains. J Mol Biol. 2004;341:1317–1326. doi: 10.1016/j.jmb.2004.06.043. [DOI] [PubMed] [Google Scholar]
- Chiti F, Stefani M, Taddei N, Ramponi G, Dobson CM. Rationalization of the effects of mutations on peptide and protein aggregation rates. Nature. 2003;424:805–808. doi: 10.1038/nature01891. [DOI] [PubMed] [Google Scholar]
- Fernandez-Escamilla AM, Rousseau F, Schymkowitz J, Serrano L. Prediction of sequence-dependent and mutational effects on the aggregation of peptides and proteins. Nat Biotechnol. 2004;22:1302–1306. doi: 10.1038/nbt1012. [DOI] [PubMed] [Google Scholar]
- Idicula-Thomas S, Balaji PV. Understanding the relationship between the primary structure of proteins and their amyloidogenic propensity: clues from inclusion body formation. Protein Eng Des Sel. 2005;18:175–180. doi: 10.1093/protein/gzi022. [DOI] [PubMed] [Google Scholar]
- Thompson MJ, Sievers SA, Karanicolas J, Ivanova MI, Baker D, Eisenberg D. The 3D profile method for identifying fibril-forming segments of proteins. Proc Natl Acad Sci USA. 2006;103:4074–4078. doi: 10.1073/pnas.0511295103. [DOI] [PMC free article] [PubMed] [Google Scholar]
- Yoon S, Welsh WJ. Detecting hidden sequence propensity for amyloid fibril formation. Protein Sci. 2004;13:2149–2160. doi: 10.1110/ps.04790604. [DOI] [PMC free article] [PubMed] [Google Scholar]
- Lopez De La Paz M, Goldie K, Zurdo J, Lacroix E, Dobson CM, Hoenger A, Serrano L. De novo designed peptide-based amyloid fibrils. Proc Natl Acad Sci USA. 2002;99:16052–16057. doi: 10.1073/pnas.252340199. [DOI] [PMC free article] [PubMed] [Google Scholar]
- Vapnik VN. Statistical Learning Theory. New York: Wiley; 1998. [Google Scholar]
- Vapnik VN. The Nature of Statistical Learning Theory. 1. New York: Springer; 1995. [Google Scholar]
- Kawashima S, Kanehisa M. AAindex: amino acid index database. Nucleic Acids Res. 2000;28:374. doi: 10.1093/nar/28.1.374. [DOI] [PMC free article] [PubMed] [Google Scholar]
- Kawashima S, Ogata H, Kanehisa M. AAindex: Amino Acid Index Database. Nucleic Acids Res. 1999;27:368–369. doi: 10.1093/nar/27.1.368. [DOI] [PMC free article] [PubMed] [Google Scholar]
- Pawar AP, Dubay KF, Zurdo J, Chiti F, Vendruscolo M, Dobson CM. Prediction of "aggregation-prone" and "aggregation-susceptible" regions in proteins associated with neurodegenerative diseases. J Mol Biol. 2005;350:379–392. doi: 10.1016/j.jmb.2005.04.016. [DOI] [PubMed] [Google Scholar]
- Idicula-Thomas S, Kulkarni AJ, Kulkarni BD, Jayaraman VK, Balaji PV. A support vector machine-based method for predicting the propensity of a protein to be soluble or to form inclusion body on overexpression in Escherichia coli. Bioinformatics. 2006;22:278–284. doi: 10.1093/bioinformatics/bti810. [DOI] [PubMed] [Google Scholar]
- Lin Y, Lee Y, Wahba G. Support Vector Machines for Classification in Nonstandard Situations. Machine Learning. 2002;46:191–202. doi: 10.1023/A:1012406528296. [DOI] [Google Scholar]
- Pafig http://www.mobioinfor.cn/pafig
- Goldberg DE. Genetic Algorithms in Search, Optimization and Machine Learning. Boston: Addison-Wesley; 1989. [Google Scholar]
- LIBSVM http://www.csie.ntu.edu.tw/~cjlin/
- Vihinen M, Torkkila E, Riikonen P. Accuracy of protein flexibility predictions. Proteins. 1994;19:141–149. doi: 10.1002/prot.340190207. [DOI] [PubMed] [Google Scholar]
- Xia H, Hu B. Feature selection using fuzzy support vector machines. Fuzzy Optim Decis Making. 2006:187–192. doi: 10.1007/s10700-006-7336-8. [DOI] [Google Scholar]
- Jung E, Kim J, Kim M, Jung DH, Rhee H, Shin JM, Choi K, Kang SK, Kim MK, Yun CH, et al. Artificial neural network models for prediction of intestinal permeability of oligopeptides. BMC Bioinformatics. 2007;8:245. doi: 10.1186/1471-2105-8-245. [DOI] [PMC free article] [PubMed] [Google Scholar]
- Baldi P, Brunak S, Chauvin Y, Andersen CA, Nielsen H. Assessing the accuracy of prediction algorithms for classification: an overview. Bioinformatics. 2000;16:412–424. doi: 10.1093/bioinformatics/16.5.412. [DOI] [PubMed] [Google Scholar]
- Capriotti E, Calabrese R, Casadio R. Predicting the insurgence of human genetic diseases associated to single point protein mutations with support vector machines and evolutionary information. Bioinformatics. 2006;22:2729–2734. doi: 10.1093/bioinformatics/btl423. [DOI] [PubMed] [Google Scholar]
- Hua S, Sun Z. Support vector machine approach for protein subcellular localization prediction. Bioinformatics. 2001;17:721–728. doi: 10.1093/bioinformatics/17.8.721. [DOI] [PubMed] [Google Scholar]
- Tian J, Wu N, Guo X, Guo J, Zhang J, Fan Y. Predicting the phenotypic effects of non-synonymous single nucleotide polymorphisms based on support vector machines. BMC Bioinformatics. 2007;8:450. doi: 10.1186/1471-2105-8-450. [DOI] [PMC free article] [PubMed] [Google Scholar]
- Fink AL. Protein aggregation: folding aggregates, inclusion bodies and amyloid. Fold Des. 1998;3:R9–23. doi: 10.1016/S1359-0278(98)00002-9. [DOI] [PubMed] [Google Scholar]
- Bemporad F, Calloni G, Campioni S, Plakoutsi G, Taddei N, Chiti F. Sequence and structural determinants of amyloid fibril formation. Acc Chem Res. 2006;39:620–627. doi: 10.1021/ar050067x. [DOI] [PubMed] [Google Scholar]
- Rousseau F, Serrano L, Schymkowitz JW. How evolutionary pressure against protein aggregation shaped chaperone specificity. J Mol Biol. 2006;355:1037–1047. doi: 10.1016/j.jmb.2005.11.035. [DOI] [PubMed] [Google Scholar]
- Ashburner M, Ball CA, Blake JA, Botstein D, Butler H, Cherry JM, Davis AP, Dolinski K, Dwight SS, Eppig JT, et al. Gene ontology: tool for the unification of biology. The Gene Ontology Consortium. Nature genetics. 2000;25:25–29. doi: 10.1038/75556. [DOI] [PMC free article] [PubMed] [Google Scholar]
Associated Data
This section collects any data citations, data availability statements, or supplementary materials included in this article.
Supplementary Materials
Table S1. The fibril-forming peptides. The file can be viewed by the software word.