Abstract
During V(D)J recombination, the site specific DNA excision is dictated by the binding of RAG1/2 proteins to the conserved recombination signal sequence (RSS) within the genome. The interaction between RAG1/2 and RSS is thought to involve a large DNA distortion that is permissive for DNA cleavage. In this study, using atomic force microscopy imaging (AFM), we analyzed individual RAG-RSS complexes, in which the bending angle of RAG-associated RSS substrates could be visualized and quantified. We provided the quantitative measurement on the conformations of specific RAG-12RSS complexes. Previous data indicating the necessity of RAG2 for recombination implies a structural role in the RAG-RSS complex. Surprisingly however, no significant difference was observed in conformational bending with AFM between RAG1-12RSS and RAG1/2-12RSS. RAG1 was found sufficient to induce DNA bending and the addition of RAG2 did not change the bending profile. In addition, a pre-nicked 12RSS bound by RAG1/2 proteins displayed a conformation similar to the one observed with the intact 12RSS, implicating that no greater DNA bending occurs after the nicking step in the signal complex. Taken together, the quantitative AFM results on the components of the recombinase emphasize a tightly held complex with a bend angle value near 60°, which may be a prerequisite step for the site-specific nicking by the V(D)J recombinase.
Keywords: DNA, V(D)J Recombination, RAG1, RAG2, AFM, DNA bending
Immunoglobulin and T-cell receptor genes are created through assembly of gene segments by the process of V(D)J recombination. This process is initiated at the RSS sequences, which contain a conserved heptamer (5′-CACAGTG) and nonamer (5′-ACAAAAACC) separated by spacer sequences of either 12 (12RSS) or 23 (23RSS) base pairs (bp). V(D)J recombination is restricted by the 12/23 rule, which requires that gene segments must be flanked by signals of different spacer lengths for efficient cleavage. The RAG1/2 proteins, known as V(D)J recombinase, bind to RSS sites and make a single strand nick at the border between the heptamer and coding segment. The newly liberated 3′-hydroxyl group then acts as a nucleophile in a transesterfication reaction and targets the bottom strand, resulting in a closed hairpin coding end and a blunt signal end. In the physiological reaction, the hairpin-forming step is primarily restricted to the paired complex of 12RSS and 23RSS held by RAG proteins (1–3). After DNA cleavage, joining of coding and signal ends requires both RAG proteins and the non-homologous end joining (NHEJ) proteins.
Many in vitro studies of RAG-DNA interactions largely utilize core regions of RAG1 and RAG2, which contain large deletions but retain enzymatic activity of DNA cleavage in vivo (4,5). Although both RAG1 and RAG2 proteins are necessary for efficient binding and cleavage, DNA recognition is largely the function of RAG1 (6,7). RAG2 is believed to increase the specificity and stability of the complex (8,9) and yet its exact function remains elusive. While RAG1 contains a nonamer binding region (NBR), it binds to the heptamer with limited specificity via its central domain (12). Interestingly, this domain has greater binding specificity for single stranded (ss) heptamer than its double stranded counterpart or non-specific DNA (10,11). Although the role of ss DNA binding by intact core RAG1 during V(D)J recombination is still of question, the likelihood of ss DNA configuration is increased when there is local helix distortion or unwinding. As such, evidence of RAG-induced helix distortion is suggested from results of various interference and footprinting assays (12–15). DNA distortion near the cleavage site may favor unwinding which is necessary for the direct inline attack required for the transesterfication of the hairpin formation step (16,17).
The ability of RAG1/2 to bend 12RSS DNA has been proposed based on circular-permutation assays. RAG-DNA bending of a 23RSS is assisted by the high-mobility-group proteins, HMGB1 and HMGB2 whereas these proteins exert less bending effect on the RAG-12RSS interaction (17). Although RAG-mediated DNA distortion has been implicated by these previous studies, much remains to be defined on quantitative analyses of the RAG1/2-RSS complex, in terms of bending position, bending angle, as well as possible connection of DNA bending to ultimate excision. To address these issues, we utilized Atomic Force Microscopy (AFM) to directly reveal structural changes imposed by RAG binding to RSS at the single molecular level and to determine whether DNA bending acts as a possible mechanism for RSS recognition, and subsequent nicking. Using AFM, we observed the formation of RAG-RSS DNA complexes and their conformational changes. Our findings provide important insight into the potential mechanism of DNA bending to ensure RSS specificity and as a prerequisite for cleavage.
Experimental Procedures
DNA Substrates for AFM
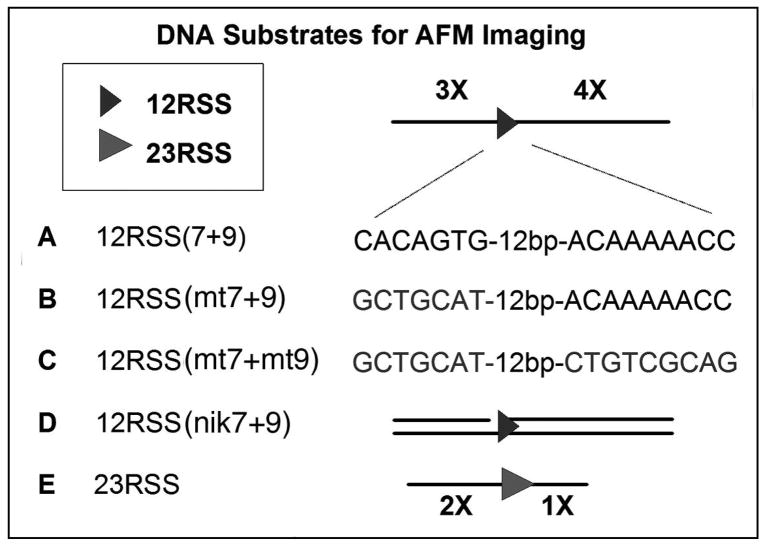
DNA substrates containing a 12RSS or 23RSS sequence were created by PCR amplification of plasmid pUC19-5.2, which is a modified recombination construct of R-bex, kindly provided by Dr. Gerstein (University of Massachusetts). These DNA substrates with designed lengths of DNA arms upstream and downstream of the RSS are shown in Figure 1. The 366 bp fragment 23RSS was PCR-amplified by using the primers P1 (5′-CGC ATC AGG AGC CAT TC) and P2 (5′-CCC TGA GCA AAG ACC CCA) (Fig. 1, E). The 791 bp fragment 12RSS(7+9) (Fig.1, A), where 7 and 9 indicate heptamer and nonamer sequences, respectively, was generated by PCR using the primers P3 (5′-GCT CCT GGA CGT AGC CTT C) and P4 (5′-GCA ACG CGG CCT TTT TAC G). The two 12RSS-mutated 774 bp fragments, having mutated heptamer sequence, and mutation at both heptamer and nonamer, designated as 12RSS(mt7+9) and 12RSS(mt7+mt9), respectively (Fig.1, B and C), were created by ligating three strands (left, middle and right) in a procedure as follows. For the left and right flank (present in the two mutated RSS substrates), the 12RSS(7+9) DNA fragment was digested with PstI and XbaI and the 297 and 420 bp fragments were purified. To assemble the 57 bp middle fragment for both 12RSS(mt7+9) and 12RSS(mt7+mt9), two complementary oligos (top and bottom strands) were annealed and purified for each. For the 12RSS(mt7+9), 5′-phosphate-CTA GAA GCT ACG GTA GTA GCT ACG CTC TGT CTC GAG ACT GGA ACA AAA ACC CTG CA, and 5′-phosphate-GGG TTT TTG TTC CAG TCT CGA GAC AGA GCG TAG CTA CTA CCG TAG CTT. For the 12RSS(mt7+mt9), 5′-phosphate-CTA GAA GCT ACG GTA GTA GCT ACG CTC TGT CTC GAG ACT GGA CGT TCG GAG CTG CA, and 5′-phosphate-GCT CCG AAC GTC CAG TCT CGA GAC AGA GCG TAG CTA CTA CCG TAG CTT. These fragments contain sticky ends capable for ligation to the PstI and XbaI digested left and right flanks. The middle fragments were subsequently ligated to the left (297 bp) and right (420 bp) flanks to create 12RSS(mt7+9) and 12RSS(mt7+mt9). To create the middle fragment for the pre-nicked 12RSS DNA substrate, 12RSS(nik7+9), Fig.1, D), three complementary oligos (two top strands, one bottom strand) were annealed and purified. These included: 5′-phosphate-CTA GAA GCT ACG GTA GTA GCT AC, 5′-CACAGTG CTC GAG ACT GGA ACA AAA ACC CTG CA, and 5′-phosphate-GGG TTT TTG TTC CAG TCT CGA GCA CTG TGG TAG CTA CTA CCG TAG. This DNA fragment was subsequently ligated to the left (297 bp) and right (420 bp) flanks to create 12RSS(nik7+9). All DNA fragments were analyzed by sequencing to confirm their accuracy.
Figure 1.
DNA substrates AFM analysis of RAG-DNA interactions. The DNA fragments 12RSS(7+9) (A) and 23RSS (E), which contain a 12RSS and 23RSS, respectively (see Materials and Methods). Flanking DNA lengths were designed for identification of specific protein-DNA complexes. 12RSS(7+9) contains DNA arms of 3X and 4X arms. The 23RSS has DNA arms flanking the RSS at lengths of 2X and 1X. Generation of 12RSS(mt7+9) (B), 12RSS(mt7+mt9) (C), and 12RSS(nik7+9) (D), where mt indicates scrambled sequence and nik indicates pre-nicked, were explained in Materials and Methods. These three altered DNA substrates all contain relative flanking arms of 3X and 4X.
RAG1 and RAG2 Protein Purification
Truncated RAG1 (residues 374–1008) and RAG2 (residues 1–387) fused to maltose binding protein (MBP) at its N-terminus was expressed and purified individually from 293T cells transfected with RAG1 and RAG2 plasmids, cMR1m and cMR2, respectively (A kind gift from Patrick Swanson, Creighton University) in an lipofectamine procedure. Briefly, 48 hours after transfection, cells were harvested and resuspended in buffer A (10mM sodium phosphate, 500 mM NaCl, 0.2% Tween-20) plus protease inhibitors. Cells were sonicated and spun down for 1 hour at 20,500 RPM at 4°C. The supernatant was diluted 1:1 (v/v) with buffer A without Tween-20 and run on an amylose column pre-equilibrated with buffer A. Proteins were eluted with buffer A plus 10 mM maltose and protease inhibitors. Protein-containing samples were dialyzed against buffer D (25 mM HEPES-KOH, 100 mM KCl, 2 mM DTT). Coomassie-stained SDS-PAGE analysis indicates MBP-RAG1 and MBP-RAG2 to be at least 95% pure (data not shown). Throughout the text, MBP-RAG1 and MBP-RAG2 are referred to as RAG1 and RAG2. Human HMGB1 protein was obtained commercially (Sigma-Aldrich).
Gel-Mobility Shift Assay
Binding of RAG1 and RAG1/2 to a 1 nM 32P-labeled 53 bp 12RSS DNA substrate (top 5′-CTA CGG TAG TAG CTA CCA CAG TGC TCG AGA CTG GAA CAA AAA CCC TGC AGT CG, bottom 5′-CGA CTG CAG GGT TTT TGT TCC AGT CTC GAG CAC TGT GGT AGC TAC TAC CGT AG) was analyzed by a range of RAG1 concentrations (0–200nM). With 200nM RAG1, binding was measured by a range of RAG2 concentrations in binding buffer (20 mM Hepes (pH 7.8), 50 mM NaCl, 3 mM CaCl2 1 mM DTT, 100 nM 110 bp cold nonspecific competitor, 0.1 mg/ml of bovine serum albumin, 5% glycerol). Samples were electrophoresed on a 5% native polyacrylamide gel in a 0.5X Tris–Borate (pH 8.3) under constant 50V. Gels were dried and exposed to film.
RAG1/2 Enzymatic Assay
A 53 bp double stranded DNA substrate (same as above) which contains a 12RSS was top strand 5′ labeled with 32P to examine RAG1/2-meidated cleavage activity. Indicated proteins (200nM) with or without complementary cold 23RSS were incubated with radiolabeled DNA in cleavage buffer (20 mM Hepes (pH 7.8), 50 mM NaCl, 1 mM DTT and 0.1 mg/ml of bovine serum albumin) in the presence of 3 mM CaCl2, or MnCl2. Reactions were incubated for 30 minutes at 37°. Samples were then stopped with loading solution (95% formamide, 10 mM EDTA), heated to 95° for 3 min, run on a 15% polyacrylamide gel containing 7 M urea in TBE buffer, and exposed to film overnight.
Assembly of RAG-DNA Complexes and AFM Imaging
For RAG-DNA complex formation, 200 nM RAG1 or 100 nM RAG1 and 100 nM RAG2 and 8 nM DNA in final concentrations were incubated for 30 min. at 37° in the presence of buffer CA (20 mM Hepes, pH 7.8, 50 mM KCl, 2 mM CaCl2, 2 mM DTT) in a total volume of 5 μl. For experiments with HMGB1, the protein was added to RAG1/2 prior to binding DNA at 100 nM in the reaction. Samples were fixed by the addition of a 1:1 ratio of buffer CA containing glutaraldehyde (0.2% v/v) to stabilized the RAG-RSS complex, as reported before (14). After 5 min. the reaction was stopped with the addition of 1 μl of 1 M Tris-HCl pH 7.8. The sample was then purified through a Microcon YC100 column and the filtrate was brought up to 10 μl with buffer CA. Typically 2 μl of sample was deposited onto mica modified with 1-(3-aminopropyl)silatrane (APS-mica) (19). After two minutes, the samples were thoroughly rinsed with deionized water and dried under an argon gas flow. AFM imaging in tapping mode was performed on a Bioscope SPM Nanoscope III system (Veeco/Digital Instruments, Santa Barbara, CA). OMCL-AC160TS silicone probes (Olympus Optical Co., Tokyo, Japan) with a spring constant of ~42 N/m and a resonance frequency of ~300 kHz were used for imaging.
AFM Data Analysis
Data analysis including image processing, contour length measurements, end-to-end distances, angle, height and cross-section was performed with Femtoscan v1.6 (4.8) (Advanced Technology Center, Moscow, Russia). The protein-induced DNA bend angle, α, of a continuous piece of DNA interrupted with protein was determined from the tangent method similar to the one described before (20) and explained in Supporting Information, and Supporting Fig.1 and Supporting Fig.2.
RESULTS
Size and Position of RAG-RSS Complexes Revealed by AFM
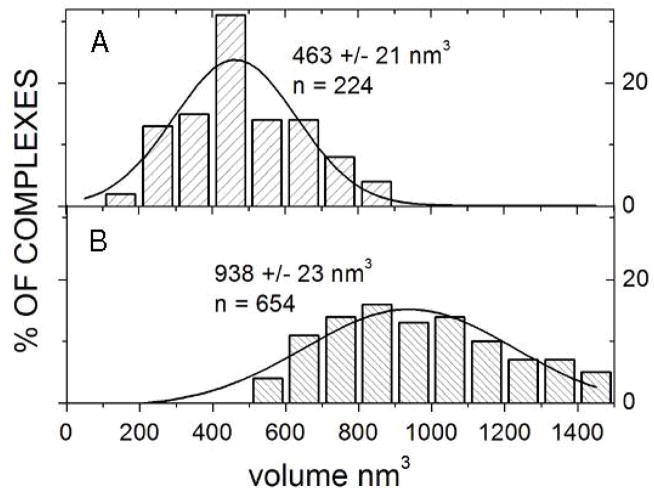
The enzymatic activity of the RAG proteins in site-specific binding and cutting of DNA was determined and presented in Supporting Figure 3. RAG1 or RAG1 pre-incubated with RAG2 was incubated with various DNA substrates in the presence of Ca2+ and deposited onto APS-mica for AFM imaging. Sizes of proteins assembled onto DNA were calculated from AFM volume measurements (21). Volumes of RAG proteins (i.e., MBP-RAG fusion proteins) bound to 12RSS or 23RSS are displayed in a histogram in Figure 2, in which no apparent differences in volumes were observed on these two different DNA substrates (data not shown). The volume estimation was based on the approximated peak value, where SD was given. To approximate the size of RAG1 from the volume data, the known volume and size of a MutSα dimer (537±18 nm3, 250 kDa) bound to DNA was used as a reference (Supporting Figure 4). A dimer of RAG1 (214 kDa) should approximately have a volume of 459 nm3, corresponding very closely with the measured RAG1 volume (463 nm3). If the RAG1 dimer size does not change upon the addition of RAG2 (79 kDa, estimated size 170 nm3), the measured volume of RAG1/2 (938 nm3) is between a RAG1/2 tetramer (2RAG1:2RAG2, 459+340=799 nm3) and pentamer (2RAG1:3RAG2, 968 nm3). Therefore, RAG1/2 is likely bound as a dimer of RAG1 with a dimer or trimer of RAG2 although other combinations of RAG1 to RAG2 cannot be ruled out, e.g., 1RAG1:4RAG2.
Figure 2.
Histograms of volume measurements of RAG1 (A) and RAG1/2 (B) as determined from AFM analysis. Volumes were calculated by estimating hemispheres from height measurements and cross-sections of diameters at half-maximum heights of proteins bound to 12RSS and 23RSS. To estimate the size of RAG1 and RAG1/2, the volume and size of MutSα bound to DNA was calculated (537 nm3, 250 kDa). A dimer of RAG1 (214 kDa) should approximately have a volume of 459 nm3, which corresponds closely with the measured volume (463 nm3).
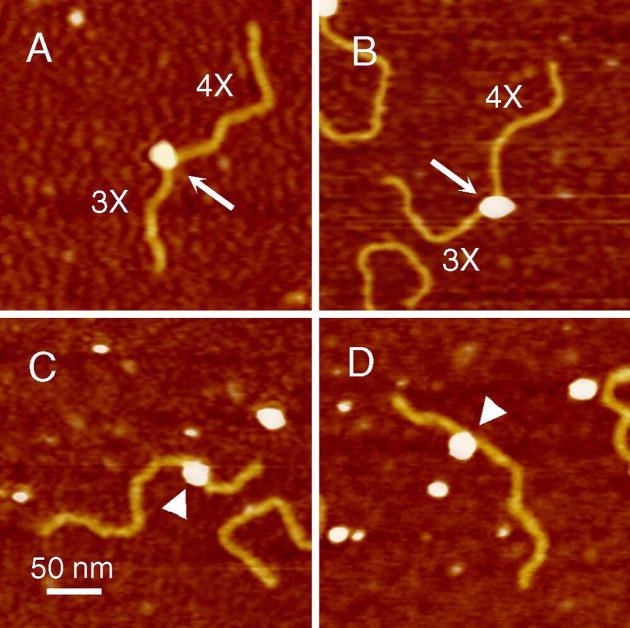
AFM analysis provides us with the capability to determine the binding location of proteins along the DNA contour. Of all the DNA samples with exactly one protein bound, RAG1 and RAG1/2 was found binding to DNA ends at frequency of about 17% and 30%, respectively. While this is an interesting phenomenon, these binding events were excluded from the binding position analysis. Only single DNA fragments with one protein bound along the DNA contour counted in our statistical analysis. AFM imaging allows us to determine whether RAG1 binds with a higher frequency at a location of the known position of a 12RSS compared to the rest of the DNA contour. Analysis of DNA sequence specificity indicates that the RAG proteins bind at a position consistent with the location of the 12RSS on the 12RSS(7+9) fragment (see Fig.1, A) from identification of flanking arms of 3X and 4X lengths (Fig. 3A and B). RAG1 binds the 12RSS (explained in Supporting Data) with a specificity S= 377±36 [Table 1; S is defined as a relative frequency of a protein binding to a specific site versus a nonspecific site (20)]. The addition of RAG2 increases binding specificity (S=692±63) to the 12RSS, and so does to the 23RSS (S=556±88). In comparison, binding of RAG1 and RAG1/2 to the mutated 12RSS DNA substrate, [12RSS(mt7+mt9)] displayed no obvious position preferences in binding to the DNA substrates (Fig. 3C & D). Therefore, AFM results indicate that the RAG proteins bind with high specificity to the RSS sites, as expected.
Figure 3.
Representative AFM images of RAG1-DNA complexes. RAG1 was incubated with 12RSS(7+9) (as illustrated in Fig.1, A and B) and 12RSS(mt7+mt9) (Fig. 1, C and D), which contain a 12RSS and a scrambled 12RSS at the same location, respectively. The protein (white egg shaped blobs) bound to a location on the 12RSS(7+9) (yellow filaments) consistent with the location of the 12RSS (also termed (7+9)) which contain flanking DNA arms of 3X and 4X as shown in panels A and B, denoted by arrows. RAG1 binding the scrambled 12RSS was diffuse and did not bind at a consistent location, represented by arrow-heads. The upper two images are RAG1 bound to the (7+9), whereas the bottom two images are RAG1 bound non-specifically to DNA. Noticeably, the protein induces a strong DNA bend in the helix at the (7+9) (white arrows) compared to non-12RSS sequence (white arrowheads).
Table 1.
Specificity of RAG Proteins for Various DNA Substrates
| protein | DNA substrate | DNA site | Specificity (S)* |
|---|---|---|---|
| RAG1 | 12RSS(7+9) | (7+9) | 377±36 |
| RAG1/2 | 12RSS(7+9) | (7+9) | 692±63 |
| RAG1/2 | 23RSS | 23RSS | 522±46 |
| RAG1/2 | 12RSS(nik7+9) | (nik7+9) | 814±67 |
| RAG1/2 | 12RSS(mt7+9) | (mt7+9) | 153±11 |
| RAG1/2-HMGB1 | 23RSS | 23RSS | 556±88 |
| RAG1/2 | 12RSS(mt7+mt9) | (mt7+mt9) | 1# |
Specificity with standard error determined from Gaussian distributions of binding locations (S =N*Asp/Ansp +1) where N is the number of binding sites and A is the area under the Gaussian distribution (see Supplementary Fig. 2 and Ref. 21).
Given the lack of Gaussian peak in 12RSS(mt7+mt9), the Asp is 0, thus the Specificity is approximately equal to 1.
AFM Analyses of RAG1-12RSS Conformations
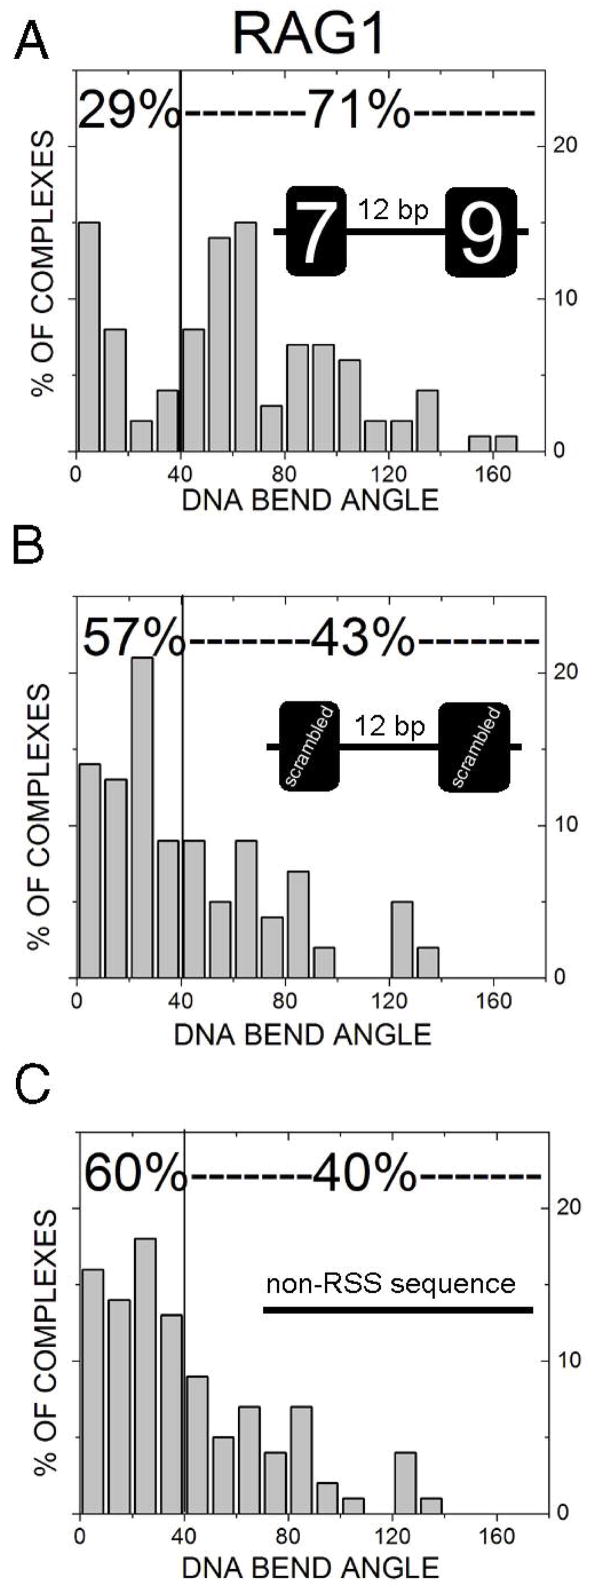
The DNA contour visualized by AFM allows direct measurement of DNA bending, providing information on DNA conformations. Although naked DNA molecules show intrinsic DNA bending, the bending profile displays no differences among different DNA fragments, normal or mutant RSS (unpublished observation). Thus, we focused our DNA-bending analysis primarily on DNA-protein complexes. As shown in Fig. 3, RAG1-DNA complexes exhibit a noticeable bend in the helix denoted by arrows (Figs. 3A and B) whereas the one formed on the mutated-RSS fragments lacks obvious bending (Figs. 3C and D). The protein-induced bending angle at the RSS position (as determined above) is considered RSS-specific bending. By comparing RAG1-(7+9) complexes (RAG binding to the location of the wild type 12RSS on the 12RSS(7+9) substrate) with the protein binding at the same location of mutated DNA sequence [RAG1-(mt7+mt9)] or non-RSS DNA, one can determine whether the observed DNA bending is RSS-specific. Specific RAG1-(7+9), RAG1-(mt7+mt9) and RAG1 bound to non-RSS sites [any location along the contour of 12RSS(S+S)] were analyzed and compared for the magnitude of DNA bending angle. The RAG1-(mt7+mt9) complexes display a diffuse pattern with a very shallow angle (Fig. 4B). The majority of DNA bend angles (57%) are less than 40°, suggesting a large ensemble of various conformations. In contrast, the DNA bending profile of specific RAG1-(7+9) associations displays a distinct bimodal distribution with two major populations (Fig. 4A). One population characterized by bending less than 40° (peak at 0±4°) and the other with a bend angle value near 66±6°. Thus, using AFM, we provided the quantitative measurement on the conformational changes of RAG-12RSS complexes, in term of bending angles and distribution of bending complexes. The RAG1-(mt7+mt9) substrate has no sequence resembling an RSS, such that RAG1 binding anywhere on the DNA is indicative of RAG1-non-RSS interactions. When RAG1 bound to any location along the non-RSS molecule (Fig. 4C), the DNA bending profile is similar to that of the RAG1-(mt7+mt9) complexes (Fig. 4B), reflecting the level of DNA distortion caused by non-specific interactions of RAG1 with DNA. In comparing RAG1 bending at the (7+9) versus the (mt7+mt9) or non-RSS, the profiles of the two are statistically different (p=0.009 and p<0.0001, respectively).
Figure 4.
DNA bend angle profiles of RAG1-DNA complexes. RAG1 bound to (7+9) (A), (mt7+mt9) (B), or non-RSS sequence DNA (C) was measured for DNA bend angle as described in Materials and Methods. Percentages near the top of each graph indicate proportion of molecules less or greater than 40°. When RAG1 bound to the (7+9), the percentage of molecules which are bent greater than 40° is considerably higher than non-specific sites. The bend angle profile of specific RAG1-DNA complexes indicates at least two populations of conformations at 0±4° and 66±6°, whereas at non-specific sites the bend angle is very shallow. Statistical analysis indicates there is a significant difference between bending at a (7+9) versus (mt7+mt9) (p=0.005) or non-RSS sequence (p≪0.001).
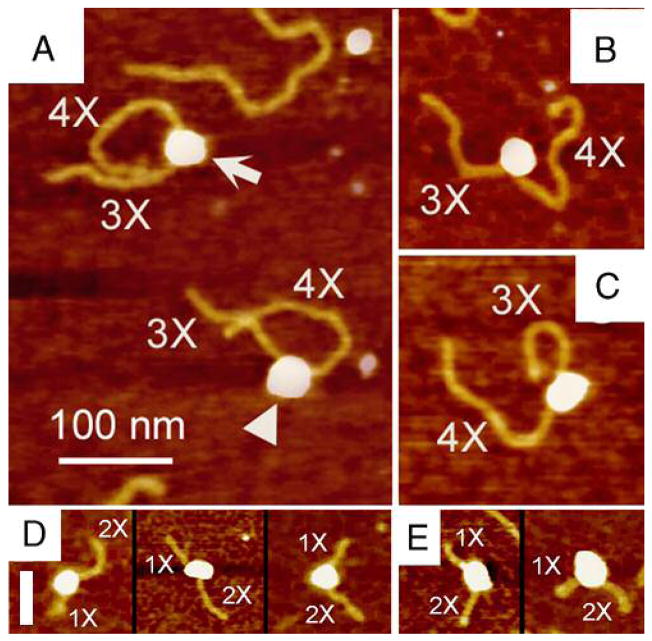
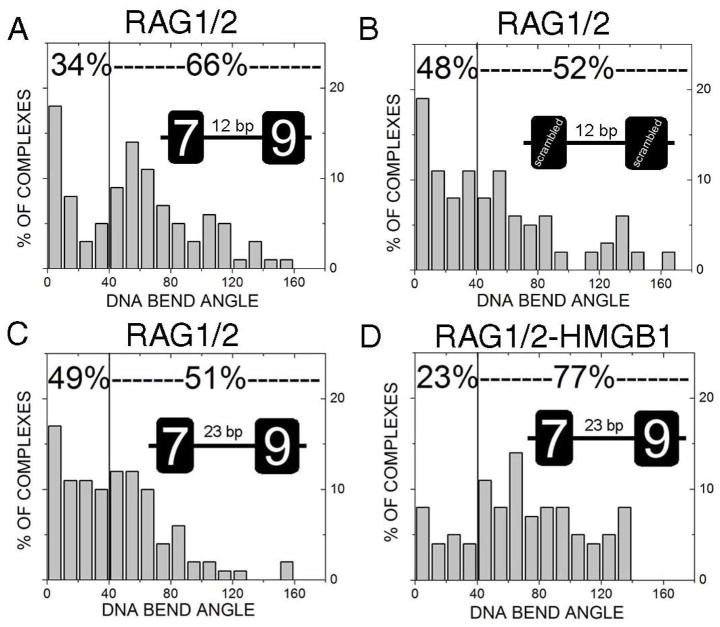
The DNA bending profile of RAG1-12RSS complexes indicates that RAG1 bends the 12RSS substrates with a distinct pattern. Since RAG2 associates with RAG1, which in turn binds to RSS sequences with a higher specificity [Table 1 and (14)], we investigated the role of RAG2 in DNA bending. Representative AFM images of RAG1/2-12RSS(7+9), RAG1/2-23RSS, and RAG1/2-HMGB1-23RSS complexes are shown in Figure 5. Specific complexes were measured for bend angle values. Similar to RAG1-DNA complexes, RAG1/2 also displays a strong bend of the helix. Interestingly, RAG1/2 bound to (7+9) displays a DNA bending pattern similar to the one observed in RAG1-(7+9) with a major peak at 62±5° (Figure 6A). Also, 66% of the complexes are bent greater than 40°, comparable to the complexes formed with RAG1 alone (71%). This finding indicates that RAG2 apparently does not alter the DNA bending profile of RAG1-(7+9). On the other hand, RAG1/2 bound to the (mt7+mt9) site still displayed a diffuse pattern of DNA bending with the majority of complexes with a very shallow DNA bend angle (Fig. 6B), similar to RAG1-(mt7+mt9) complexes (Fig. 4B). Taken together, our data suggests that RAG2 exerts little effect on DNA bending during the interaction between RAG and 12RSS.
Figure 5.
AFM images of RAG1/2-RSS complexes. Preformed RAG1/2 complexes were incubated with 12RSS(7+9). RAG1/2 bound to the location of the (7+9) as shown by the lengths of DNA arms as either 3X or 4X. Panel A displays two complexes with bend angles of 73° (white arrow) and 68° (white arrowhead). Two representatives of RAG1/2-(7+9) complexes are shown in B (~60°) and C (~0°). AFM images of RAG1/2 binding to and bending of 23RSS DNA substrate (displayed by DNA arms of 1X and 2X) are shown in D and E. The protein bending a 23RSS at various angles is shown in the left complex (51°), middle complex (20°), and right complex (71°) in the D panel. The panel E shows the action of both HMGB1 and RAG1/2 on 23RSS, displaying complexes bent at 51° (left complex) and 62° (right complex). A scale bar of 100nm is a size marker for panels A, B, and C while the scale bar of 50 nm shown in D is for panels D and E.
Figure 6.
Differential DNA bending at 12RSS and 23RSS. Bend angle histograms display RAG1/2 bound to the 12RSS(7+9) (A), 12RSS(mt7+mt9) (B), 23RSS (C), and 23RSS in the presence of HMGB1 (D). RAG1/2 bends (7+9) into a bimodal distribution with peaks at 0±5° and 62±5°. Statistical analysis indicates there is a significant difference between RAG1/2 bending at the (7+9) versus (mt7+mt9) (p=0.034) or non-RSS sequence (p=0.037). RAG1/2 bends 23RSS into a bimodal distribution with peaks at 0±17° and 45±6°. Comparing RAG1/2 bending of the 12RSS and 23RSS indicates a significant difference (p=0.027). The RAG1/2-HMGB1 complex bound to 23RSS bends DNA to a peak value at 65±8° near the value of RAG1/2-12RSS.
By using a circular permutation assay, Aidinis et al reported that RAG1/2 induced DNA bends at a 12RSS substrates, but not a 23RSS unless the addition of HMGB1 (18). We wanted to determine whether this differential DNA bending can be revealed by AFM. RAG1/2 bound to the 23RSS DNA fragment was deposited to APS-mica and visualized with AFM (Fig. 5D), and the RAG1/2-23RSS complexes were analyzed. Indeed, we observed significant differences in RAG1/2-induced DNA bend angle profile at the 12RSS versus the 23RSS (p=0.027). Unlike the RAG-induced DNA bending at the specific 12RSS(7+9) substrates (Fig. 6A), the 23RSS-bending profile is less in magnitude (45±6°). This indicates RAG1/2 deflects the DNA helix to a lesser extent on 23RSS than on 12RSS. However, the addition of HMGB1 to the binding reaction results in more apparent DNA bending at the 23RSS than with RAG1/2 alone (77% versus 51%, compare Fig. 6D with 6C). The DNA bend angle profile presents a major peak angle value at 65±8°, which is near the bent conformation, 62±5°, of RAG1/2-12RSS.
Therefore, in addition to confirming the earlier report on differential DNA bending at 12 vs 23RSS for RAG1/2, AFM imaging provides quantitative measurement of conformational changes of various RAG-RSS complexes. Taken together, this analysis reveals a novel feature of the recombinase, that RAG1 with or without RAG2 induces a significant DNA bending at 12RSS.
RAG1/2-induced DNA Bending on Pre-nicked 12RSS
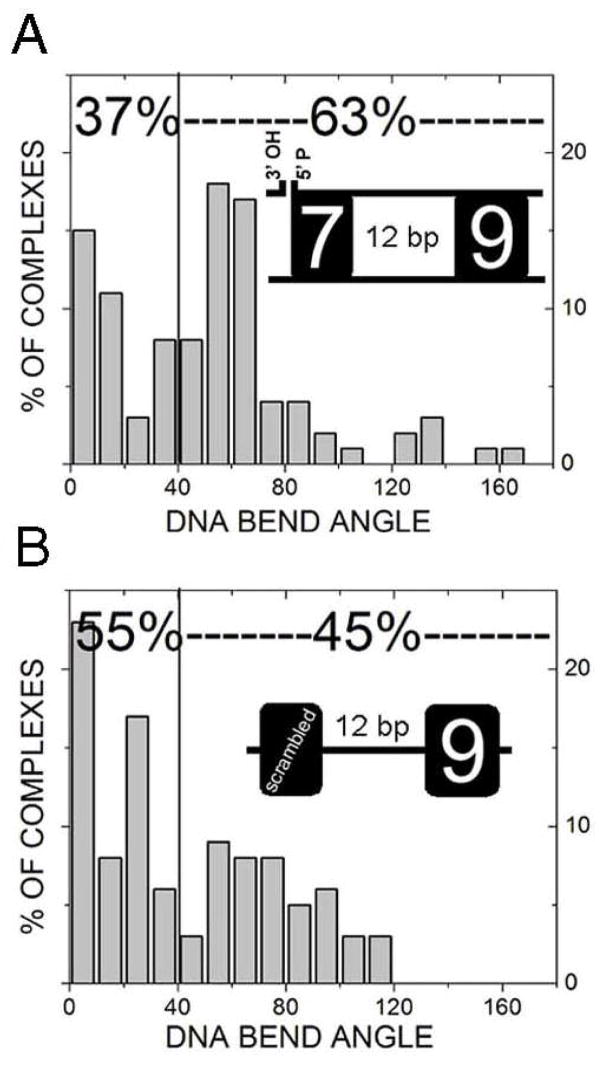
Given the apparent DNA-bending at 12RSS, it is of question whether nicking at the 12RSS heptamer, the step preceding hairpin formation, causes the RAG1/2-RSS complex to adopt a different conformation. To directly address this question, RAG1/2 was incubated with a pre-nicked 12RSS DNA substrate, 12RSS(nik7+9), shown in Fig. 1 (listed as D). RAG1/2 bound to the location of the pre-nicked 12RSS, displaying a binding specificity (S=814±67, Table 1) higher than the intact 12RSS (S=692±63, Table 1). By comparing the DNA bending profile of RAG1/2 on pre-nicked 12RSS and intact 12RSS, we can assess DNA conformation before and after nicking. In the absence of RAG, the pre-nicked 12RSS shows no obvious bending (data not shown). Upon incubation with RAG1/2, the DNA bending profile presents a bimodal distribution with peaks at 0±11° and 58±2° (Fig. 7B), similar to the peaks seen for the intact substrate (compare with Fig. 6A). Furthermore, the proportion of RAG1/2-(7+9) complexes that were bent greater than 40° was 63%, again at the range observed with the intact substrate (66%). This data indicates that RAG1/2-mediated DNA bending and/or distortion is comparable before and after nicking.
Figure 7.
Bend angle histograms for RAG1/2 bound various substrates. The RAG1/2 association with nicked 12-RSS [also termed (7nik+9)] and mutated heptamer substrate [i.e. (mt7+9)] is presented in A and B, respectively. A significant difference was observed in comparing the bending at (7+9) versus (mt7+9) (p=0.012).
Since helix destabilization at the heptamer-coding border has been implicated in the recombination reaction, we wondered whether the heptamer sequence (5′-CACAGTG) dictate the distinct DNA bending pattern. For this, RAG1/2 was incubated with a DNA substrate that contains a mutated heptamer sequence while retaining the nonamer sequence, i.e., 12RSS(mt7+9) (Fig. 1, listed as B). RAG1/2 bound the (mt7+9) with nearly five fold less specificity (S=153±11) than the wild type 12RSS(7+9) (S=692±63) (Table 1), similar to the finding reported by Akamatsu & Oettinger (14). The specific complexes were analyzed for DNA bend angle. The DNA bending pattern (Fig. 7C) displays a diffuse arrangement similar to RAG1/2 bound to (mt7+mt9) (Fig. 6B). Thus, the DNA bend angle profiles of RAG1/2-DNA complexes at (7+9) and (mt7+9) displays a significant difference (p=0.012). This finding indicates that the combination of both the nonamer and heptamer is required for the conformation seen in 12RSS, which is not unexpected as the binding specificity was significantly compromised with this mutant substrate (Table 1).
DISCUSSION
Using AFM, we provide the visual demonstration of the interaction and conformation of RAG-RSS complexes. In addition, the AFM analysis makes it possible for quantitative comparisons of RAG-mediated conformational changes at various recombination substrates and therefore determines the structural composition of both recombinases and substrates required for such changes.
Interactions between RAG and RSS: Role of RAG2
Our AFM analyses directly reveal structural composition and conformations of RAG-RSS complexes. We show here that RAG1 alone induces DNA bending at the 12RSS (Fig. 4A) into a characteristic peak near 60°. Surprisingly, the addition of RAG2 does not change the conformation revealed by AFM (Fig. 6A). Thus, RAG2 does not seem to further augment the strength of bending even though it increases the size and binding specificity of RAG-RSS complex, as shown in Fig. 2 and Table 1, respectively. Therefore, the conformation observed at the 12RSS is largely mediated by RAG1.
The indifference of RAG2 in the observed complex is somewhat unexpected because of a synergistic role of RAG2 in enhancing RAG1-medicated RSS-recognition, which has been reported by many groups (8,9,13,14,22), and also confirmed in our AFM analysis (Table 1). Therefore RAG2 is likely to increase the specificity and stability of the complex by a mechanism other than bending. RAG2 may exert its action through two possible scenarios that are not mutually exclusive. First, RAG2 may interact with the DNA directly through association with RAG1. After DNA bending occurs upon RAG1/2-12RSS binding, RAG2 may interact with the DNA and stabilize or further alter the distorted DNA conformation although this may not be apparent in AFM. Another scenario is that RAG2 may act through a conformational change of RAG1, which may change the DNA binding properties of RAG1/2 relative to RAG1 alone. A conformational change as result of RAG1/2 interactions prior to DNA binding is also consistent with the demonstration of poor recombination cleavage activity on the pre-assembled RSS-bound RAG1, to which RAG2 was added later (8).
RAG1/2-DNA Bending Independent of Nicking
The AFM analysis here has shed light on important structural aspects of RAG-RSS recognition and behavior. We showed that the degree of RAG-induced DNA bending is comparable whether the DNA is nicked or not, suggesting that bending at the cleavage site is not necessarily dependent on the nicking step. Similarly, due to the inherent flexibility imparted by nicked DNA and the lack of conformational change observed in RAG1/2-(nik7+9) versus RAG1/2-12RSS we conclude the complex is likely a tightly organized structure associated with the nicked site. Therefore, the conformation characterized by a DNA-bend angle of ~60° revealed by AFM is likely the structure which is proficient in heptamer nicking and downstream reactions.
In contrast, our AFM analysis shows quantitatively less DNA bending at the RAG-23RSS complex. By directly revealing conformation structure and quantifying the bending angles of RAG-23RSS complex before and after HMGB1 addition (Fig. 6), we show here that the bending angle of RAG-23RSS can be increased from 45±6° to 65±8° by HMGB1, at a level comparable to the one observed in RAG-12RSS complex, 62±5°, which may be an optimal structure for RAG1/2-mediated recombination nicking. Thus, our AFM data provides additional evidence to support the speculation of preferential recombination cleavage initiated at the 12RSS over the 23RSS in the absence of HMGB1, as implicated by various studies (27,28). This speculation is also compatible with the capture model for synapsis, where a RAG-DNA complex (likely a 12RSS) is able to capture a 23RSS, inferred from data regarding the order that components are added (29). Since capturing a 23RSS by RAG-12RSS is more efficient than the reverse, it is likely that there are specific protein conformational changes, which are defined by a 12- or 23RSS signal. Furthermore, the arrangement of the paired complex of RAG-synapsis may be assisted by strong DNA bends. This arrangement is also concluded from recent FRET data which indicates a non-planar configuration for the PC where both of the RSSs are bent similarly and crossed (30).
Although the RSS sequence is most important for DNA recognition by RAG, it is feasible that the spacer composition provides an indirect read-out and may be necessary for a favorable fit (31). Like the V(D)J recombinase, a partial preference for certain spacer sequences has been implicated in the Type IIF endonuclease SfiI which also synapses two DNA strands prior to cleavage (32). The palindromic SfiI recognition site contains a 5 bp spacer of non-specific sequence which may play a role in DNA binding stability depending on its composition (33). Since smooth DNA bending is observed in the crystal structure at each of the DNA strands (34) the flexibility of the spacer DNA may heavily influence DNA recognition. Here, simultaneous binding of the nonamer and heptamer by RAG1/2 create the bending, which may be aided by the spacer composition. Likewise, the lack of inherent flexibility imparted by the nicked 12RSS opposed to its intact counterpart argues that the DNA bending may take place away from the cleavage site possibly inside the RSS.
Supplementary Material
Full methodological details of AFM measurements and enzymatic activity of RAG proteins used in this study. This material is available free of charge via the Internet at http://pubs.acs.org.
Acknowledgments
The authors thank the W.M. Keck Bioimaging Laboratory for use of their equipment and Patrick Swanson at Creighton University for providing mammalian plasmid constructs of MBP-RAG1 and MBP-RAG2.
Abbreviations
- DNA
deoxyribonucleic acid
- AFM
atomic force microscopy
- RSS
recombination signal sequence
Footnotes
This work was supported by National Institute of Health (CA073857 to Y.C.) and ARCS Foundation Scholarship (to J.W.P.).
References
- 1.Eastman QM, Schatz DG. Nucleic Acids Res. 1997;25:4370–4378. doi: 10.1093/nar/25.21.4370. [DOI] [PMC free article] [PubMed] [Google Scholar]
- 2.West RB, Lieber MR. Mol Cell Biol. 1998;18:6408–6415. doi: 10.1128/mcb.18.11.6408. [DOI] [PMC free article] [PubMed] [Google Scholar]
- 3.Yu K, Lieber MR. Mol Cell Biol. 2000;20:7914–7921. doi: 10.1128/mcb.20.21.7914-7921.2000. [DOI] [PMC free article] [PubMed] [Google Scholar]
- 4.Sadofsky MJ, Hesse JE, Gellert M. Nucleic Acids Res. 1994;22:1805–1809. doi: 10.1093/nar/22.10.1805. [DOI] [PMC free article] [PubMed] [Google Scholar]
- 5.Sadofsky MJ, Hesse JE, McBlane JF, Gellert M. Nucleic Acids Res. 1993;21:5644–5650. doi: 10.1093/nar/21.24.5644. [DOI] [PMC free article] [PubMed] [Google Scholar]
- 6.Difilippantonio MJ, McMahan CJ, Eastman QM, Spanopoulou E, Schatz DG. Cell. 1996;87:253–262. doi: 10.1016/s0092-8674(00)81343-4. [DOI] [PubMed] [Google Scholar]
- 7.Spanopoulou E, Zaitseva F, Wang FH, Santagata S, Baltimore D, Panayotou G. Cell. 1996;87:263–276. doi: 10.1016/s0092-8674(00)81344-6. [DOI] [PubMed] [Google Scholar]
- 8.Swanson PC, Desiderio S. Mol Cell Biol. 1999;19:3674–3683. doi: 10.1128/mcb.19.5.3674. [DOI] [PMC free article] [PubMed] [Google Scholar]
- 9.Mo X, Bailin T, Sadofsky MJ. J Biol Chem. 1999;274:7025–7031. doi: 10.1074/jbc.274.11.7025. [DOI] [PubMed] [Google Scholar]
- 10.Arbuckle JL, Fauss LA, Simpson R, Ptaszek LM, Rodgers KK. J Biol Chem. 2001;276:37093–37101. doi: 10.1074/jbc.M105988200. [DOI] [PubMed] [Google Scholar]
- 11.Peak MM, Arbuckle JL, Rodgers KK. J Biol Chem. 2003;278:18235–18240. doi: 10.1074/jbc.M302041200. [DOI] [PubMed] [Google Scholar]
- 12.Nishihara T, Nagawa F, Imai T, Sakano H. J Biol Chem. 2008;283:4877–4885. doi: 10.1074/jbc.M709890200. [DOI] [PubMed] [Google Scholar]
- 13.Swanson PC, Desiderio S. Immunity. 1998;9:115–125. doi: 10.1016/s1074-7613(00)80593-2. [DOI] [PubMed] [Google Scholar]
- 14.Akamatsu Y, Oettinger MA. Mol Cell Biol. 1998;18:4670–4678. doi: 10.1128/mcb.18.8.4670. [DOI] [PMC free article] [PubMed] [Google Scholar]
- 15.Swanson PC. Mol Cell Biol. 2002;22:1340–1351. doi: 10.1128/mcb.22.5.1340-1351.2002. [DOI] [PMC free article] [PubMed] [Google Scholar]
- 16.Cuomo CA, Mundy CL, Oettinger MA. Mol Cell Biol. 1996;16:5683–5690. doi: 10.1128/mcb.16.10.5683. [DOI] [PMC free article] [PubMed] [Google Scholar]
- 17.Ramsden DA, McBlane JF, van Gent DC, Gellert M. Embo J. 1996;15:3197–3206. [PMC free article] [PubMed] [Google Scholar]
- 18.Aidinis V, Bonaldi T, Beltrame M, Santagata S, Bianchi ME, Spanopoulou E. Mol Cell Biol. 1999;19:6532–6542. doi: 10.1128/mcb.19.10.6532. [DOI] [PMC free article] [PubMed] [Google Scholar]
- 19.Shlyakhtenko LS, Gall AA, Filonov A, Cerovac Z, Lushnikov A, Lyubchenko YL. Ultramicroscopy. 2003;97:279–287. doi: 10.1016/S0304-3991(03)00053-6. [DOI] [PubMed] [Google Scholar]
- 20.Pavlicek JW, Oussatcheva EA, Sinden RR, Potaman VN, Sankey OF, Lyubchenko YL. Biochemistry. 2004;43:10664–10668. doi: 10.1021/bi0362572. [DOI] [PubMed] [Google Scholar]
- 21.Ratcliff GC, Erie DA. J Am Chem Soc. 2001;123:5632–5635. doi: 10.1021/ja005750n. [DOI] [PubMed] [Google Scholar]
- 22.Godderz LJ, Rahman NS, Risinger GM, Arbuckle JL, Rodgers KK. Nucleic Acids Res. 2003;31:2014–2023. doi: 10.1093/nar/gkg281. [DOI] [PMC free article] [PubMed] [Google Scholar]
- 23.Furuya N, Komano T. J Bacteriol. 1995;177:46–51. doi: 10.1128/jb.177.1.46-51.1995. [DOI] [PMC free article] [PubMed] [Google Scholar]
- 24.Higashitani A, Greenstein D, Hirokawa H, Asano S, Horiuchi K. J Mol Biol. 1994;237:388–400. doi: 10.1006/jmbi.1994.1242. [DOI] [PubMed] [Google Scholar]
- 25.Ruiz-Maso JA, Lurz R, Espinosa M, Del Solar G. Nucleic Acids Res 2007 [Google Scholar]
- 26.Horton JR, Zhang X, Maunus R, Yang Z, Wilson GG, Roberts RJ, Cheng X. Nucleic Acids Res. 2006;34:939–948. doi: 10.1093/nar/gkj484. [DOI] [PMC free article] [PubMed] [Google Scholar]
- 27.van Gent DC, Hiom K, Paull TT, Gellert M. Embo J. 1997;16:2665–2670. doi: 10.1093/emboj/16.10.2665. [DOI] [PMC free article] [PubMed] [Google Scholar]
- 28.Sawchuk DJ, Weis-Garcia F, Malik S, Besmer E, Bustin M, Nussenzweig MC, Cortes P. J Exp Med. 1997;185:2025–2032. doi: 10.1084/jem.185.11.2025. [DOI] [PMC free article] [PubMed] [Google Scholar]
- 29.Swanson PC. Mol Cell Biol. 2002;22:7790–7801. doi: 10.1128/MCB.22.22.7790-7801.2002. [DOI] [PMC free article] [PubMed] [Google Scholar]
- 30.Ciubotaru M, Kriatchko AN, Swanson PC, Bright FV, Schatz DG. Mol Cell Biol. 2007 doi: 10.1128/MCB.00177-07. [DOI] [PMC free article] [PubMed] [Google Scholar]
- 31.Lee AI, Fugmann SD, Cowell LG, Ptaszek LM, Kelsoe G, Schatz DG. PLoS Biol. 2003;1:E1. doi: 10.1371/journal.pbio.0000001. [DOI] [PMC free article] [PubMed] [Google Scholar]
- 32.Bilcock DT, Halford SE. Mol Microbiol. 1999;31:1243–1254. doi: 10.1046/j.1365-2958.1999.01266.x. [DOI] [PubMed] [Google Scholar]
- 33.Krasnoslobodtsev AV, Shlyakhtenko LS, Lyubchenko YL. J Mol Biol. 2007;365:1407–1416. doi: 10.1016/j.jmb.2006.10.041. [DOI] [PMC free article] [PubMed] [Google Scholar]
- 34.Vanamee ES, Viadiu H, Kucera R, Dorner L, Picone S, Schildkraut I, Aggarwal AK. Embo J. 2005;24:4198–4208. doi: 10.1038/sj.emboj.7600880. [DOI] [PMC free article] [PubMed] [Google Scholar]
- 35.Grundy GJ, Hesse JE, Gellert M. Proc Natl Acad Sci U S A. 2007;104:3078–3083. doi: 10.1073/pnas.0611293104. [DOI] [PMC free article] [PubMed] [Google Scholar]
- 36.Lu CP, Sandoval H, Brandt VL, Rice PA, Roth DB. Nat Struct Mol Biol. 2006 doi: 10.1038/nsmb1154. [DOI] [PubMed] [Google Scholar]
- 37.Sugimura S, Crothers DM. Proc Natl Acad Sci U S A. 2006;103:18510–18514. doi: 10.1073/pnas.0608337103. [DOI] [PMC free article] [PubMed] [Google Scholar]
- 38.Wyatt RT, Rudders RA, Zelenetz A, Delellis RA, Krontiris TG. J Exp Med. 1992;175:1575–1588. doi: 10.1084/jem.175.6.1575. [DOI] [PMC free article] [PubMed] [Google Scholar]
- 39.Raghavan SC, Swanson PC, Wu X, Hsieh CL, Lieber MR. Nature. 2004;428:88–93. doi: 10.1038/nature02355. [DOI] [PubMed] [Google Scholar]
- 40.Raghavan SC, Swanson PC, Ma Y, Lieber MR. Mol Cell Biol. 2005;25:5904–5919. doi: 10.1128/MCB.25.14.5904-5919.2005. [DOI] [PMC free article] [PubMed] [Google Scholar]
- 41.Grawunder U, Lieber MR. Nucleic Acids Res. 1997;25:1375–1382. doi: 10.1093/nar/25.7.1375. [DOI] [PMC free article] [PubMed] [Google Scholar]
- 42.Raghavan SC, Gu J, Swanson PC, Lieber MR. DNA Repair (Amst) 2007;6:751–759. doi: 10.1016/j.dnarep.2006.12.016. [DOI] [PMC free article] [PubMed] [Google Scholar]
Associated Data
This section collects any data citations, data availability statements, or supplementary materials included in this article.
Supplementary Materials
Full methodological details of AFM measurements and enzymatic activity of RAG proteins used in this study. This material is available free of charge via the Internet at http://pubs.acs.org.


