

Abstract
Neurobiological theories of schizophrenia and related psychoses have increasingly emphasized impaired neuronal coordination (i.e., dysfunctional connectivity) as central to the pathophysiology. Although neuroimaging evidence has mostly corroborated these accounts, the basic mechanism(s) of reduced functional connectivity remains elusive. In this study, we examine the developmental trajectory and underlying mechanism(s) of dysfunctional connectivity by using gamma oscillatory power as an index of local and long-range circuit integrity. An early-onset psychosis group and a matched cohort of typically-developing adolescents listened to monaurally presented click-trains, as whole-head magnetoencephalography data were acquired. Consistent with previous work, gamma-band power was significantly higher in right auditory cortices across groups and conditions. However, patients exhibited significantly reduced overall gamma power relative to controls, and showed a reduced ear-of-stimulation effect indicating that ipsi-versus contralateral presentation had less impact on hemispheric power. Gamma-frequency oscillations are thought to be dependent on GABA-ergic interneuronal networks, thus these patients’s impairment in generating and/or maintaining such activity may indicate that local circuit integrity is at least partially compromised early in the disease process. In addition, patients also showed abnormality in long-range networks (i.e., ear-of-stimulation effects) potentially suggesting that multiple stages along auditory pathways contribute to connectivity aberrations found in patients with psychosis.
Keywords: 40 Hz, bipolar, connectivity, magnetoencephalography, MEG, schizophrenia
Recent neuroimaging investigations have increasingly supported models positing disruption in system-level neuronal coordination (i.e., dysfunctional connectivity) as central to the underlying neurobiology of schizophrenia and other psychoses. Such models are also consistent with cognitive descriptions of psychosis, as the integration impairments found in various sensorimotor tasks and across all sensory modalities (Hemsley, 1996; Silverstein et al., 1996; Gray, 1998; Altshuler et al., 2004; Bombin et al., 2005) could emerge from dysfunctional connectivity between involved neural systems. Andreasen and colleagues have proposed that aberrant circuitry in cortical-cerebellar-thalamic-cortical loops impairs information processing in psychosis by disrupting temporal coordination amongst distributed brain systems (Andreasen et al., 1996; Andreasen 1997, 1998). This disruption in coordinating mental activity, termed cognitive dysmetria, is argued to underlie sensory integration deficits as it would impoverish the capacity to integrate incoming stimuli with memory representations, which is necessary for developing adaptive responses given current environmental parameters (Andreasen et al., 1996, 1998, 1999). By contrast, Friston and colleagues have emphasized local circuitry by suggesting that primary pathology lies in synaptic mechanisms mediating the normal operations of a given cortical region. Such abnormal synaptic connections are thought to arise at least partially from ascending neuromodulatory transmitter systems (e.g., dopamine, acetylcholine), which are known to modulate learning-based synaptic changes and be aberrant in psychotic disorders (Friston, 1998). Essentially, these abnormalities at the synaptic level would reduce the fidelity of neuronal interactions between constituent elements of a given mental act (i.e., brain areas), and eventually lead to further pathology in individual elements as a secondary consequence of abnormal input-output dynamics (Friston and Frith, 1995; Friston, 1998).
While pathological emphasis clearly differs amongst theoretical accounts of dysfunctional connectivity, current evidence concerning the underlying mechanism(s) is equally congruent with a variety of positions. On a generic level, the emergent phenomena of dysfunctional connectivity could be mediated by deficient white matter tracts between network elements (i.e., structural deficits), reduced utilization or fidelity of structurally normal neuronal tracts (i.e., purely functional deficits), or a combination of both structural and functional pathologies. Outside of the callosal area (Woodruff et al., 1995; Buchsbaum et al., 2006), evidence for white matter tract abnormalities in schizophrenia and related psychoses is not remarkable. The increasing employment of diffusion tensor imaging (DTI) should eventually yield decisive evidence on this point, but thus far applicable studies have reported mostly negative findings without truly consistent positive findings across studies (Kanaan et al., 2005; Kubicki et al., 2007). Essentially, for any brain region where abnormalities have been found in studies of schizophrenia, at least as many other comparable DTI studies have reported negative results for the same neural region (Kanaan et al., 2005). By contrast, data supportive of functional connectivity deficits in psychosis are widespread in the literature. Initial evidence emerged through correlating inter-regional activation magnitudes using positron-emission tomography (PET), with adult patients exhibiting reduced functional connectivity amongst prefrontal and superior temporal regions, along with abnormally enhanced connectivity between posterior middle temporal and prefrontal cortices (Friston et al., 1996). More recently, several groups have found corroborating evidence of abnormal connectivity in psychosis by correlating the voxel time series of functional-magnetic resonance imaging (fMRI) data. For example, Honey et al. (2005) observed reduced functional connectivity during a continuous performance task between medial superior frontal gyri and both cerebellar and anterior cingulate cortices. Lawrie and colleagues (2002) showed that auditory hallucinations in schizophrenia patients were associated with reduced fronto-temporal connectivity during a sentence completion task, whereas Boksman et al. (2005) demonstrated widespread unfocused interactions amongst right anterior cingulate and bilateral brain regions in a similar group of patients using a word fluency task. In controls, word fluency only elicited robust and highly localized interactions between right anterior cingulate and language-related areas of left temporal cortices (Boksman et al., 2005). Lastly, a recent whole-brain analysis of functional connectivity during rest indicated a distributed widespread-pattern of reduced neuronal interactions in patients with psychosis, suggesting aberrant connectivity may not be restricted to circumscribed areas or specific brain regions (Liang et al., 2006).
Thus, substantial evidence implicates a predominantly functional connectivity disturbance in patients with psychosis. However, the neural mechanism(s) underlying or inducing such inter-regional interactions in the healthy brain, as well as their putative dysfunction in disease, remains an open question. Some have suggested that synchronous gamma oscillations may mediate interactions amongst elements of actively processing systems, by integrating the disparate aspects of stimulus processing performed by diverse regions of a distributed neural system (Singer and Gray, 1995; Engel et al., 1997). This would imply gamma-frequency oscillations are necessary or perhaps even inducing functional connectivity patterns observed in hemodynamic studies, and that abnormal neural interactions associated with psychosis could be a mere consequence of fundamental deficits in gamma-band neuronal activity (Lee et al., 2003a). Several EEG studies recently demonstrated reduced gamma activity and/or synchrony in chronic psychosis as well as first-episode schizophrenia, thus supporting the notion of impaired high-frequency cortical oscillations (Kwon et al., 1999; Lee et al., 2003b; Spencer et al., 2003, 2004; Symond et al., 2005). Furthermore, post-mortem studies of psychosis patients have shown a 40% selective decrease (statistically unrelated to medication) in the axon terminal density of GABA-ergic interneurons that synapse exclusively with pyramidal cells (Pierri et al., 1999). Such local networks of inhibitory interneurons are thought to be critical substrates for the production and maintenance of gamma oscillations, as they are known to function as GABA-gated pacemakers for neocortical oscillatory activity (Bragin et al., 1995; Whittington et al., 1995; Traub et al., 1996; Grothe and Klump, 2000; Bartos et al., 2002; Porjesz et al., 2002).
In the current study, we investigated dysfunctional connectivity by focusing on auditory magnetic steady-state responses (SSR) in a group of normal adolescents and a group with early-onset psychoses. Participants in our patient group had a diagnosis of schizophrenia, schizoaffective disorder, or bipolar disorder with psychotic features. Pooling across specific diagnoses is justified in the sense that there are likely biological markers shared in common among specific manifestations of psychosis which relate more directly to psychosis (e.g., positive symptoms) than to other phenotypes (e.g., negative symptoms, mood instability). Indeed, evidence has shown that the age of achievement of early developmental milestones such as standing, walking, and potty training is predictive of both schizophreniform and non-schizophreniform psychosis later in life (Isohanni et al., 2001). Data has further shown that early-onset psychotic, but not non-psychotic mood disorders are associated with delays in language, social, and/or motor development (Sigurdsson et al., 1999). Thus, by comparing across diagnoses, we aim to illuminate neurobiological correlates of psychosis which, unlike the unique symptomatology, are shared amongst disorders represented in our patient group.
To this end, we localized bilateral neural generators of the 40 Hz SSR and performed time-frequency analyses on the single-trial time series of each source to quantify gamma-band power elicited by a series of pulse trains (40/s) presented monaurally to each ear. The auditory SSR is most often elicited by trains of clicks or amplitude-modulated tones, and substantial evidence suggest that 40 Hz modulation rates evoke the strongest SSR in humans (Stapells et al., 1984; Hari et al., 1989; Boettcher et al., 2001, 2002). Prior studies have also indicated that the magnetic 40 Hz SSR localizes to primary auditory cortices (Pantev et al., 1996; Engelien et al., 2000; Teale et al., 2003). Based on the theoretical relationship between gamma oscillations and dysfunctional connectivity, we hypothesized that adolescents with psychosis would exhibit reduced SSR gamma power bilaterally relative to age- and gender-matched controls. Although a decrease in high-frequency activity would implicate local dysfunction in GABA-ergic interneuronal networks, we also examined long-range circuitry by computing an ear-of-stimulation index per hemisphere that directly reflected 40 Hz power fluctuations associated with the ear stimulated.
Methods and Materials
Subject Selection
We studied 10 adolescents with psychosis (7 male) and 10 typically-developing controls (4 male). The two groups did not differ statistically in education, sex, full-scale IQ, parental socio-economic status, age at MEG scan, or handedness. Additional demographic information is provided in Table 1. In the psychosis group, three patients were diagnosed with schizoaffective disorder, three with bipolar I disorder (with psychotic features), and the remaining four had schizophrenia. All patients were in outpatient treatment. At the time of study, one patient was un-medicated, one was taking only a psycho-stimulant, and eight were taking multiple medications at least one of which was an atypical antipsychotic. Upon entering the study, all participants in the psychotic group were re-diagnosed using the Schedule for Affective Disorders and Schizophrenia for School-Age Children – Present and Lifetime Version (K-SADS-PL; Kaufman et al., 1997), and a review of medical records. Exclusionary criteria included any medical illness affecting CNS function, confounding-dual diagnoses, neurological disorder, history of head trauma, and current substance abuse. Comparison subjects met the same exclusionary criteria, but had no history of Axis I disorder or first-degree relatives with an Axis I diagnosis; all were recruited from the local community. Informed consent was obtained in accord with guidelines of the Colorado Multiple Institutional Review Board.
Table 1.
Demographic Information
| Variable | M, SD:Controls | M, SD:Patients | t-Statistic (df) | P-value |
|---|---|---|---|---|
| Age | 15.82 (1.8) | 14.64 (2.1) | 1.36 (18) | n.s. |
| Handednessa | 0.72 (0.41) | 0.75 (0.13) | 0.25 (18) | n.s. |
| Educationb | 9.40 (0.97) | 8.80 (1.69) | 0.98 (18) | n.s. |
| Full-Scale IQc | 109.60 (14) | 97.80 (14) | 1.91 (18) | n.s. |
| Parental SESd | 36.95 (18.9) | 41.75 (18.4) | 0.57 (18) | n.s. |
| Age at onset | 11.20 (2.97) |
Based on the Annett Handedness Scale (Annett, 1985).
Listed in years.
Wechsler Abbreviated Scale of Intelligence (WASI).
Based on the Hollingshead method (Hollingshead, 1975).
Experimental Paradigm
Monaural trains consisting of 2 ms duration bi-phasic pulses were delivered every 25 ms for a total of 500 ms, as measured at the earpiece. These pulse trains were repeated every 1.5 s until > 200 trials per ear had been collected. All stimuli were produced using E.A.R. TONE 3A (Cabot Safety Corporation, Indianapolis, IN) transducers with 6.25 m of polyurethane tubing (4.75 mm internal diameter) and foam earpiece inserts with 30 dB attenuation to exterior noise. Sound amplitude was 80 dB SPL as measured by a Bruel & Kjaer 2209 SPL meter and 4157 artificial ear. Throughout the paradigm, participants watched a silent video to promote a consistent state of alertness while supine in a magnetically-shielded room (MSR).
Data Acquisition
With an acquisition bandwidth of 0.1–200 Hz, neuromagnetic responses were sampled in epoch mode at 678 Hz using a Magnes 3600 WH equipped with 248 first-order axial-gradiometers (4-D Neuroimaging, San Diego, CA, USA). Each epoch was of 1000 ms duration, including a 200 ms pre-stimulus baseline. All MEG data were subjected to a global noise filter subtracting the external, non-biological noise obtained through the MEG reference channels, and stowed for offline analyses.
Prior to MEG measurement, five coils were attached to the subject’s head and the locations of these coils, together with the three fiducial points and scalp surface, were determined with a 3-D digitizer (Fastrak 3SF0002, Polhemus Navigator Sciences, Colchester, VT, USA). Once the subject was positioned inside the MSR, an electric current was fed to the coils. This induced a measurable magnetic field and allowed the coils to be localized in reference to the sensors. Since coil locations were also known in head coordinates, all MEG measurements could be transformed into a common coordinate system. With this coordinate system (including the scalp surface points) we coregistered each participant’s MEG data with their structural T1-weighted MRI data (for MR acquisition parameters, see Rojas et al., 2005) using the BrainVoyager 2000 software (Version 4.9; Brain Innovations, The Netherlands).
MEG Source Analyses
Artifact rejection was based on a fixed threshold method (MEG level > 1.2 pT), supplemented with visual inspection. Artifact-free epochs from each condition were time-domain averaged and then digitally (forward/backward Butterworth) bandpass filtered 35–45 Hz to emphasize the 40 Hz SSR (Kwon et al., 1999; Ross et al., 2002; Teale et al., 2003). For each participant, an equivalent-current-dipole (ECD) was used to model the neural generator of the contralateral 40 Hz response in each condition (i.e., left ear, right ear). To this end, contour maps were used to identify the subset of sensors covering both magnetic flux extrema of the SSR, which is the most prominent auditory response from 200–500 ms post-stimulus elicited with this paradigm. Using this subset of sensors, we derived a temporal window of 25 ms duration centered on the maximum global field power (GFP) measurement of the SSR between 200–500 ms post-stimulus. The GFP indicates the sum of squares of the magnetic measurements over the subset of sensors for each data point in the averaged and bandpass-filtered epoch. A spatiotemporal dipole-fit was then performed on the neural generator contralateral to acoustic stimulation using the Downhill-Simplex optimization algorithm (with five simplex turns) and a spherically-symmetric conductor model. To be accepted as reliable, the resulting ECD solution had to meet the 0.90 goodness-of-fit criterion.
These dipoles were then combined into a single two-source model for each participant, which was used to calculate an inverse spatial filter for deriving source waveforms for each trial of the raw MEG time series. This operation, termed source space projection (Tesche et al., 1995; Ross et al., 2000), exploits the distinct sensitivity profile possessed by each element of the 248-sensor array to activity in a pre-specified cortical patch (determined from the above described localizations), and thereby utilizes the raw field strength measurements across the array to calculate single waveforms per source indicating the current strength (in nAm) time series within the specific tissue volume. In the current application, this procedure generated two source waveforms (i.e., a contralateral and ipsilateral generator) for each condition per participant. Previous investigations using beamformer approaches, which do not require a priori assumptions regarding source configurations, have demonstrated single-dipoles to be sufficient for modeling the activation of auditory cortices (e.g., Herdman et al., 2003) and thus support the validity of the present analysis. The use of source waveforms confers a significant advantage in signal processing, as averaging across independent sensors reduces intrinsic sensor noise resulting in waveforms with higher signal-to-noise ratios relative to the magnetic field waveforms (Ross et al., 2000). Moreover, conducting subsequent processing, such as time-frequency analyses, on source- versus sensor-waveforms allows greater specificity in regard to neuronal processing in a circumscribed brain region, as measurements are less sensitive to electromagnetic sources in other neural areas.
MEG Spectral Analyses
In each participant, single-trial source waveform data per condition were transformed into the time-frequency domain using complex demodulation (Hoechstetter et al., 2004; Paap and Ktonas, 1977). The resulting spectral density power estimations were then averaged over trials to generate time-frequency displays of complex spectral density (final resolution: 2.5 Hz at 20 ms). These data were then normalized by dividing the power value of each post-stimulus time-frequency bin by the respective frequency’s baseline power (see Figure 1), calculated as the mean power from 140 to 20 ms pre-stimulus onset. Using such a temporal window helped to minimize the influence of filtering artifacts on baseline power calculations. The relative mean 40 Hz power from 200 to 500 ms post-stimulus was then determined for contralateral and ipsilateral generators in each condition and participant. This post-stimulus window was chosen to focus analyses on the SSR rather than transient evoked components based on prior published data (Ross et al., 2002); however, the validity of this window for SSR calculations was also readily discernible from these data (Figure 1). For exploratory purposes, we also applied these analytic procedures to calculate the relative mean power for both 20 Hz and 30 Hz bands during this same time period. The Brain Electrical Source Analysis software (BESA 5.1.4; MEGIS Software GmbH, Germany) was used for all MEG pre-processing, source modeling, and time-frequency decompositions.
Figure 1.

Synopsis of Data Processing Procedure. For each participant, contralateral 40 Hz generators were localized using single-ECDs (one per condition) and subsequently combined into a single two-source model. Source space projection was then applied to this model so that the 248-sensor magnetic time series, corresponding to each condition, was collapsed into two waveforms per trial reflecting the current-strength of each cortical patch (ipsi- and contralateral to the ear stimulated). Next, a time-frequency analysis was performed on the single-trial current-strength waveforms of each participant, and these values were averaged per source and condition and then normalized with respect to their pre-stimulus baseline (shown above). Finally, for each participant and condition, the relative mean 40 Hz power per generator was calculated for the 200–500 ms interval to focus analyses on the 40 Hz SSR. The data depicted above is from a representative control adolescent and appears in neurological convention. The 40 Hz auditory SSR generators and their normalized time-frequency output from each condition have been overlaid onto the subject’s 3D rendition. In each time-frequency plot, latency is shown on the abscissa (0 ms = first pulse in train), frequency on the ordinate, and color represents the degree and direction of power fluctuation (blue = decrease; yellow = no change; red = increase). As shown, the SSR clearly emerges at ~200 ms and begins to dissipate ~500 ms post-stimulus. In addition, 40 Hz responses in each hemisphere were stronger for contralateral ear stimulations, and of all frequencies computed, the 40 Hz frequency bin clearly showed the largest post-stimulus power increase. See text for further description of methodological procedures.
Statistical Analysis
SPSS for Windows (Release 11.0.1) was used for statistical analyses. Significance tests were two-tailed and evaluated at 0.05 alpha. Type III sums of squares were used for ANOVA models. Group differences on demographic variables were examined through independent Student’s t-tests, while source location and peak latency differences were assessed using 2 × 2 mixed-model ANOVAs (i.e., hemisphere-by-group). Our primary comparisons involving relative mean 40 Hz power estimations, for the 200 to 500 ms post-stimulus window, were analyzed in a 2 × 2 × 2 mixed-model ANOVA design, with ear stimulated and hemisphere as within-subjects variables, and group as the between-subjects variable. This 3-way design was also utilized in exploratory analyses of the 20 and 30 Hz bands, and to probe for baseline power differences in each frequency bin.
Results
Source Location and Latency
To examine group differences in functional organization, we conducted a mixed-model ANOVA for each coordinate dimension. These results indicated no significant main effects of hemisphere or group, and no group-by-hemisphere interaction effects for X-(medial-lateral), Y- (anterior-posterior), or Z-coordinate (superior-inferior) locations. In contrast, an overall group effect of peak latency F(1,18) = 5.88 (p < 0.05) was detected, which showed that steady-state responses reached maximum power significantly later in the patient group (see Figure 2). This analysis did not indicate a significant effect of hemisphere or an interaction effect for measures of peak SSR latency.
Figure 2.
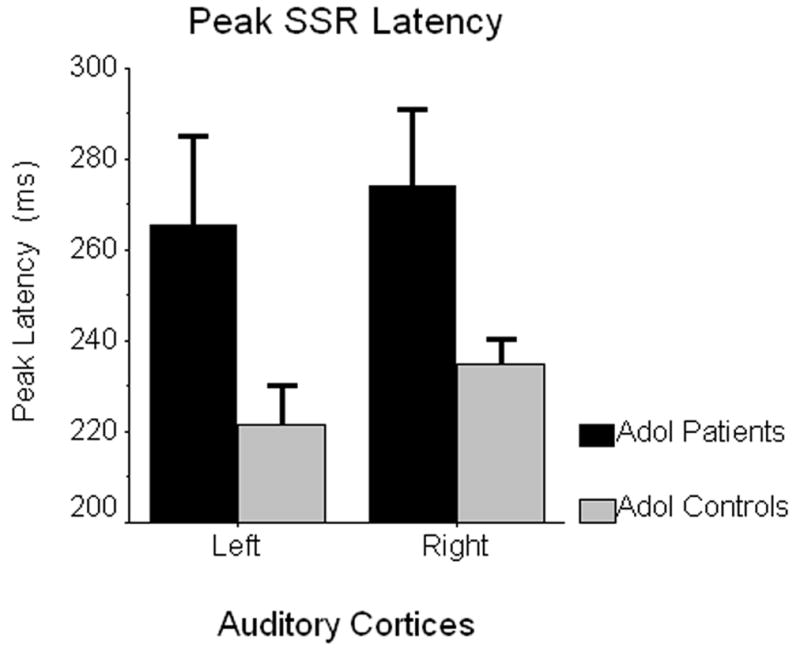
Peak Latency of 40 Hz SSR Generators. Estimated marginal means of peak SSR latency (in ms) are shown on the ordinate, with data for left and right auditory cortices graphed separately on the abscissa (patients in black; controls in gray). Error bars depict one standard error of the mean. Only the group main effect was significant, indicating 40 Hz SSRs reached maximum power substantially later in adolescents with early-onset psychosis relative to their normally-developing peers (p < 0.05).
40 Hz Power Estimations
The main effect of ear stimulated was not significant, but both hemisphere and group effects were significant (see Figure 3). The hemisphere effect indicated significantly greater 40 Hz power for right hemispheric generators across groups F(1,18) = 18.23 (p < 0.001), whereas the between-subjects effect showed significantly reduced overall 40 Hz power in patients relative to controls, F(1,18) = 9.79 (p < 0.01). Neither of the two-term interaction effects involving group were significant, but the ear stimulated-by-hemisphere interaction was significant F(1,18) = 5.33 (p < 0.05), and follow-up tests indicated that right ear stimulation elicited more left hemispheric 40 Hz power across groups, t(19) = 2.59 (p < 0.02). In right auditory cortices, ipsi- versus contralateral stimulation showed no overall effect on 40 Hz power. Lastly, the three-way interaction effect approached significance but did not satisfy our minimum criteria for alpha, F(1,18) = 3.40 (p < 0.10).
Figure 3.

Relative Mean 40 Hz Power for Contra- and Ipsilateral SSR Generators. Normalized 40 Hz power values corresponding to each cortical area are shown on their respective ordinates, with the two stimulation conditions (left and right ear) appearing along the abscissa. The estimated marginal means for the patient group are shown in black, whereas those for controls appear in gray. Error bars depict one standard error of the mean. As shown, adolescent patients exhibited a significant (p < 0.01) reduction in overall 40 Hz power relative to matched controls. In addition, when collapsed across groups and conditions, 40 Hz power was significantly stronger in right relative to left auditory cortices (p < 0.001). There was also an ear stimulated-by-hemisphere interaction effect (p < 0.05), which indicated right ear stimulation elicited more left hemispheric 40 Hz power across the two groups. Lastly, the significantly reduced ear-of-stimulation effect found in patients (p < 0.02) is also easily discernable from these data.
Given the evidence for aberrant long-range connectivity in schizophrenia and other psychoses (e.g., Andreasen et al., 1996), we wanted to assess the overall ‘ear-of-stimulation’ effect on 40 Hz power in right and left auditory cortices. To this end, we computed an ear-of-stimulation index (within-subject) for each hemisphere that reflected 40 Hz power difference as a function of ear stimulated. These measures were entered into a 2 × 2 mixed-model ANOVA (i.e., ear stimulated-by-group), which revealed that ear-of-stimulation effects did not differ statistically for right and left auditory cortices and that this held consistent across groups. In contrast, the main effect of group was significant F(1,18) = 6.99 (p < 0.02) indicating that the overall effect of contra- versus ipsilateral acoustic stimulation was reduced in adolescents with psychosis.
20 Hz, 30 Hz, and Baseline Power Estimations
To scrutinize the specificity and basis of these 40 Hz findings, we performed a series of exploratory 3-way ANOVA analyses (ear stimulated, hemisphere, and group) examining baseline power estimations, and relative mean 20 Hz and 30 Hz power during the 200–500 ms post-stimulus window. These exploratory analyses yielded only negative findings, as we did not detect any main or interaction effects for baseline power at 20 Hz (all p’s > 0.64), 30 Hz (all p’s > 0.46), or 40 Hz (all p’s > 0.24). Likewise, probing relative mean power during the 200 to 500 ms SSR period indicated null results at both 20 Hz (all p’s > 0.17) and 30 Hz (all p’s > 0.13).
Discussion
We examined contra- and ipsilateral generators of the auditory 40 Hz SSR in a group of healthy adolescents, and a matched sample with psychosis. Across these groups, gamma-band SSRs were significantly stronger in right relative to left auditory cortices and showed a right ear advantage for left-hemispheric source power, both of which are consistent with previous data from normal adult participants (Ross et al., 2005). With regard to primary hypotheses, our results indicated that gamma power was significantly weaker and peaked later in adolescents with psychosis relative to their normally-developing peers. These findings extend previous reports of gamma abnormalities associated with schizophrenia and other psychoses (Kwon et al., 1999; Lee et al., 2003b; Spencer et al., 2003, 2004; Symond et al., 2005) to early-onset psychoses. Finally, we observed a reduced ear-of-stimulation effect in adolescent patients, which may indicate that anomalous long-range neuronal tracts contribute to the connectivity disturbances often associated with psychosis. Below, we discuss the implications of these findings for dysfunctional connectivity accounts of psychosis (e.g., Andreasen et al., 1996; Friston 1998), with a particular focus on the overall landscape of cortical connectivity.
Our finding of right greater than left gamma power is largely consistent with a recent MEG study investigating laterality of auditory neural responses in normal adults (Ross et al., 2005). Using monaural and binaural stimulation paradigms, Ross et al. (2005) demonstrated that all auditory components (i.e., transient gamma-band, P1m, N1m, 40 Hz SSR, and sustained responses) showed laterality toward the contralateral hemisphere during monaural stimulation. However, during binaural stimulation, only the sustained response and SSR showed significant laterality indexes, with both indicating right hemispheric dominance (Ross et al., 2005). Our main effect of greater right hemispheric gamma-band power is analogous to these findings, and also corroborates other studies detecting the same effect while investigating other aspects of the SSR (e.g., Schneider et al., 2002; Hertrich et al., 2004). Although the functional significance of auditory SSR is not fully understood, this right-hemispheric dominance is thought to reflect the broad hemispheric specialization dichotomy of rapid temporal processing (e.g., speech) in left and envelope processing (e.g., music) in right auditory cortices (Tervaniemi and Hugdahl, 2003). By comparison, our across group finding of a right ear advantage for left-hemispheric source power is far less consistent with previous reports. Ross et al. (2005) showed a significant left ear advantage for right-hemispheric power, but only a trend toward a right ear advantage in left auditory cortices (i.e., the reverse pattern of our data). However, we believe that this difference is largely attributable to the fact that normally-developing adolescents exhibit increased within-group variance, as well as to the inclusion of patient data in all analyses due to our primary focus being between-group effects. In actuality, the asymmetry pattern reported by Ross et al. (2005) is remarkably similar to control data shown in Figure 3.
The overall reduction in 40 Hz power exhibited by adolescents with psychosis is our most important finding, as it indicates gamma abnormalities emerge early in the disease process and conveys crucial information concerning the underlying nature of connectivity disruptions in psychosis. Previous hemodynamic studies of psychotic adults have shown reduced functional connectivity amongst constituent elements of task-specific neural networks (Friston et al., 1996; Lawrie et al., 2002; Boksman et al., 2005; Honey et al., 2005), but DTI studies in the same population have not yet provided consistent evidence for structural tract aberrations as a potential substrate (Kanaan et al., 2005; Kubicki et al., 2007). Thus, the gamma-band abnormalities detected in these adolescents, and those previously reported in adult patients (Lee et al., 2003a, 2003b; Spencer et al., 2003; O’Donnell et al., 2004; Symond et al., 2005), may reflect the same basic mechanisms detected in hemodynamic studies of dysfunctional connectivity in psychosis. Essentially, given the largely negative findings from DTI, inter-regional connectivity may be preserved in schizophrenia but not efficiently utilized because of a reduced capacity to generate and/or maintain high-frequency oscillatory activity, which although speculative could be mediated by an inherent lack of local inhibitory functioning (Pierri et al., 1999). Multiple investigators have further described significant correlations between distinct gamma-based indexes (e.g., synchronicity, phase-locking) and other symptom dimensions in patients with chronic schizophrenia (Lee et al., 2003b; Spencer et al., 2004), thus making the important connection with behavioral symptomatology. Lastly, it is worth noting that our 40 Hz click-train maximally entrained intrinsic gamma-frequency oscillators significantly earlier in normally-developing adolescents, which supports a previous report using the same stimulus in schizophrenic adults (Kwon et al., 1999) and corroborates the notion of an inherent deficiency in generating gamma-band activity in psychosis.
Although local circuit integrity was the primary focus of this study, we also utilized the distinctive architecture of early neural pathways serving the auditory system (i.e., the incomplete decussation) to investigate more long-range connectivity patterns beyond the neocortex. By computing a contra- versus ipsilateral stimulation metric for each SSR generator, we found a significantly reduced overall ear-of-stimulation effect in adolescents with psychosis. This finding suggests that abnormal connectivity is not confined to cortical regions in psychosis, but may actually involve some of the central nervous system’s earliest pathways. However, given the nature of these data, it is unclear whether this reduction in asymmetry is primarily attributable to long-range connectivity aberrations, or simply irregular patterns of auditory tract decussation. To our knowledge, functional connectivity along these pathways has not been directly examined in previous studies of schizophrenia or other psychoses (irrespective of age), which is surprising given the straightforward implications such abnormality would hold for observable symptomatology (e.g., deficient sound localization). Thus, although intriguing, this finding needs to be further scrutinized by future investigators, as well as extended to other auditory stimuli and potentially to other sensory modalities where unilateral stimulation is known to evoke bilateral activation (e.g., somatosensory system). Due to the temporal dynamics of the SSR, including its late peak (i.e., after 200 ms) and prolonged duration (i.e., 200–500 ms), potential callosal contributions in generating and/or sustaining ipsilateral gamma activity will need to be carefully probed in future work, especially given the corpus collosum anomalies known to be associated with psychosis (Woodruff et al., 1995; Buchsbaum et al., 2006).
In conclusion, our primary findings indicate a specific abnormality in the production and/or maintenance of bilateral auditory 40 Hz activity in adolescents with early-onset psychosis. We believe that reduced quantities of GABA-ergic interneurons or functional synapses may be the neural mechanism underlying this impairment due to the known role of such cells in generating high-frequency activity. Overall, these findings augment current dysfunctional connectivity theories of psychosis (Andreasen et al., 1996, 1998; Friston, 1998) by supplying evidence of local circuitry aberrations early in the disease process, as well as inaugural data suggesting functionally abnormal neural tracts connecting higher systems with the initial sensory interface. A currently widespread belief in neurophysiology holds that gamma oscillations are crucial to coordinating information processing; thus, impairment in generating high-frequency activity could be expressed as a failure to integrate information elements processed by disparate brain regions. Such a mechanism would be consistent with the corpus of hemodynamic data supporting aberrant cortical coordination in psychosis, as these methods are unable to distinguish the locus of functional connectivity impairments (i.e., aberrant neuronal tracts and/or local circuitry deficits). In light of post-mortem work (Pierri et al., 1999), we believe that this is an important consideration as a local circuit dysfunction could impair long range communication over intact neuronal tracts, and ultimately yield the overall pattern of dysfunctional connectivity and disintegration symptomatology commonly found in psychosis patients.
To close, it is important to recognize limitations of this work including the small sample size, inherent difficulty of diagnostic specificity in cases of early-onset psychosis, and the relatively unknown effects of medication on neuronal indices, all of which limit the generalizability of these findings. One of the principle limitations of the study is that while sufficiently powered to detect differences between adolescents with and without a history of psychosis, the sample was too small to adequately address whether differences in gamma-band power might exist between subjects with mood-related psychoses and schizophreniform psychoses. Prior studies that used identical stimuli have reported power reductions in the adult form of each disorder relative to well-matched control groups (e.g., Kwon et al., 1999; O’Donnell et al., 2004). Thus, we believe the similarity of findings across these studies indicates that such differences, if they exist, will be small, necessitating rather large samples in any follow-up investigation attempting direct comparisons. As such, we do not assert in this study that there is any evidence for a difference or lack thereof in gamma-band power between various psychotic subgroups. In regard to medication, it is worth noting that Hong et al. (2004) reported reduced gamma-band power in non-medicated first-degree relatives of schizophrenia patients compared to healthy controls, and a significant inverse correlation between 40 Hz power and dosage of typical, but not atypical, antipsychotic medications in adult patients (Hong et al., 2004). Moreover, their atypically-medicated patients with schizophrenia actually showed significantly greater 40 Hz power relative to the control group (Hong et al., 2004), which clearly argues against attributing our findings to medication effects as all patients on antipsychotic drugs (i.e., 8/10) were taking the atypical type at the time of study. A final caveat to this and related work is that functional connectivity aberrations cannot be considered specific to psychosis as they have been reported in other conditions that share significant symptomatology (e.g., autistic disorder; Just et al., 2004). This overall pattern could indicate that such anomalies in neural connectivity, whether quantified through DTI, fMRI, MEG, or another methodology, are better understood as neurobiological markers of nonspecific risk factors or features of the symptomatology which, like the behavioral symptoms themselves, are shared across some neurodevelopmental disorders.
Acknowledgments
This work was supported by grants from the National Institute of Mental Health (R01 MH63442-02), and the Developmental Psychobiology Research Group (DPRG) of the University of Colorado Health Sciences Center (UCHSC), Denver, CO, USA. Support for TWW was provided by USPHS grant T32 MH15442, ‘Development of Maladaptive Behavior’ (UCHSC Institutional Postdoctoral Research Training Program), and grant F32 MH78359, ‘Sensorimotor Interactions in Childhood Schizophrenia.’
References
- Altshuler LL, Ventura J, van Gorp WG, Green MF, Theberge DC, Mintz J. Neurocognitive function in clinically stable men with bipolar I disorder or schizophrenia and normal control subjects. Biol Psychiatry. 2004;56:560–569. doi: 10.1016/j.biopsych.2004.08.002. [DOI] [PubMed] [Google Scholar]
- Andreasen NC. Linking mind and brain in the study of mental illness: a project for a scientific psychopathology. Science. 1997;275:1586–1593. doi: 10.1126/science.275.5306.1586. [DOI] [PubMed] [Google Scholar]
- Andreasen NC. A unitary model of schizophrenia: Bleuler’s “fragmented phrene” as schizencephaly. Arch Gen Psychiatry. 1998;56:781–787. doi: 10.1001/archpsyc.56.9.781. [DOI] [PubMed] [Google Scholar]
- Andreasen NC, Nopoulos P, O’Leary DS, Miller DD, Wassink T, Flaum M. Defining the phenotype of schizophrenia: cognitive dysmetria and its neural mechanisms. Biol Psychiatry. 1999;46:908–920. doi: 10.1016/s0006-3223(99)00152-3. [DOI] [PubMed] [Google Scholar]
- Andreasen NC, O’Leary DS, Cizadlo T, Arndt S, Rezai K, Boles-Ponto LL, et al. Schizophrenia and cognitive dysmetria: a positron-emission tomography study of dysfunctional prefrontal-thalamic-cerebellar circuitry. Proc Natl Acad Sci USA. 1996;93:9985–9990. doi: 10.1073/pnas.93.18.9985. [DOI] [PMC free article] [PubMed] [Google Scholar]
- Andreasen NC, Paradiso S, O’Leary DS. Cognitive dysmetria” as an integrative theory of schizophrenia: a dysfunction in cortical-subcortical-cerebellar circuitry? Schizophr Bull. 1998;24:203–218. doi: 10.1093/oxfordjournals.schbul.a033321. [DOI] [PubMed] [Google Scholar]
- Annett M. Left, right, hand and brain: the right shift theory. Hillsdale: Lawrence Erlbaum Associates; 1985. [Google Scholar]
- Bartos M, Vida I, Frotscher M, Meyer A, Monyer H, Geiger JRP, et al. Fast synaptic inhibition promotes synchronized gamma oscillations in hippocampal interneuron networks. Proc Natl Acad Sci USA. 2002;99:13222–13227. doi: 10.1073/pnas.192233099. [DOI] [PMC free article] [PubMed] [Google Scholar]
- Boettcher FA, Madhotra D, Poth EA, Mills JH. The frequency-modulation following response in young and aged human subjects. Hear Res. 2002;165:10–18. doi: 10.1016/s0378-5955(01)00398-7. [DOI] [PubMed] [Google Scholar]
- Boettcher FA, Poth EA, Mills JH, Dubno JR. The amplitude-modulation following response in young and aged human subjects. Hear Res. 2001;153:32–42. doi: 10.1016/s0378-5955(00)00255-0. [DOI] [PubMed] [Google Scholar]
- Boksman K, Theberge J, Williamson P, Drost DJ, Malla A, Densmore M, et al. A 4.0-T fMRI study of brain connectivity during word fluency in first-episode schizophrenia. Schizophr Res. 2005;75:247–263. doi: 10.1016/j.schres.2004.09.025. [DOI] [PubMed] [Google Scholar]
- Bombin I, Arango C, Buchanan RW. Significance and meaning of neurological signs in schizophrenia: two decades later. [Review] Schizophr Bull. 2005;31:962–977. doi: 10.1093/schbul/sbi028. [DOI] [PubMed] [Google Scholar]
- Bragin A, Jando G, Nadasdy Z, Hetke J, Wise K, Buzsaki G. Gamma (40–100 Hz) oscillation in the hippocampus of the behaving rat. J Neurosci. 1995;15:47–60. doi: 10.1523/JNEUROSCI.15-01-00047.1995. [DOI] [PMC free article] [PubMed] [Google Scholar]
- Buchsbaum MS, Friedman J, Buchsbaum BR, Chu KW, Hazlett EA, Newmark R, et al. Diffusion tensor imaging in schizophrenia. Biol Psychiatry. 2006;60:1181–1187. doi: 10.1016/j.biopsych.2005.11.028. [DOI] [PubMed] [Google Scholar]
- Engel AK, Roelfsema PR, Fries P, Brecht M, Singer W. Role of the temporal domain for response selection and perceptual binding. Cereb Cortex. 1997;7:571–582. doi: 10.1093/cercor/7.6.571. [DOI] [PubMed] [Google Scholar]
- Engelien A, Schulz M, Ross B, Arolt V, Pantev C. A combined functional in vivo measure for primary and secondary auditory cortices. Hear Res. 2000;148:153–160. doi: 10.1016/s0378-5955(00)00148-9. [DOI] [PubMed] [Google Scholar]
- Friston KJ. The disconnection hypothesis. Schizophr Res. 1998;30:115–125. doi: 10.1016/s0920-9964(97)00140-0. [DOI] [PubMed] [Google Scholar]
- Friston KJ, Frith CD. Schizophrenia: a disconnection syndrome. Clin Neurosci. 1995;3:89–97. [PubMed] [Google Scholar]
- Friston KJ, Herold S, Fletcher P, Silbersweig D, Cahill C, Dolan RJ, et al. Abnormal fronto-temporal interactions in schizophrenia. In: Watson SJ, editor. Biology of schizophrenia and affective disease. 1. Washington, DC: American Psychiatric Press; 1996. pp. 421–429. [Google Scholar]
- Gray JA. Integrating schizophrenia. Schizophr Bull. 1998;24:249–266. doi: 10.1093/oxfordjournals.schbul.a033324. [DOI] [PubMed] [Google Scholar]
- Grothe B, Klump BM. Temporal processing in sensory systems. Curr Opin Neurobiol. 2000;10:467–473. doi: 10.1016/s0959-4388(00)00115-x. [DOI] [PubMed] [Google Scholar]
- Hari R, Hamalainen M, Joutsiniemi SL. Neuromagnetic steady-state responses to auditory stimuli. J Acoust Soc Am. 1989;86:1033–1039. doi: 10.1121/1.398093. [DOI] [PubMed] [Google Scholar]
- Hemsley DR. Schizophrenia: A cognitive model and its implications for psychological intervention. Behav Modif. 1996;20:139–169. doi: 10.1177/01454455960202001. [DOI] [PubMed] [Google Scholar]
- Herdman AT, Wollbrink A, Chau W, Ishii R, Ross B, Pantev C. Determination of activation areas in the human auditory cortex by means of synthetic aperture magnetometry. Neuroimage. 2003;20:995–1005. doi: 10.1016/S1053-8119(03)00403-8. [DOI] [PubMed] [Google Scholar]
- Hertrich I, Mathiak K, Lutzenberger W, Ackermann H. Transient and phase-locked evoked magnetic fields in response to periodic acoustic signals. NeuroReport. 2004;15:1687–1690. doi: 10.1097/01.wnr.0000134930.04561.b2. [DOI] [PubMed] [Google Scholar]
- Hoechstetter K, Bornfleth H, Weckesser D, Ille N, Berg P, Scherg M. BESA source coherence: a new method to study cortical oscillatory coupling. Brain Topogr. 2004;16:233–238. doi: 10.1023/b:brat.0000032857.55223.5d. [DOI] [PubMed] [Google Scholar]
- Hollingshead AB. Four factor index of social status. New Haven: Yale University; 1975. [Google Scholar]
- Hong LE, Summerfelt A, McMahon R, Adami H, Francis G, Elliott A, et al. Evoked gamma band synchronization and the liability for schizophrenia. Schizophr Res. 2004;70:293–302. doi: 10.1016/j.schres.2003.12.011. [DOI] [PubMed] [Google Scholar]
- Honey GD, Pomarol-Clotet E, Corlett PR, Honey RAE, McKenna PJ, Bullmore ET, et al. Functional dysconnectivity in schizophrenia associated with attentional modulation of motor function. Brain. 2005;128:2597–2611. doi: 10.1093/brain/awh632. [DOI] [PMC free article] [PubMed] [Google Scholar]
- Isohanni M, Jones PB, Moilanen K, Rantakallio P, Veijola J, Oja H, et al. Early developmental milestones in adult schizophrenia and other psychoses. A 31-year follow-up of the northern Finland 1966 birth cohort. Schizophr Res. 2001;52:1–19. doi: 10.1016/s0920-9964(00)00179-1. [DOI] [PubMed] [Google Scholar]
- Just MA, Cherkassky VL, Keller TA, Minshew NJ. Cortical activation and synchronization during sentence comprehension in high-functioning autism: evidence of under-connectivity. Brain. 2004;127:1811–1821. doi: 10.1093/brain/awh199. [DOI] [PubMed] [Google Scholar]
- Kanaan RAA, Kim JS, Kaufmann WE, Pearlson GD, Barker GJ, McGuire PK. Diffusion tensor imaging in schizophrenia. [Review] Biol Psychiatry. 2005;58:921–929. doi: 10.1016/j.biopsych.2005.05.015. [DOI] [PubMed] [Google Scholar]
- Kaufman J, Birmaher B, Brent D, Rao U, Flynn C, Moreci P, et al. Schedule for affective disorders and schizophrenia for school-age children – present and lifetime version (K-SADS-PL): initial reliability and validity data. J Am Acad Child Adolesc Psychiatry. 1997;36:980–988. doi: 10.1097/00004583-199707000-00021. [DOI] [PubMed] [Google Scholar]
- Kubicki M, McCarley R, Westin CF, Park HJ, Maier S, Kikinis R, et al. A review of diffusion tensor imaging studies in schizophrenia. [Review] J Psychiatr Res. 2007;41:15–30. doi: 10.1016/j.jpsychires.2005.05.005. [DOI] [PMC free article] [PubMed] [Google Scholar]
- Kwon JS, O’Donnell BF, Wallenstein GV, Greene RW, Hirayasu Y, Nestor PG, et al. Gamma frequency-range abnormalities to auditory stimulation in schizophrenia. Arch Gen Psychiatry. 1999;56:1001–1005. doi: 10.1001/archpsyc.56.11.1001. [DOI] [PMC free article] [PubMed] [Google Scholar]
- Lawrie SM, Buechel C, Whalley HC, Frith CD, Friston KJ, Johnstone EC. Reduced frontotemporal functional connectivity in schizophrenia associated with auditory hallucinations. Biol Psychiatry. 2002;12:1008–1011. doi: 10.1016/s0006-3223(02)01316-1. [DOI] [PubMed] [Google Scholar]
- Lee KH, Williams LM, Breakspear M, Gordon E. Synchronous gamma activity: a review and contribution to an integrative neuroscience model of schizophrenia. [Review] Brain Res Brain Res Rev. 2003a;41:57–78. doi: 10.1016/s0165-0173(02)00220-5. [DOI] [PubMed] [Google Scholar]
- Lee KH, Williams LM, Haig A, Gordon E. Gamma (40 Hz) phase synchronicity and symptom dimensions in schizophrenia. Cognitive Neuropsychiatry. 2003b;8:57–71. doi: 10.1080/713752240. [DOI] [PubMed] [Google Scholar]
- Liang M, Zhou Y, Jiang T, Liu Z, Tian L, Liu H, et al. Widespread functional disconnectivity in schizophrenia with resting-state functional magnetic resonance imaging. NeuroReport. 2006;17:209–213. doi: 10.1097/01.wnr.0000198434.06518.b8. [DOI] [PubMed] [Google Scholar]
- O’Donnell BF, Hetrick WP, Vohs JL, Krishnan GP, Carroll CA, Shekhar A. Neural synchronization deficits to auditory stimulation in bipolar disorder. NeuroReport. 2004;15:1369–1372. doi: 10.1097/01.wnr.0000127348.64681.b2. [DOI] [PubMed] [Google Scholar]
- Pantev C, Roberts LE, Elbert T, Ross B, Wienbruch C. Tonotopic organization of the sources of human auditory steady-state responses. Hear Res. 1996;102:62–74. doi: 10.1016/s0378-5955(96)00133-5. [DOI] [PubMed] [Google Scholar]
- Papp N, Ktonas P. Critical evaluation of complex demodulation techniques for the quantification of bioelectrical activity. Biomed Sci Instrum. 1977;13:135–143. [PubMed] [Google Scholar]
- Pierri JN, Chaudry AS, Woo TUW, Lewis DA. Alterations in chandelier neuron axon terminals in the prefrontal cortex of schizophrenic subjects. Am J Psychiatry. 1999;156:1709–1719. doi: 10.1176/ajp.156.11.1709. [DOI] [PubMed] [Google Scholar]
- Porjesz B, Almasy L, Edenberg HJ, Wang K, Chorlian DB, Foroud T, et al. Linkage disequilibrium between the beta frequency of the human EEG and a GABA-A receptor gene locus. Proc Natl Acad Sci USA. 2002;99:3729–3733. doi: 10.1073/pnas.052716399. [DOI] [PMC free article] [PubMed] [Google Scholar]
- Rojas DC, Camou SL, Reite ML, Rogers SJ. Planum temporale volume in children and adolescents with autism. J Autism Dev Disord. 2005;35:479–486. doi: 10.1007/s10803-005-5038-7. [DOI] [PubMed] [Google Scholar]
- Ross B, Borgmann C, Draganova R, Roberts LE, Pantev C. A high-precision magnetoencephalographic study of human auditory steady-state responses to amplitude-modulated tones. J Acoust Soc Am. 2000;108:679–691. doi: 10.1121/1.429600. [DOI] [PubMed] [Google Scholar]
- Ross B, Picton TW, Pantev C. Temporal integration in the human auditory cortex as represented by the development of the steady-state magnetic field. Hear Res. 2002;165:68–84. doi: 10.1016/s0378-5955(02)00285-x. [DOI] [PubMed] [Google Scholar]
- Ross B, Herdman AT, Pantev C. Right hemispheric laterality of human 40 Hz auditory steady-state responses. Cereb Cortex. 2005;15:2029–2039. doi: 10.1093/cercor/bhi078. [DOI] [PubMed] [Google Scholar]
- Schneider P, Scherg M, Dosch HG, Specht HJ, Gutschalk A, Rupp A. Morphology of Heschl’s gyrus reflects enhanced activation in the auditory cortex of musicians. Nat Neurosci. 2002;5:688–694. doi: 10.1038/nn871. [DOI] [PubMed] [Google Scholar]
- Sigurdsson E, Fombonne E, Sayal K, Checkley S. Neurodevelopmental antecedents of early-onset bipolar affective disorder. Br J Psychiatry. 1999;174:121–127. doi: 10.1192/bjp.174.2.121. [DOI] [PubMed] [Google Scholar]
- Silverstein SM, Knight RA, Schwarzkopf SB, West LL, Osborn LM, Kamin D. Stimulus configuration and context effects in perceptual organization in schizophrenia. J Abnorm Psychol. 1996;105:410–420. doi: 10.1037//0021-843x.105.3.410. [DOI] [PubMed] [Google Scholar]
- Singer W, Gray CM. Visual feature integration and the temporal correlation hypothesis. Annu Rev Neurosci. 1995;18:555–586. doi: 10.1146/annurev.ne.18.030195.003011. [DOI] [PubMed] [Google Scholar]
- Spencer KM, Nestor PG, Niznikiewicz MA, Salisbury DF, Shenton ME, McCarley RW. Abnormal neural synchrony in schizophrenia. J Neurosci. 2003;23:7407–7411. doi: 10.1523/JNEUROSCI.23-19-07407.2003. [DOI] [PMC free article] [PubMed] [Google Scholar]
- Spencer KM, Nestor PG, Perlmutter R, Niznikiewicz MA, Klump MC, Frumin M, et al. Neural synchrony indexes disordered perception and cognition in schizophrenia. Proc Natl Acad Sci USA. 2004;101:17288–17293. doi: 10.1073/pnas.0406074101. [DOI] [PMC free article] [PubMed] [Google Scholar]
- Stapells DR, Linden D, Suffield JB, Hamel G, Picton TW. Human auditory steady state potentials. Ear Hear. 1984;5:105–113. doi: 10.1097/00003446-198403000-00009. [DOI] [PubMed] [Google Scholar]
- Symond MB, Harris AWF, Gordon E, Williams LM. Gamma synchrony” in first-episode schizophrenia: a disorder of temporal connectivity? Am J Psychiatry. 2005;162:459–465. doi: 10.1176/appi.ajp.162.3.459. [DOI] [PubMed] [Google Scholar]
- Teale PD, Carlson J, Rojas DC, Reite ML. Reduced laterality of the source locations for generators of the auditory steady-state field in schizophrenia. Biol Psychiatry. 2003;54:1149–1153. doi: 10.1016/s0006-3223(03)00411-6. [DOI] [PubMed] [Google Scholar]
- Tervaniemi M, Hugdahl K. Lateralization of auditory-cortex functions. [Review] Brain Res Brain Res Rev. 2003;43:231–246. doi: 10.1016/j.brainresrev.2003.08.004. [DOI] [PubMed] [Google Scholar]
- Tesche CD, Uusitalo MA, Ilmoniemi RJ, Huotilainen M, Kajola M, Salonen O. Signal-space projections of MEG data characterize both distributed and well-localized neuronal sources. Electroencephalogr Clin Neurophysiol. 1995;95:189–200. doi: 10.1016/0013-4694(95)00064-6. [DOI] [PubMed] [Google Scholar]
- The Psychological Corporation. The Wechsler abbreviated scale of intelligence. San Antonio: Harcourt Brace; 1999. [Google Scholar]
- Traub RD, Whittington MA, Stanford IM, Jefferys JA. Mechanism for generation of long-range synchronous fast oscillations in the cortex. Nature. 1996;383:621–624. doi: 10.1038/383621a0. [DOI] [PubMed] [Google Scholar]
- Whittington MA, Traub RD, Jefferys JG. Synchronized oscillations in interneuron networks driven by metabotropic glutamate receptor activation. Nature. 1995;373:612–615. doi: 10.1038/373612a0. [DOI] [PubMed] [Google Scholar]
- Woodruff PW, McManus IC, David AS. Meta-analysis of corpus callosum size in schizophrenia. J Neurol Neurosurg Psychiatry. 1995;58:457–461. doi: 10.1136/jnnp.58.4.457. [DOI] [PMC free article] [PubMed] [Google Scholar]