

Abstract
In the United States, despite substantial investment in public health initiatives to promote early detection of breast cancer through screening mammography, the proportion of female breast cancers that have advanced beyond the localized stage by the time of diagnosis remains high. Our objective in this exploratory study was to investigate whether stage of breast cancer at diagnosis among Chicago residents is associated with characteristics of the neighborhoods in which proximate mammography facilities are located. Those characteristics may influence likelihood of utilizing the service routinely and partly explain differences in stage at diagnosis. We used a retrospective cohort design and combined 3 years of data from the Illinois State Cancer Registry (ISCR) with information on locations of mammography facilities, public transportation service, crime, and area demographic and economic characteristics. Using a Geographic Information System (GIS), we identified the five facilities located nearest to each case’s residence. Estimates of the association between characteristics of mammography facility locations and breast cancer stage at diagnosis were obtained using the partial proportional odds regression model. We found that the number of homicides in areas in which the nearest mammography facilities were located was associated with increased odds of later stage diagnosis. This effect was independent of age, race, and residential area education and income. We found no effect on stage of distance, public transportation service, or measures of neighborhood social similarity. The “spatial dynamics” of health may involve geographies beyond the immediate neighborhood. The results of our study suggest that areas in which the nearest mammography facilities are located may be one such geography. We hope that this study will spark research interest in the impact of health service locations on utilization.
Keywords: Breast cancer, Stage, Mammography, GIS, Crime, Neighborhoods
Introduction
For women who have breast cancer, stage of disease at diagnosis is a powerful determinant of survival. For example, the most recent data from the United States’ Surveillance, Epidemiology, and End Results (SEER) Program indicate that 5-year relative survival rates among women whose breast cancer is diagnosed while in the localized stage are nearly four times greater than those of women who have distant metastases at the time of diagnosis (98.3 vs. 27.5%).1 The percentage of breast cancers in the U.S. that are diagnosed while still localized has increased over the last 30 years but remains suboptimal at 63% overall and 52% among African American women.1 The excess morbidity and mortality burden associated with later stage diagnosis is substantial.
U.S. public health policy promotes early detection of female breast cancer through periodic mammography.2 Despite substantial investment in this strategy to reduce breast cancer mortality, mammography remains underutilized and recent evidence suggests screening rates have actually declined since 2000.3–5 Reasons for underutilization remain incompletely understood. Studies have principally focused on individual factors such as financial access (i.e., health insurance), having an established relationship with a physician or place of care, and cultural or linguistic hurdles. Recent research has brought attention to the influence of place on health and has increased awareness of the importance of considering contextual factors in studies of individual behavior.6–10 This line of research has rarely been extended to the effects of specific features of the urban environment on preventive service utilization.
Our objective in this exploratory study was to address these gaps in information by investigating whether characteristics of mammography facility locations are associated with stage at diagnosis among Chicago residents with breast cancer. We focused on the spatial accessibility of mammography facilities and on the social environments of neighborhoods in which proximate facilities were located as factors that potentially influenced stage of breast cancer at diagnosis through their association with mammography utilization. Following the example of other investigators, we used stage as a surrogate measure of periodic screening mammography utilization.11–15 Our central hypothesis was that factors such as travel distance and public transportation service, safety of neighborhoods surrounding facilities, and the degree to which those neighborhoods are socially and economically similar to one’s own neighborhood influence likelihood of utilizing the service and, accordingly, stage of cancer at the time of diagnosis. Though not directly tested here, these factors may alter the perceived risk/benefit ratio or desirability of the service and, together with other factors such as insurance status and receiving a physician’s recommendation, influence likelihood of obtaining periodic screening.
Materials and Methods
We used a retrospective cohort design and combined 3 years of data from the Illinois State Cancer Registry (ISCR) with information on locations of mammography facilities, public transportation service, crime, and area demographic and economic characteristics. Estimates of the association between characteristics of mammography facility locations and breast cancer stage at diagnosis were obtained using the partial proportional odds regression model.16–18
Setting and Sample
Non-Hispanic white (NHW), Non-Hispanic African American (NHAA), and Hispanic women age 45 years and older living in Chicago and diagnosed with breast cancer between 1996 and 1998 comprised our study sample. We excluded younger women since, following guidelines for screening mammography (beginning at age 40), they would not yet have been old enough to have established a pattern of “regular” screening mammography use. The ISCR database contained 4,936 cancer cases meeting these gender, age, and time period criteria. After exclusions due to missing information on stage (349 cases) and socioeconomic position variables (54 cases), our analytic sample numbered 4,533.
Data Sources and Measures
Stage at diagnosis
Data obtained from ISCR provided clinical information about the progression of the cancer at the time of diagnosis. The SEER Summary Stage schema summarizes information on the extent to which the cancer has spread into nine categories: in situ, localized, regional (in four subgroups), distant, and unstaged or unknown.19 We collapsed the four regional categories into one and excluded unknown stage. Thus, we modeled a four-level ordered categorical outcome. While many women with mammogram-detected in situ cancer will not go on to develop invasive breast cancer, we chose to include this stage in our outcome measure because of its strong association with screening mammography. Several studies have demonstrated that the incidence of in situ breast cancer has increased markedly since the adoption of screening mammography,6,20,21 and cancers detected through screening are approximately twice as likely to be noninvasive as those reported in the general population.22 Further, community-level mammography rates are positively associated with rates of in situ and local breast cancers.6 Therefore, because stage at diagnosis is being used as a surrogate measure of mammography utilization in this study, it was particularly important to include in situ stage cases in our sample.
Latitude and longitude coordinates as well as census tract for breast cancer cases were obtained from ISCR. According to ISCR documentation for cancer cases in Cook County (in which Chicago is located) for the years 1986 to 2000, these geocodes reflect the home address for 94.2% of cases, centroid of the zip code plus four for 1.9% of cases, centroid of the zip code plus two for 0.3% of cases, and centroid of the five-digit zip code for 3.3% of cases.
Mammography facility locations
The U.S. Food and Drug Administration (FDA) provided us with the addresses of all mammography facilities in Illinois that were FDA-certified in 1997. Using geographic information system (GIS) software, we address-matched facilities in the Chicago area to the U.S. Census Bureau 1995 TIGER/Line Files and identified those that were located in Chicago and within a 10-mile radius of the city border.23,24 These included Indiana as well as suburban facilities. We then calculated the street network distance from the residential address of each cancer case to each mammography facility.24–26 We focused on the nearest five facilities to each case, rather than the nearest one, in order to account for both choice and constraints that exist in mammography facility availability to individuals; the nearest facility may not be the most desirable or accessible due to hours of operation, insurance requirements, location in relation to work, or other factors.
Spatial accessibility of mammography facilities
Two measures evaluated the spatial accessibility of mammography facilities to each case: mean distance to the nearest five facilities (described above) and public transportation service in the facility neighborhoods. We obtained geographically referenced information on the locations of Chicago area bus and train lines from the Regional Transportation Authority (personal communication, A. Flintoff, April 1, 2004). Because the acquired data files were from 2004 and files for the study period were not available, we modified the files based on historical data on public transit development in metropolitan Chicago.27,28 We found few changes, affecting less than 8% of the total bus lines and less than 3% of elevated and subway train stops.
We then used GIS to identify the lines (train and bus) and stops (train) within a 0.25-mile radius of each facility, which is commonly considered walking distance.29 We measured transportation accessibility by counting the number of local and regional train lines and stops and the number of city or suburban bus lines. For each measure, we took the mean of the value across the nearest five facilities.
Facility neighborhood safety
We used annual violent crime incidents to measure facility neighborhood safety. Crime data were aggregated from police incident reports for city locations and obtained from the Uniform Crime Reporting Systems of Illinois and Indiana for suburban and Indiana locations.30–33 We focused on homicide, robbery, aggravated assault, and sexual assault, as these were crimes for which there were data for both Chicago and non-Chicago locations. For each crime type and in alternate regression models, the number of incidents that occurred within a 0.5-mile radius of each facility quantified facility-area safety.
For non-Chicago locations, we had only the number of crimes reported in the town or village, rather than point locations. We estimated the number of crimes that occurred within a 0.5-mile radius of each suburban and Indiana facility using the proportion of the municipality’s population residing in the census tract in which the facility was located. To estimate the level of crime activity in the period of time during which each case would have been deciding whether to utilize a particular mammography service, we averaged the number of crimes reported around each facility in the year before and year of her diagnosis. We then took the mean of the number across the nearest five facilities to each cancer case.
Facility neighborhood social similarity
Hypothesizing that women would be more comfortable seeking services in neighborhoods socially similar to their own, we derived measures of facility neighborhood similarity using demographic and economic data from the 2000 US Census.34 For these measures, census tracts were used as proxies for facility and case neighborhoods. We assigned each facility and each case to a category in each of three measures: proportion NHAA only population, proportion Hispanic population, and per capita income. We then constructed variables indicating the number of the nearest five facilities that were in the same category as the case. For race/ethnicity, the categories were less than 20%, 21–50%, 51–80%, and 81–100%. For per capita income, we calculated quartiles of the distribution among all Chicago census tracts in 2000.
Covariates
To account for characteristics of cases that are known to affect stage at diagnosis and might be correlated with facility neighborhood characteristics (thus “confounding” the estimates of facility neighborhood effects on stage), we included several control variables in our regression models. These included the case’s age, race/ethnicity, estimates of socioeconomic position and, in some models, the racial/ethnic, economic, and crime characteristics of case neighborhoods.
To estimate case socioeconomic position, we used census-based estimates of poverty and educational attainment within specific subpopulations at the census tract level. Data came from the U.S. Census 2000 Summary File 3.34 For each case, we assigned the poverty rate among women in her race-and-age group who were residing in her (residential) census tract. We used three age groups: 45-to-64, 65-to-74, and 75-and-older. For example, a 67-year-old Hispanic woman would be assigned the poverty rate among Hispanic women aged 65-to-74 in her census tract. The poverty rate measure can range from 0 to 1 and amounts to an estimate of the likelihood that the individual’s family income was below the federal poverty level.
For educational attainment, we used the percent with a high-school diploma or more education and assigned to each case that percent among women in her race/ethnic group. The education measure was not available at the level of gender–race–age group. Therefore, the 67-year-old Hispanic woman and a 45-year-old Hispanic woman living in the same census tract would both be assigned the high school diploma rate among Hispanic women in that tract. Thus, these measures are specific not to an area but to a specific subpopulation within an area. Because of substantial within-tract gender, race, and age-based heterogeneity in socioeconomic characteristics in Chicago, this use of group-specific estimates, rather than overall census tract values, reduces error in the measures when used to proxy individual socioeconomic position.
Analysis
We estimated associations between facility neighborhood characteristics and stage of breast cancer at diagnosis using the partial proportional odds (PPO) model. This model is derived from the generalized ordered logit model which allows relaxation of the parallel lines assumption of ordered logistic regression.18 In the ordered logit, we would model the probability that breast cancer stage at diagnosis for case i is greater than stage m. That is,
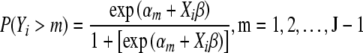 |
where
- m
the category of the ordinal dependent variable (in situ, local, regional or distant stage)
- J
the number of categories (4).
This is equivalent to a series of binomial logistic regressions where categories of the dependent variable are combined. For m=1, in situ is contrasted with local, regional, and distant, combined. For m=2, in situ and local, together, are contrasted with regional and distant, and for m=3, in situ, local and regional, together, are contrasted with distant. A positive (β) coefficient in any of these regressions indicates that higher values on that variable increase the propensity of case i’s cancer to be at a later (less favorable) stage at the time of diagnosis.18 A negative (β) coefficient indicates that higher values on that variable increase the propensity of case i’s cancer to be at the current or earlier stage at the time of diagnosis. For example, when m=2, a negative coefficient estimate for age would indicate that increasing age raises the odds of diagnosis at the local or in situ stage.
Note that the βs shown in this equation are assumed to be the same across all comparisons, i.e., we are making the standard proportional odds assumption.35 This assumption can be tested36 and our analysis showed that one variable, age, violated the assumption. Thus, our model allows the coefficient for age to vary across levels of the outcome.
We fitted separate models to estimate the association of facility neighborhood accessibility, safety, and social and economic characteristics with stage. Through the addition of multiplicative interaction terms to the models, we also tested for interaction effects between age or race and facility area characteristics. In all models, we controlled for individual economic resources and educational attainment, using the estimates described above. Because age and race/ethnicity are correlated both with stage at diagnosis and with some of the facility area measures, we also included a race–age interaction term in all models to control for their combined effects on the outcome and avoid “confounding” of the facility measures. All analyses were conducted using Stata® version 10. Partial proportional odds models were estimated using the Gologit2 module.18 Robust (sandwich) SE were estimated and accommodated non-independence within census tracts using Stata’s cluster option.35
Results
Characteristics of breast cancer cases and their nearby mammography facilities are presented in Table 1. In 34% of the sample, the cancer had progressed beyond the local stage by the time of diagnosis. Mean street network distance from home to the nearest five mammography facilities was 2.1 miles. The facility neighborhoods were serviced by a mean of five bus, train, or subway lines but the range was quite broad, 1 to 35. Facility neighborhood crime rates also varied substantially, from 8 to 577 per year in all four categories combined.
Table 1.
Characteristics of cancer cases and their nearby mammography facility neighborhoods
| CANCER CASES | n (%) |
|---|---|
| 4533 (100) | |
| Stage | |
| In Situ | 685 (15) |
| Local | 2297 (51) |
| Regional | 1228 (27) |
| Distant | 323 (7) |
| Race/ethnicity* | |
| Non-Hispanic White | 2445 (54) |
| Non-Hispanic AA | 1787 (39) |
| Hispanic | 301 (7) |
| Age* | Mean (SD) 65.4 (12.1) |
| Social position | |
| Poverty ratea* | Mean (SD) 0.15 (0.15) |
| HS graduation rateb* | Mean (SD) 0.77 (0.15) |
| MAMMOGRAPHY FACILITIESc | |
| Distance (miles) | 2.1 (0.8) |
| Public Transit | |
| Number of Lines* | 5.2 (5.3) |
| Number of Stops | 15.4 (7.2) |
| Crime (count) | |
| Homicide* | 2.2 (1.6) |
| Robbery | 104.6 (59.9) |
| Aggravated assault* | 113.7 (66.3) |
| Sexual assault* | 10.1 (6.0) |
| Racial/ethnic Composition (percentage) | |
| NHAA* | 0.33 (0.31) |
| Hispanic* | 0.16 (0.15) |
| Economic resources | |
| Per capita income* (dollars) | 9115 (6864) |
aPoverty rate is gender-race-age group-specific within census tract
bHigh school diploma rate is gender-race/ethnic group-specific within census tract
cAll values are means across the nearest 5 facilities
*Stage differences, p<.05
Bivariate relationships between stage and each variable were tested using generalized ordered logit models. There were statistically significant differences in propensity toward later stage for race/ethnicity, age, case-neighborhood poverty, and high school diploma rates, and for facility-neighborhood transportation lines, crime (except robbery), racial/ethnic composition, and per capita income.
Table 2 presents results of a model that contains case demographic variables only. For ease of discussion, we call this the base model. Age, income, and education are centered on their overall means. The top panel (in situ stage) shows estimates of the effects of each variable when the probability being modeled is diagnosis at any of the later stages (local, regional, or distant). The middle panel shows estimates of the effects of each variable when the probability being modeled is regional or distant stage diagnosis, and the bottom panel shows results when the probability modeled is distant stage diagnosis. Only the coefficient values for the main effect of age differ across the three panels since this was the only variable that did not meet the parallel lines assumption.
Table 2.
Maximum likelihood estimates of associations between breast cancer case demographic characteristics and stage of breast cancer at diagnosis: base model
| Stage | Variable | Β | SE |
|---|---|---|---|
| In Situ | Non-Hispanic AA | 0.061 | 0.068 |
| Hispanic | −0.445 | 0.139*** | |
| Age (centered) | 0.025 | 0.004*** | |
| Age × NHAA | −0.013 | 0.005** | |
| Age × Hispanic | −0.019 | 0.009** | |
| Poverty | 0.637 | 0.224*** | |
| Education | −1.293 | 0.256*** | |
| Local | Non-Hispanic AA | 0.061 | 0.068 |
| Hispanic | −0.445 | 0.139*** | |
| Age (centered) | −0.004 | 0.003 | |
| Age × NHAA | −0.013 | 0.005** | |
| Age × Hispanic | −0.019 | 0.009** | |
| Poverty | 0.637 | 0.224*** | |
| Education | −1.293 | 0.256*** | |
| Regional | Non-Hispanic AA | 0.061 | 0.068 |
| Hispanic | −0.445 | 0.139*** | |
| Age (centered) | 0.015 | 0.005*** | |
| Age × NHAA | −0.013 | 0.005** | |
| Age × Hispanic | −0.019 | 0.009** | |
| Poverty | 0.637 | 0.224*** | |
| Education | −1.293 | 0.256*** |
**0.01≤p<0.05
***p<0.01
Results for the base model show that increasing age, fewer economic resources (i.e., higher poverty rate), and lower education are associated with greater propensity toward later stage diagnosis. In contrast, Hispanic ethnicity is associated with reduced propensity toward later stage diagnosis and the magnitude of this negative effect increases with age. While African American (NHAA) race has no statistically significant association with stage in this model, it should be noted that use of the centered age variable and the age interaction term means that the coefficient for NHAA refers to its effect when age is equal to 65. In a model in which age is not centered, the coefficient estimate for this variable is positive and statistically significant (not shown), indicating that the association between NHAA and stage is limited to younger ages. This finding is consistent with the results for the age–race/ethnicity interaction terms; the effect of age on later stage diagnosis depends on race/ethnicity. Age has a smaller positive association with stage among NHAA and Hispanic women than it does among NHW women. Finally, Table 2 shows that among NHW women, increasing age is associated principally with decreased likelihood of in situ stage diagnosis. This pattern of regression results for the main effect of age is almost identical across models. Therefore, in the interest of brevity, we present only the top panel in the remaining tables.
Table 3 shows results for the spatial accessibility measures. Mean distance between residence and nearest five facilities has no effect on stage (model 1). For the public transportation service measures, the mean number of bus and train lines (model 2) was not associated with stage. We found the same results when we fitted models that examined the number of bus lines and train lines separately and when we used train stops rather than lines (not shown).
Table 3.
Maximum likelihood estimates of associations between mammography facility neighborhood characteristics and stage of breast cancer at diagnosis: spatial accessibility measures
| Stage | Variable | Model 1 | Model 2 | ||
|---|---|---|---|---|---|
| β | SE | β | SE | ||
| In situ | Non-Hispanic AA | 0.067 | 0.072 | 0.058 | 0.068 |
| Hispanic | −0.448 | 0.138*** | −0.424 | 0.139*** | |
| Age (centered) | 0.025 | 0.004*** | 0.025 | 0.004*** | |
| Age × NHAA | −0.013 | 0.005** | −0.013 | 0.005** | |
| Age × Hispanic | −0.019 | 0.009** | −0.019 | 0.009** | |
| Poverty | 0.611 | 0.236** | 0.681 | 0.225*** | |
| Education | −1.318 | 0.255*** | −1.154 | 0.258*** | |
| Distance | −0.018 | 0.049 | |||
| Transport Lines (no.) | −0.010 | 0.007 | |||
**0.01≤p<0.05
***p<0.01
Table 4 shows results for the crime measures. The coefficient estimates for all of the crime categories are positive, but most are small and not statistically significant. The exception is facility–neighborhood homicide; its effect is much larger than the other crimes and is statistically significant. Exponentiation of the homicide coefficient reveals an odds ratio of 1.05 (95% CI, 1.00–1.11), suggesting that each additional homicide increases the odds of diagnosis at a later stage by a factor of 1.05, holding all else constant.
Table 4.
Maximum likelihood estimates of associations between mammography facility neighborhood characteristics and stage of breast cancer at diagnosis: crime measures
| Stage | Variable | Model 1 | Model 2 | Model 3 | Model 4 | ||||
|---|---|---|---|---|---|---|---|---|---|
| β | SE | β | SE | β | SE | β | SE | ||
| In situ | Non-Hispanic AA | 0.039 | 0.076 | −0.002 | 0.081 | −0.002 | 0.080 | −0.032 | 0.083 |
| Hispanic | −0.467 | 0.141*** | −0.484 | 0.140*** | −0.487 | 0.140*** | −0.478 | 0.139*** | |
| Age (centered) | 0.025 | 0.004*** | 0.025 | 0.004*** | 0.026 | 0.004*** | 0.025 | 0.004*** | |
| Age × NHAA | −0.013 | 0.005** | −0.014 | 0.005** | −0.014 | 0.005** | −0.014 | 0.005** | |
| Age × Hispanic | −0.019 | 0.009** | −0.019 | 0.009** | −0.019 | 0.009** | −0.019 | 0.009** | |
| Poverty | 0.592 | 0.236** | 0.568 | 0.232** | 0.532 | 0.236** | 0.599 | 0.226** | |
| Education | −1.335 | 0.257*** | −1.303 | 0.257*** | −1.362 | 0.259*** | −1.216 | 0.256*** | |
| Robbery | 0.000 | 0.001 | |||||||
| Aggravated Assault | 0.001 | 0.001 | |||||||
| Sexual Assault | 0.010 | 0.006 | |||||||
| Homicide | 0.052 | 0.025** | |||||||
**0.01≤p<0.05
***p<0.01
Results for the social similarity measures are shown in Table 5. Only the effect of similarity in neighborhood proportion Hispanic is statistically significant. The direction of the association is negative, indicating a reduced propensity toward later stage diagnosis. Proximity to an additional facility in a neighborhood with a similar proportion Hispanic population is associated with a 5% reduction in the odds of later stage disease. There were no statistically significant interactions between age or race and measures of facility-area spatial accessibility, crime, or social similarity.
Table 5.
Maximum likelihood estimates of associations between mammography facility neighborhood characteristics and stage of breast cancer at diagnosis: social similarity measures
| Stage | Variable | Model 1 | Model 2 | Model 3 | |||
|---|---|---|---|---|---|---|---|
| β | SE | β | SE | β | SE | ||
| In Situ | Non-Hispanic AA | 0.046 | 0.070 | 0.136 | 0.081* | 0.063 | 0.068 |
| Hispanic | −0.444 | 0.139*** | −0.424 | 0.139*** | −0.450 | 0.139*** | |
| Age (centered) | 0.025 | 0.004*** | 0.025 | 0.004*** | 0.025 | 0.004*** | |
| Age × NHAA | −0.013 | 0.005** | −0.013 | 0.005** | −0.013 | 0.005** | |
| Age × Hispanic | −0.019 | 0.009** | −0.018 | 0.010* | −0.019 | 0.009** | |
| Poverty | 0.596 | 0.228*** | 0.638 | 0.225*** | 0.600 | 0.227*** | |
| Education | −1.276 | 0.256*** | −1.043 | 0.284*** | −1.301 | 0.256*** | |
| Similarity in race/ethnicity | |||||||
| African American | 0.036 | 0.026 | |||||
| Hispanic | −0.047 | 0.023** | |||||
| Similarity in income | −0.030 | 0.031 | |||||
0.05≤p<0.10
**0.01≤p<0.05
***p<0.01
Discussion
Our objective in this exploratory study was to investigate whether stage of breast cancer at diagnosis among Chicago residents is associated with characteristics of the neighborhoods in which proximate mammography facilities are located. Those characteristics may influence likelihood of utilizing the service routinely and partly explain differences in stage at diagnosis. We investigated measures of spatial access and aspects of the social environment, specifically crime and social similarity. In general, we found few associations and none that were consistent across measures within the same construct. However, we found a few intriguing results that we think deserve further investigation.
We found that the homicide rate in nearby facility neighborhoods was positively associated with later stage diagnosis. Previous research on crime and health has found crime to be positively related to a variety of health outcomes including self-assessed health,37–39 physical functioning,39 coronary heart disease,40 adherence to inhaled glucocorticoids,41 health-related quality of life,42 and adverse birth events.43 Though of growing interest, prior research is inconsistent regarding the association between crime or perceptions of crime and the likelihood of engaging in physical activity.44–48 The observed relationship between homicide and cancer stage is consistent with our supposition that crime surrounding mammography facilities is a deterrent to mammography utilization. We were unable to directly test this hypothesis, however, and other explanations are possible. For example, living in or near a high-crime area may increase stress. Ongoing research has begun to elucidate biochemical mechanisms underlying an association between stress and cancer progression.49–51
Contrary to our findings on homicide, we found no relationship between stage at diagnosis and the number of robberies, aggravated assaults, or sexual assaults. There are several potential explanations, methodological and theoretical, for these seemingly contradictory results. A methodological explanation is that imprecision in the measurement of those crimes may have reduced the power of the model to detect an effect of those variables.52 Homicide is virtually always reported, while robberies and assaults often go unreported. This is particularly true with regard to sexual assault, which often goes unreported due to the stigma attached to it, and aggravated assault, a substantial proportion of which occurs between domestic partners. While this measurement error in our crime data may have biased our coefficients either toward or away from the null, it will have resulted in reduced power.52,53
It is also possible that women have a greater perceived vulnerability to homicide than to the other crimes studied. Fear of and perceived vulnerability to crime is the assumed mechanism through which crime becomes a deterrent to mammography utilization. Area homicide may generate perceptions of vulnerability while robbery and assault do not because women are more aware of homicide than they are of other crimes in their own and surrounding neighborhoods. Homicide, much more so than other types of crime, tends to be reported in the media. Further, fear of and perceived vulnerability to crime has been found to be influenced by media coverage of crime.54–60 Thus, media coverage of homicide but less often robbery and assault may result in a greater awareness of and perceived vulnerability to area homicide compared to those other crimes and partly explain our finding that only homicide was associated with later stage at diagnosis. Unfortunately, we are unable to test these ideas with our data.
Interestingly, we found that the effect of facility-area homicide on stage depended on the number of homicides in the 0.5-mile area surrounding the case’s residence (not shown). The association of case-area homicide with stage was positive and twice as large as the facility-area effect. Further, the (positive) facility-area homicide effect on stage was diminished in the presence of case-area homicide. This finding suggests that homicide in a nearby facility area may be less of a deterrent to visiting that facility among women who have experienced homicide in their own neighborhood. This pattern is also intuitively consistent with a stress effect; we would expect that environmental stress-producing factors would have a greater effect the closer they are to home and that stress-producing factors in neighboring areas may have little added effect in the presence of home-neighborhood stress.
To test the sensitivity of our results to variations in the specification of nearby facilities, we recalculated all facility-area characteristics using the nearest three rather than nearest five facilities. We found substantively equivalent results in most models. The effect of homicide in the nearest three facility areas was reduced by 30%, however (β=0.036, p=0.08; OR=1.04, CI95 1.00–1.08). It is not clear to us why the mean number of facility-area homicides was more powerfully associated with stage when the nearest five rather than nearest three facilities were considered. In relation to the case’s home, the nearest five facilities generally encompass a larger area than do the nearest three facilities. It may be that compared to a smaller area that can be traversed more easily, a larger area of violence is a greater deterrent to mammography use or has other deleterious effects that impact stage at diagnosis.
Our finding that distance from home to nearby mammography facilities was not associated with stage at diagnosis diverges from the results of most but not all studies of the effects of geographic barriers on health care utilization.61–71 Several studies have found that women who lived farther away from facilities were less likely to undergo mammography than those who lived closer to facilities.72–76 Contrary to those results, a study of the relationship between distance or travel time and adherence to screening mammography recommendations in rural Michigan failed to find an association.77 Expected generalizability of the results of this body of work to women living in large urban areas in the U.S. may be limited. Just two of the studies mentioned were conducted in the United States, both in rural areas.73,77 The remainder were conducted elsewhere in populations with universal health coverage or in environments where mammography was offered free of charge and, with one exception, in mixed rural–urban regions. Intraurban variation in the spatial accessibility of mammography and other health care services and its effect on residents’ utilization is not well understood.78,79 It may be that in the urban environment where distances are relatively short, most areas are accessible by public transportation and, often, the cost of public transit travel does not vary by distance, social environmental factors such as crime, and individual factors such as education and income are more important determinants of preventive services utilization.
Since we had no direct measure of mammography utilization in our study, we postulated that error in our surrogate measure (stage) could be responsible for the failure to find a distance effect. To explore this possibility, we fitted a logistic regression model in which the dichotomous outcome was diagnosis at the in situ versus all other stages. Since diagnosis of breast cancers at the in situ stage is largely attributable to screening mammography, we felt confident that these women had, in fact, undergone the exam. We found that distance to nearby facilities had no statistically significant association with early stage diagnosis (not shown).
Limitations of our study include lack of information on mammography utilization (both frequency and place of service) and on health insurance and other known determinants of utilization such as a regular source of care, receipt of a physician’s recommendation, and car ownership. Our analysis is based on the assumption that women would frequent facilities close to home but women may also select facilities based on proximity to their workplace or other locations where they regularly spend time or travel (e.g., shopping center, church). Our study would also have benefited from information about additional aspects of mammography facilities that might influence willingness to travel to them such as hours of operation, capacity, and the provision of culturally and linguistically appropriate services. Stage is an imperfect measure of mammography utilization. Although most in situ breast cancers are detected through screening mammography, and women who undergo yearly mammography and develop breast cancer are unlikely to be diagnosed with a late stage cancer, there are other determinants of stage at diagnosis, including tumor aggressiveness and time delay between screening and diagnosis. While the census-based measures of case socioeconomic position that we employed were the best available to us, they limit our ability to make definitive statements about the role of the individual’s income or education in influencing stage at diagnosis in this cohort of breast cancer cases. Finally, we had limited ability, due to collinearity among variables, to isolate the effects of facility area characteristics from those of case neighborhoods.
These limitations notwithstanding, ours is the first study of which we are aware to investigate associations between characteristics of the areas in which health care services are located and a health outcome among residents of nearby areas. Mammography facilities and stage of breast cancer at diagnosis is a particularly useful service–outcome pair for study since the outcome is directly related to utilization of the service. Strengths of our study include the use of residential street addresses to calculate distance from home to mammography facilities and use of data from multiple sources that, linked to the records of individuals, allowed us to characterize multiple aspects of the neighborhoods in which facilities likely to be utilized by those individuals are located.
This topic deserves further study. Improvements in breast cancer stage at diagnosis and survival depend to a substantial degree on greater screening mammography utilization. Explanations for why some women adhere to mammography screening recommendations and others do not is incomplete, yet there has been little attention paid to characteristics of the facilities themselves, such as location, that may affect use. Studies providing insight into factors affecting perceived threats to personal safety and the effects of those perceptions on willingness to utilize preventive care services would advance this line of research. Further research is also needed to better disentangle the effects of facility areas from those of residential areas when the two are spatially proximate to one another. There is a growing body of research on the effects of urban neighborhood characteristics on health where the focus is on the residential environment. The “spatial dynamics” of health,80 however, may involve geographies beyond the immediate neighborhood. The results of our study suggest that areas in which the nearest mammography facilities are located may be one such geography. We hope that this study will spark research interest in the impact of health service locations on utilization.
Acknowledgements
We thank Anna Flintoff at the Regional Transportation Authority for providing the public transportation GIS files. The Chicago crime data was collected with the cooperation of the Chicago Police Department for the evaluation of the Chicago Alternative Policing Strategy (CAPS). This research was supported by: The Health Services Research and Development Service Postdoctoral Fellowship Program of the Veterans Health Administration (ET); National Cancer Institute Cancer Education and Career Development Program no. 5 R25T CA57699-12 (SNZ), and the National Cancer Institute (5P50CA106743-02).
References
- 1.National Cancer Institute. Surveillance, Epidemiology, and End Results (SEER) Program SEER*Stat Database [database online]. Released April 2005, based on the November 2004 submission. National Cancer Institute, DCCPS, Surveillance Research Program, Cancer Statistics Branch; 2005. Available: http://www.seer.cancer.gov. Accessed November 20, 2007.
- 2.U.S. Department of Health and Human Services. Healthy People 2010, 2nd ed. With Understanding and Improving Health and Objectives for Improving Health. 2 vols. U.S. Government Printing Office; 2000 Nov. Available at: http://www.healthypeople.gov/Document/tableofcontents.htm#volume1. Accessed November 20, 2007.
- 3.Breen N, Cronin A, Meissner HI, et al. Reported drop in mammography: is this cause for concern? Cancer J. 2007;109(12):2405–2409. doi:10.1002/cncr.22723. [DOI] [PubMed]
- 4.Centers for Disease Control and Prevention. Use of mammograms among women aged ≥40 years—United States, 2000–2005. MMWR. 2007;56(3):49–51. [PubMed]
- 5.Chagpar AB, McMasters KM. Trends in mammography and clinical breast examination: a population-based study. J Surg Res. 2007;140(2):214–219. doi:10.1016/j.jss.2007.01.034. [DOI] [PubMed]
- 6.Davidson PL, Bastani R, Nakazono TT, Carreon DC. Role of community risk factors and resources on breast carcinoma stage at diagnosis. Cancer J. 2005;103(5):922–930. doi:10.1002/cncr.20852. [DOI] [PubMed]
- 7.Li F, Fisher KJ, Bauman A, et al. Neighborhood influences on physical activity in middle-aged and older adults: a multilevel perspective. J Aging Phys Act. 2005;13(1):87–114. [DOI] [PubMed]
- 8.Nelson MC, Gordon-Larsen P, Song Y, Popkin BM. Built and social environments associations with adolescent overweight and activity. Am J Prev Med. 2006;31(2):109–117. doi:10.1016/j.amepre.2006.03.026. [DOI] [PubMed]
- 9.Stimpson JP, Ju H, Raji MA, Eschbach K. Neighborhood deprivation and health risk behaviors in NHANES III. Am J Health Behav. 2007;31(2):215–222. [DOI] [PubMed]
- 10.Virtanen M, Kivimaki M, Kouvonen A, et al. Average household income, crime, and smoking behaviour in a local area: the Finnish 10-Town study. Soc Sci Med. 2007;64(9):1904–1913. doi:10.1016/j.socscimed.2007.01.005. [DOI] [PubMed]
- 11.Das B, Feuer EJ, Mariotto A. Geographic association between mammography use and mortality reduction in the US. Cancer Causes Control. 2005;16(6):691–699. doi:10.1007/s10552-005-1991-x. [DOI] [PubMed]
- 12.Day NE, Williams DR, Khaw KT. Breast cancer screening programmes: the development of a monitoring and evaluation system. Br J Cancer. 1989;59(6):954–958. [DOI] [PMC free article] [PubMed]
- 13.Randolph WM, Goodwin JS, Mahnken JD, Freeman JL. Regular mammography use is associated with elimination of age-related disparities in size and stage of breast cancer at diagnosis. Ann Intern Med. 2002;137(10):783–790. [DOI] [PubMed]
- 14.Rushton G, Peleg I, Banerjee A, Smith G, West M. Analyzing geographic patterns of disease incidence: rates of late-stage colorectal cancer in Iowa. J Med Syst. 2004;28(3):223–236. doi:10.1023/B:JOMS.0000032841.39701.36. [DOI] [PubMed]
- 15.Sheehan TJ, DeChello LM. A space-time analysis of the proportion of late stage breast cancer in Massachusetts, 1988 to 1997. Int J Health Geogr. 2005;4:15. doi:10.1186/1476-072X-4-15. [DOI] [PMC free article] [PubMed]
- 16.Ananth CV, Kleinbaum DG. Regression models for ordinal responses: a review of methods and applications. Int J Epidemiol. 1997;26(6):1323–1333. doi:10.1093/ije/26.6.1323. [DOI] [PubMed]
- 17.Peterson B, Harrell FE. Partial proportional odds models for ordinal response variables. Appl Stat. 1990;39(2):205–217. doi:10.2307/2347760. [DOI]
- 18.Williams R. Generalized ordered logit-partial proportional odds models for ordinal dependent variables. Stata J. 2006;6(1):58–82.
- 19.Young JL Jr, Roffers SD, Ries LAG, Fritz AG, Hurlbut AA. SEER Summary Staging Manual—2000: Codes and Coding Instructions. Bethesda, MD: National Cancer Institute; 2001 Available at: http://seer.cancer.gov/tools/ssm/.
- 20.Barchielli A, Federico M, De LV, et al. In situ breast cancer: incidence trend and organised screening programmes in Italy. Eur J Cancer. 2005;41(7):1045–1050. doi:10.1016/j.ejca.2004.12.032. [DOI] [PubMed]
- 21.Simon MS, Lemanne D, Schwartz AG, Martino S, Swanson GM. Recent trends in the incidence of in situ and invasive breast cancer in the Detroit metropolitan area (1975–1988). Cancer J. 1993;71(3):769–774 doi:10.1002/1097-0142(19930201)71:3<769::AID-CNCR2820710320>3.0.CO;2-4. [DOI] [PubMed]
- 22.Clayforth C, Fritschi L, McEvoy S, et al. Assessing the effectiveness of a mammography screening service. ANZ J Surg. 2005;75(8):631–636. doi:10.1111/j.1445-2197.2005.03476.x. [DOI] [PubMed]
- 23.ArcView 3.3 [computer program]. Redlands, CA: Environmental Systems Research Institute; 1999–2002.
- 24.U.S. Census Bureau. 1995 TIGER/Line® Files [database online]. U.S. Census Bureau; 1996. Available: http://www.census.gov/geo/www/tiger/.
- 25.ArcGIS Network Analyst 9.0 [computer program]. Redlands, CA: Environmental Systems Research Institute; 2005.
- 26.ArcGIS Desktop 8.3 [computer program]. Redlands, CA: Environmental Systems Research Institute; 1999–2002.
- 27.Chicago Surface Routes History [website online]. Available at: http://hometown.aol.com/ctapacefan/ctabdate.html. Accessed May 7, 2007.
- 28.“L” System History [website online]. Available at: http://www.chicago-l.org/history/index.html. Accessed May 7, 2007.
- 29.Krizek KJ. Operationalizing neighborhood accessibility for land use-travel behavior research and regional modeling. J Plann Educ Res. 2003;22:270–287. doi:10.1177/0739456X02250315. [DOI]
- 30.Illinois Uniform Crime Reporting Program. Crime in Illinois 1998 (Section II—Crime Index Offense/Crime Rate Data). Available at: http://www.isp.state.il.us/crime/ucrhome.cfm. Accessed June 15, 2006.
- 31.Illinois Uniform Crime Reporting Program. Crime in Illinois 1997 (Section II - Crime Index Offense/Crime Rate Data). Available at: http://www.isp.state.il.us/crime/ucrhome.cfm. Accessed June 15, 2006.
- 32.U.S. Department of Justice. Crime and Justice Data Online (Indiana, 1995–1998) [database online]. Available: http://bjsdata.ojp.usdoj.gov/dataonline/. Accessed April 26, 2006.
- 33.National Archive of Criminal Justice Data. Uniform Crime Reporting Program Resource Guide [website online]. Available at: http://www.icpsr.umich.edu/NACJD/ucr.html. Accessed May 7, 2007.
- 34.U.S. Census Bureau. Census 2000 Summary File 3 (SF 3)—Sample Data [database online]. Washington, DC: US Census Bureau; 2005. Available: http://factfinder.census.gov/home/saff/main.html?_lang=en. Accessed March 29, 2006.
- 35.Long JS, Freese J. Regression Models for Categorical Dependent Variables using Stata. 2nd ed. Stata Press; 2006.
- 36.Brant R. Assessing proportionality in the proportional odds model for ordinal logistic regression. Biometrics. 1990;46:1171–1178. doi:10.2307/2532457. [DOI] [PubMed]
- 37.Chandola T. The fear of crime and area differences in health. Health Place. 2001;7(2):105–116. doi:10.1016/S1353-8292(01)00002-8. [DOI] [PubMed]
- 38.Hill TD, Ross CE, Angel RJ. Neighborhood disorder, psychophysiological distress, and health. J Health Soc Behav. 2005;46(2):170–186. [DOI] [PubMed]
- 39.Ross CE, Mirowsky J. Neighborhood disadvantage, disorder, and health. J Health Soc Behav. 2001;42(3):258–276. doi:10.2307/3090214. [DOI] [PubMed]
- 40.Sundquist K, Theobald H, Yang M, Li X, Johansson SE, Sundquist J. Neighborhood violent crime and unemployment increase the risk of coronary heart disease: a multilevel study in an urban setting. Soc Sci Med. 2006;62(8):2061–2071. doi:10.1016/j.socscimed.2005.08.051. [DOI] [PubMed]
- 41.Williams LK, Joseph CL, Peterson EL, et al. Race-ethnicity, crime, and other factors associated with adherence to inhaled corticosteroids. J Allergy Clin Immunol. 2007;119(1):168–175. doi:10.1016/j.jaci.2006.09.029. [DOI] [PubMed]
- 42.Green G, Gilbertson JM, Grimsley MF. Fear of crime and health in residential tower blocks. A case study in Liverpool, UK. Eur J Public Health. 2002;12(1):10–15. doi:10.1093/eurpub/12.1.10. [DOI] [PubMed]
- 43.Messer LC, Kaufman JS, Dole N, Savitz DA, Laraia BA. Neighborhood crime, deprivation, and preterm birth. Ann Epidemiol. 2006;16(6):455–462. doi:10.1016/j.annepidem.2005.08.006. [DOI] [PubMed]
- 44.Evenson KR, Scott MM, Cohen DA, Voorhees CC. Girls’ perception of neighborhood factors on physical activity, sedentary behavior, and BMI. Obesity (Silver Spring). 2007;15(2):430–445. doi:10.1038/oby.2007.502. [DOI] [PubMed]
- 45.Ferreira I, van der HK, Wendel-Vos W, Kremers S, van Lenthe FJ, Brug J. Environmental correlates of physical activity in youth—a review and update. Obes Rev. 2007;8(2):129–154. doi:10.1111/j.1467-789X.2006.00264.x. [DOI] [PubMed]
- 46.Harrison RA, Gemmell I, Heller RF. The population effect of crime and neighbourhood on physical activity: an analysis of 15,461 adults. J Epidemiol Community Health. 2007;61(1):34–39. doi:10.1136/jech.2006.048389. [DOI] [PMC free article] [PubMed]
- 47.Huston SL, Evenson KR, Bors P, Gizlice Z. Neighborhood environment, access to places for activity, and leisure-time physical activity in a diverse North Carolina population. Am J Health Promot. 2003;18(1):58–69. [DOI] [PubMed]
- 48.Jago R, Baranowski T, Baranowski JC. Observed, GIS, and self-reported environmental features and adolescent physical activity. Am J Health Promot. 2006;20(6):422–428. [DOI] [PubMed]
- 49.Furumoto-Dawson A, Gehlert S, Sohmer D, Olopade O, Sacks T. Early-life conditions and mechanisms of population health vulnerabilities. Health Aff (Millwood). 2007;26(5):1238–1248. doi:10.1377/hlthaff.26.5.1238. [DOI] [PMC free article] [PubMed]
- 50.Gehlert S, Sohmer D, Sacks T, Mininger C, McClintock M, Olopade O. Targeting health disparities: a model linking upstream determinants to downstream interventions. Health Aff (Millwood). 2008;27(2):339–349. doi:10.1377/hlthaff.27.2.339. [DOI] [PMC free article] [PubMed]
- 51.Ross K. Mapping pathways from stress to cancer progression. J Natl Cancer Inst. 2008;100(13):914–917. doi:10.1093/jnci/djn229. [DOI] [PubMed]
- 52.Armstrong BG. Effect of measurement error on epidemiological studies of environmental and occupational exposures. Occup Environ Med. 1998;55:651–656. [DOI] [PMC free article] [PubMed]
- 53.Fosgate G. Non-differential measurement error does not always bias diagnostic likelihood ratios towards the null. Emerg Themes Eidemiol. 2006;3:7. doi:10.1186/1742-7622–3-7. [DOI] [PMC free article] [PubMed]
- 54.Baker MH, Nienstedt BC, Everett RS, McCleary R. The impact of a crime wave: perceptions, fear, and confidence in the police. Law Soc Rev. 1983;17:319–335. doi:10.2307/3053350. [DOI]
- 55.Chiricos T, Eschholz S, Gertz M. Crime, news, and fear of crime: toward an identification of audience effects. Soc Probl. 1997;44:342–357. doi:10.1525/sp.1997.44.3.03x0119o. [DOI]
- 56.Heath L, Petraitis J. Television viewing and fear of crime: where is the mean world? Basic Appl Soc Psych. 1987;8:97–123. doi:10.1207/s15324834basp0801&2_7. [DOI]
- 57.Heath L, Kavanaugh J, Thompson SR. Perceived vulnerability and fear of crime: why fear stays high when crime rates drop. J Offender Rehabil. 2001;33:1–14. doi:10.1300/J076v33n02_01. [DOI]
- 58.Liska AE, Baccaglini W. Feeling safe by comparison: crime in the newspapers. Soc Probl. 1990;37:360–374. doi:10.1525/sp.1990.37.3.03a00060. [DOI]
- 59.Warr M. The accuracy of public beliefs about crime. Criminology. 1982;20:185–204. doi:10.1111/j.1745-9125.1982.tb00456.x. [DOI]
- 60.Williams P, Dickinson J. Fear of crime: read all about it? The relationship between newspaper crime reporting and fear of crime. Br J Criminol. 1993;33:33–56.
- 61.Arcury TA, Gesler WM, Preisser JS, Sherman J, Spencer J, Perin J. The effects of geography and spatial behavior on health care utilization among the residents of a rural region. Health Serv Res. 2005;40(1):135–155. doi:10.1111/j.1475-6773.2005.00346.x. [DOI] [PMC free article] [PubMed]
- 62.Athas WF, Adams-Cameron M, Hunt WC, Amir-Fazli A, Key CR. Travel distance to radiation therapy and receipt of radiotherapy following breast-conserving surgery. J Natl Cancer Inst. 2000;92(3):269–271. doi:10.1093/jnci/92.3.269. [DOI] [PubMed]
- 63.Baldwin LM, Taplin SH, Friedman H, Moe R. Access to multidisciplinary cancer care: is it linked to the use of breast-conserving surgery with radiation for early-stage breast carcinoma?Cancer J 2004;100(4):701–709. doi:10.1002/cncr.20030. [DOI] [PubMed]
- 64.Baumgardner DJ, Halsmer SE, Steber DL, Shah DS, Mundt MP. Does proximity to clinic affect immunization rates and blood pressure? Int J Psychiatry Med. 2006;36(2):199–209. doi:10.2190/9N36-W446-194L-9KHW. [DOI] [PubMed]
- 65.Burgess JF Jr, DeFiore DA. The effect of distance to VA facilities on the choice and level of utilization of VA outpatient services. Soc Sci Med. 1994;39(1):95–104. doi:10.1016/0277-9536(94)90169-4. [DOI] [PubMed]
- 66.Fortney JC, Booth BM, Blow FC, Bunn JY. The effects of travel barriers and age on the utilization of alcoholism treatment aftercare. Am J Drug Alcohol Abuse. 1995;21(3):391–406. doi:10.3109/00952999509002705. [DOI] [PubMed]
- 67.Gregory PM, Malka ES, Kostis JB, Wilson AC, Arora JK, Rhoads GG. Impact of geographic proximity to cardiac revascularization services on service utilization. Med Care. 2000;38(1):45–57. doi:10.1097/00005650-200001000-00006. [DOI] [PubMed]
- 68.Leibowitz AA, Taylor SL. Distance to public test sites and HIV testing. Med Care Res Rev. 2007;64(5):568–584. doi:10.1177/1077558707304634. [DOI] [PubMed]
- 69.Mooney C, Zwanziger J, Phibbs CS, Schmitt S. Is travel distance a barrier to veterans’ use of VA hospitals for medical surgical care? Soc Sci Med. 2000;50(12):1743–1755. doi:10.1016/S0277-9536(99)00414-1. [DOI] [PubMed]
- 70.Nattinger AB, Kneusel RT, Hoffmann RG, Gilligan MA. Relationship of distance from a radiotherapy facility and initial breast cancer treatment. J Natl Cancer Inst. 2001;93(17):1344–1346. doi:10.1093/jnci/93.17.1344. [DOI] [PubMed]
- 71.Piette JD, Moos RH. The influence of distance on ambulatory care use, death, and readmission following a myocardial infarction. Health Serv Res. 1996;31(5):573–591. [PMC free article] [PubMed]
- 72.Bulliard JL, de Landtsheer JP, Levi F. Profile of women not attending in the Swiss Mammography Screening Pilot Programme. Breast. 2004;13(4):284–289. doi:10.1016/j.breast.2004.03.001. [DOI] [PubMed]
- 73.Engelman KK, Hawley DB, Gazaway R, Mosier MC, Ahluwalia JS, Ellerbeck EF. Impact of geographic barriers on the utilization of mammograms by older rural women. J Am Geriatr Soc. 2002;50(1):62–68. doi:10.1046/j.1532-5415.2002.50009.x. [DOI] [PubMed]
- 74.Hurley SF, Huggins RM, Jolley DJ, Reading D. Recruitment activities and sociodemographic factors that predict attendance at a mammographic screening program. Am J Public Health. 1994;84(10):1655–1658. [DOI] [PMC free article] [PubMed]
- 75.Hyndman JC, Holman CDJ, de Klerk NH. A comparison of measures of access to child health clinics and the implications for modelling the location of new clinics. Aust N Z J Public Health. 1999;23(2):189–195. doi:10.1111/j.1467-842X.1999.tb01233.x. [DOI] [PubMed]
- 76.Maheswaran R, Pearson T, Jordan H, Black D. Socioeconomic deprivation, travel distance, location of service, and uptake of breast cancer screening in North Derbyshire, UK. J Epidemiol Community Health. 2006;60(3):208–212. doi:10.1136/jech.200X.038398. [DOI] [PMC free article] [PubMed]
- 77.Kreher NE, Hickner JM, Ruffin MT, Lin CS. Effect of distance and travel time on rural women’s compliance with screening mammography: an UPRNet study. Upper Peninsula Research Network. J Fam Pract. 1995;40(2):143–147. [PubMed]
- 78.Guagliardo MF. Spatial accessibility of primary care: concepts, methods and challenges. Int J Health Geogr. 2004;3(1):3. doi:10.1186/1476-072X-3-3. [DOI] [PMC free article] [PubMed]
- 79.Zenk SN, Tarlov E. Spatial equity in facilities providing low- or no-fee screening mammography in Chicago neighborhoods. J Urban Health. 2006;83(2):195–210. doi:10.1007/s11524-005-9023-4. [DOI] [PMC free article] [PubMed]
- 80.Morenoff JD. Neighborhood mechanisms and the spatial dynamics of birth weight. AJS. 2003;108(5):976–1017. doi:10.1086/374405. [DOI] [PubMed]