

Abstract
Spoken language processing in noisy environments, a hallmark of the human brain, is subject to age-related decline, even when peripheral hearing might be intact. The present study examines the cortical cerebral hemodynamics (measured by fMRI) associated with such processing in the aging brain. Younger and older subjects identified single words in quiet and in two multi-talker babble noise conditions (SNR 20 and −5 dB). Behaviorally, older and younger subjects did not show significant differences in the first two conditions but older adults performed less accurately in the SNR -5 condition. The fMRI results showed reduced activation in the auditory cortex but an increase in working memory and attention-related cortical areas (prefrontal and precuneus regions) in older subjects, especially in the SNR -5 condition. Increased cortical activities in general cognitive regions were positively correlated with behavioral performance in older listeners, suggestive of a compensatory strategy. Furthermore, inter-regional correlation revealed that while younger subjects showed a more streamlined cortical network of auditory regions in response to spoken word processing in noise, older subjects showed a more diffused network involving frontal and ventral brain regions. These results are consistent with the decline-compensation hypothesis, suggestive of its applicability to the auditory domain.
Keywords: Speech-in-noise, elderly, fMRI, cognitive aging, sensory aging, hearing
INTRODUCTION
The present study compares cortical neurophysiological characteristics of spoken language processing in the presence of noise by younger and older adults. Everyday spoken language processing does not occur in a pristine acoustic environment, but rather in the presence of interfering background noise. It has been documented that the elderly experience increased difficulty understanding speech in noise (SIN) (e.g. Cooper & Gates, 1991; Helfer & Freyman, 2008; Walton, Simon, & Frisina, 2002). While it is the case that the elderly often show peripheral hearing deficits (e.g. Humes & Christopherson, 1991), these deficits alone cannot explain the entirety of their difficulty understanding SIN. Thus, whether and what central mechanisms are compromised in the elderly becomes an important and interesting question (e.g. Frisina & Frisina, 1997; e.g. Humes, 2002; Rajan & Cainer, 2008).
One conceptualization of spoken words processing involves listeners attending to the auditory signal, performing acoustic analysis, mapping the signal to phonemic categories, temporarily storing acoustic information in memory for further processing, and finally mapping phonemes to meaning. Recent reviews (G. Hickok & Poeppel, 2007; Poeppel, Idsardi, & van Wassenhove, 2008) have outlined the cortical mechanisms involved in these processes, with acoustic analysis and auditory-motor interface occurring in the mid-dorsal superior temporal region (STS) pathway extending to premotor and posterior inferior frontal regions (IFG), and the mid-STS to middle temporal (MTG) pathway performing sound-lexical (semantic) mapping. Although receiving much support (e.g. Boemio, Fromm, Braun, & Poeppel, 2005; e.g. G. Hickok, Buchsbaum, B, Humphries, C, Muftuler, T, 2003), no explicit predictions regarding listening to spoken language in noise, nor pertaining to the aging auditory and language system are explicitly made by this proposal.
Recently, several studies have examined cortical mechanisms involved in speech perception in noise by younger adults (Salvi, 2002; Scott, Rosen, Wickham, & Wise, 2004; Sigalovsky, 2006; P. C. M. Wong, Uppunda, Parrish, & Dhar, 2008). It is worth noting that noisy environments do not always impair spoken language comprehension. Compensatory strategies could be employed, though they may not be able to entirely overcome listening difficulty when the noise level is severe. Thus, considerations have to be made regarding experimental design to allow for the examination of noise-dependent brain responses with or without behavioral differences. To this end, we included three experimental conditions in our sparse sampling fMRI study (P. C. M. Wong, Uppunda, Parrish, & Dhar, 2008): listening to speech in quiet and listening to speech in two levels of multi-talker babble noise (noise that mimicked real world listening environments such as a crowded restaurant). Upon extensive testing, we identified two signal-to-noise ratios (SNRs), one leading to identical behavioral performance compared to listening in quiet, and the other significantly hindering the subjects’ behavioral performance. We tested a group of younger normal subjects and found activation in prefrontal cortex (PFC) and left posterior STG during conditions in which multi-talker babble noise is present. Furthermore, we found that the posterior rather than the anterior STG is being activated, coupled with activation in the more dorsal region of PFC. The usage of this dorsal STG-PFC pathway may suggest an increase in subjects’ effort to integrate auditory and motor information (G. P. Hickok, D., 2004), as well as the effort involved in utilizing phonological working memory (Baddeley, 1992) to overcome the presence of noise, as increases in effort coupled with increases in hemodynamic responses are frequently observed (e.g., (Carpenter, 1999). The PFC is particularly important in aging (e.g. Roberto Cabeza, 2002), as will be discussed below. This experimental paradigm was also extended to examine older adults in the current study.
The current study investigates the cortical mechanisms involved in listening to speech in noise in the aging brain. There is abundant information on the neurophysiological correlates of cognitive and perceptual functions in the elderly, using techniques with high spatial resolution such as fMRI (for extensive reviews see R. Cabeza, & Kingstone, A., 2001; R. Cabeza & Dennis, 2007; Powers, 2000). Aspects of memory (R. Cabeza, Grady, C.L., Nyberg, L., McIntosh, A.R., Tulving, E., Kapur, S., Jennings, J.M., Houle, S., & Craik, F.I. M., 1997; Rypma, 2001), attention (e.g.`, R. Cabeza et al., 2004; Madden, Whiting, Provenzale, & Huettel, 2004), and executive functions (e.g.`, Jonides et al., 2000; Langenecker, Nielson, & Rao, 2004) have been the focus of much of this work, although language (e.g.`, Grossman et al., 2002) and vision (Fischer et al., 2005; Grady et al., 1994) have also been examined. The neural bases of aging and auditory perception have also been explored in the elderly (e.g.`, Golob & Starr, 2000; Ostroff, McDonald, Schneider, & Alain, 2003; e.g.`, Snyder & Alain, 2005); but using methods that do not reveal the precise location of changes (e.g., event-related potentials). Taken together, there has been much evidence supporting what has been called the decline-compensation hypothesis. This hypothesis states that cognitive aging involves a combination of decline in sensory processing (and cortical activation) that is accompanied by an increase in the recruitment of more general cognitive areas (e.g., prefrontal cortex) as a means of compensation. Cabeza et al. (2004) provided clear support for this hypothesis, reporting decreased activity in the visual cortex along with an increase in PFC in older subjects across three tasks that involved working memory, visual attention, and episodic retrieval. The decline-compensation hypothesis is contrasted by an alternative common cause hypothesis which argues for a general cerebral-functional decline across both sensory and cognitive brain regions due to aging (and for a review of different hypotheses see R. Cabeza & Dennis, 2007; Li & Lindenberger, 2002).
The present study tests these two hypotheses by examining auditory (spoken word) perception in noise in older and younger adults. Following our previous study (P. C. M. Wong, Uppunda, Parrish, & Dhar, 2008), these two groups of adults who both have normal peripheral hearing functions performed an auditory word-picture matching task in quiet and in two noisy conditions in a sparse-sampling fMRI experiment. If the decline-compensation hypothesis can be generalized to other sensory domains, we would see a decrease in auditory cortex activation accompanied by an increase in activation in general cognitive areas such as PFC in older adults as they attempt to understand spoken words in noisy conditions. A general decline across cognitive and sensory brain areas will be found if the common cause hypothesis is correct.
METERIALS AND METHOD
Subjects
Subjects were 24 adult native speakers of American English, 12 younger adults (mean age = 21.75; age range = 19–27; 8 females) and 12 older adults (mean age = 67.5; age range = 63–75; 6 females), who reported no neurologic deficits. The difference in gender distributions between the two groups was not statistically significant [Chi-square (1) = 1.33, asymp. sig. = .248]. All subjects were right-handed as assessed by the Edinburgh Handedness Inventory (Oldfield, 1971). Subjects’ cognitive abilities were assessed by the Woodcock-Johnson Tests of Cognitive Abilities-3 Brief Intellectual Ability (BIA) index, the Word Attack subtest, and the Letter-Word Identification subtest (Woodcock, 2001). Each subject scored above the 36th percentile on each measure (well above one standard deviation below the mean) based on their age group, and the two groups did not differ on any of these cognitive measures when age-appropriate percentile scores were compared. Between-subject t-tests performed on each measure revealed no significant group differences (BIA: p = .15; WordAttack: p = .37; Letter-Word: p = .93. All p values uncorrected).
Subjects’ peripheral hearing ability was assessed in dB SPL using a custom tracking procedure in 2-dB steps. The stimuli were presented through custom insert earphones that were calibrated in a Bruel and Kjaer 4157 (IEC 711) ear simulator using a Bruel and Kjaer 4134 1/2″ microphone. Subjects controlled the attenuation of the signal generator using a computer mouse. They were instructed to hold the mouse down as long as the signal was audible. Depressing the mouse reduced the level of the signal in the ear. The level would increase in 2-dB steps until the signal was no longer audible, prompting the subject to release the mouse. The midpoints of six such reversals were averaged to compute hearing threshold at a particular frequency. All subjects in both groups had hearing thresholds better than the normal limit in the frequency range relevant for speech perception (e.g., Turner et. al., 1998) (250, 500, 1k, 2k, 3k, and 4k Hz). Mean hearing thresholds along with the standard deviation for each group as a function of frequency are presented in Figure 1.
Figure 1.
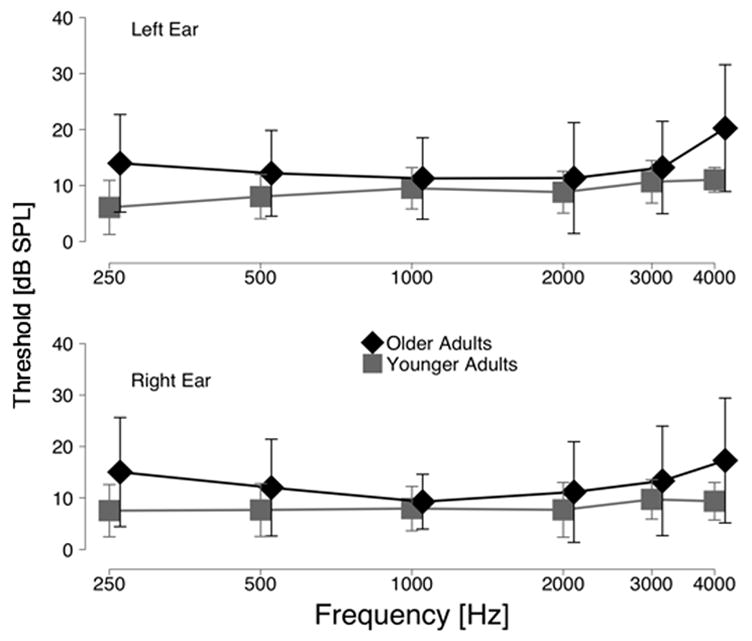
Mean and standard deviation (error bars) of hearing thresholds for the younger and older groups in dB SPL; both groups are within the normal range(American National Standards Institute, 2004).
Stimuli & Experimental Procedures
All experimental procedures were approved by the Northwestern University Institutional Review Board and have therefore been performed in accordance with the ethical standards laid down in the 1964 Declaration of Helsinki. All participants gave their informed consent prior to their inclusion in the study. Stimuli and experimental procedures follow closely to our previous study (P. C. M. Wong, Uppunda, Parrish, & Dhar, 2008) and will be discussed briefly here. Three sets of single-word stimuli produced by a native male speaker of American English were used. The first set was embedded in multi-talker babble noise (taken from the noise channel of SPIN (Bilger, 1984) at an SNR of −5 dB (henceforth, the “SNR -5” set or condition), the second set at an SNR of +20 dB (henceforth, “SNR 20”), and the third set was presented with no background noise (henceforth, “quiet”). The noise accompanying each word was identical in length to the word. SNR was manipulated by first varying the amplitude level of the noise while keeping the amplitude of the spoken words constant across the three conditions. However, all three sets of stimuli, regardless of SNR level, were then RMS-amplitude normalized to 70 dB SPL (this is the only procedure that differed from our previous study where the three sets of stimuli were not amplitude normalized). RMS amplitude of the stimuli was calculated and normalized using Level 16 (Tice, 1997).
Figure 2 details the stimulus presentation and fMRI sequence. There were 14 seconds between two volumes of image acquisition, with scanning occurring during the first two seconds of the 14-second interval. Four trials of a particular stimulus condition, each lasting 3 seconds, were presented to subjects in the remaining 12 seconds. All 4 trials between two volumes of image acquisition belonged to the same stimulus set (quiet or either of the two SNRs). Each trial was presented along with three picture drawings simultaneously, one of which depicted the stimulus. The auditory word in each trial was less than 700 msec in duration, but the picture choices remained for the entire 3-second period. Subjects were asked to identify the stimulus by pressing the button corresponding to the picture. Although the stimuli from each condition (quiet, SNR 20, or SNR -5) were grouped as blocks of four trials as they were presented between two volumes of image acquisition, the blocks from the three conditions were presented in a randomized order.
Figure 2.
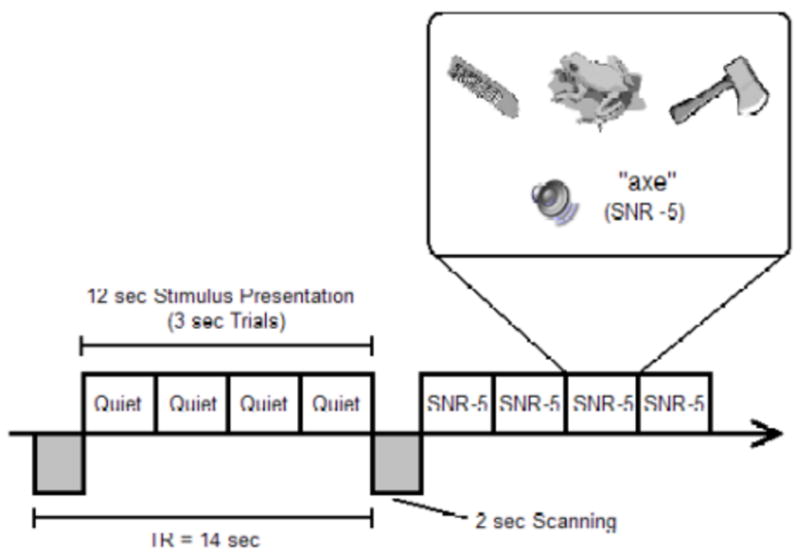
Stimulus presentation and image acquisition. Scanning occurred every 14 seconds. Each scan lasts 2 seconds (shaded boxes below the line). Between scanning, subjects were presented with four trials (open boxes above the line) of stimuli from the same condition, i.e., either listening to speech with no background noise (Quiet), speech embedded in noise with an SNR of 20 dB (SNR 20), or an SNR of -5 dB (SNR -5) (only two blocks are illustrated), with two distracter picture and one target picture choices (see zoomed-in box). There were also 30 null trials when no stimulus (speech or noise) was presented.
Each set of stimuli (quiet, SNR 20, or SNR -5) contained the same 20 target words. Within each set, the 20 words occurred once at the three picture positions (i.e., 60 trials total for each set); however, the picture distracters, chosen from an independent set of 42, were different for each occurrence of the target. In other words, each of the 60 trials within a set of stimuli had a unique configuration of picture distracters. Moreover, the configurations were different across the three stimulus sets; thereby minimizing practice effects. The 60 trials within each set were presented four times, totaling 240 trials per set.
Before noise was added to any stimuli, eight normal hearing subjects were asked to identify these three sets of stimuli in quiet (the configurations of the distracters as well as the order of presentation were identical to the actual fMRI experiment with noise). No reliable differences in accuracy and reaction time among the sets were found as reported in our previous study (P. C. M. Wong, Uppunda, Parrish, & Dhar, 2008). Subjects listened to the stimuli binaurally via headphones which were custom made for MRI environments (Avotec @ avotec.org). The stimuli were presented using the E-prime software program (Psychology Software Tools, Inc, Pittsburg, USA).
MRI Acquisition
MR images were acquired at the Center for Advanced MRI in the Department of Radiology at Northwestern University using a Siemens 3T Trio. A high resolution, T1-weighted 3D volume was acquired sagitally (MP-RAGE; TR/TE = 2100 msec/2.4 msec, flip angle = 8 degrees, TI=1100 ms, matrix size = 256 × 256, FOV of 22cm, slice thickness = 1mm) and was used in conjunction with the functional activation maps to localize the anatomic regions involved. T2*-weighted functional images were acquired axially using a susceptibility weighted EPI pulse sequence while subjects performed the behavioral task (TE = 30 msec, TR = 14 sec, flip angle = 90 degrees, Inplane resolution = 3.4375 mm × 3.4375 mm, 24 slices with a slice thickness = 3 mm and zero gap were acquired in an interleaved measurement). A sparse sampling method was used, which allowed image acquisition to be halted (i.e. no scanner noise) during stimulus presentation and thus minimized contamination of the speech stimuli. In addition, the long TR provided sufficient time for the scanner-noise generated hemodynamic response to decay such that its peak did not overlap with the hemodynamic response generated by the speech stimuli (e.g. Belin, 1999; Gaab & Schlaug, 2003; Hall, 1999; e.g. P. C. Wong, Perrachione, & Parrish, 2007). There were 60 blocks of stimuli for each stimulus set, order randomized across the fMRI experiment. In addition, there were 30 null trials of scanning when no stimuli (speech or noise) were presented. In total, there were 210 (60 × 3 + 30) 14-second TRs lasting 49 minutes.
fMRI Data Analyses
The T2*-weighted functional MR images (time series) were analyzed by AFNI (R.W. Cox, 1996; R. W. Cox & Hyde, 1997). The data were first motion and slice time corrected, then spatially smoothed (FWHM 6 mm), followed by linear detrending and resampling to three cubic-mm. After these preprocessing procedures, hemodynamic responses were estimated. Square waves modeling the events of interest (three stimulus sets) were created as extrinsic model waveforms of the task-related hemodynamic response. Note that even though the TR was 14-seconds long, image acquisition only occurred during the first two seconds of the TR as stated, as opposed to the entire TR. Thus, the images collected reflect either a stimulus event occurring at one of these time points or a null event (no stimulus presented). Imaging at specific time points relative to stimulus presentation removed the need to convolve the task-related extrinsic waveforms with a hemodynamic response function before statistical analyses, as is commonly done (P. C. M. Wong, Nusbaum, H.C., & Small, S.L., 2004). The waveforms of the modeled events were used as regressors in a multiple linear regression of the voxel-based time series. In addition to the three regressors of the events of interest, six motion regressors were used in the multiple linear regression model. Normalized beta values signifying the fit of the regressors to the functional scanning series, voxel-by-voxel for each condition, were used in multi-subject analyses described below. Anatomical and functional images from each subject were normalized to a standard stereotaxic template (ICBM 152) (J. Mazziotta et al., 2001b; J. Mazziotta et al., 2001a; J. C. Mazziotta, Toga, Evans, Fox, & Lancaster, 1995). The sparse sampling method and general fMRI analysis employed here is identical to our previous studies (e.g.`, Margulis, in press; e.g.`, P. C. M. Wong & Perrachione, 2007; P. C. M. Wong, Uppunda, Parrish, & Dhar, 2008).
RESULTS
Behavioral Results
Subjects performed a word identification task in the scanner in the three experimental conditions. In terms of accuracy (Figure 3), a group × condition repeated measures ANOVA showed a main effect of condition [F (2, 44) = 176.949, p < .001], driven by reduced accuracy in the SNR -5 condition regardless of group. A main effect of group [F (1, 22) = 22.668, p < .001] (Younger > Older) and a significant group × condition interaction [F (2, 44) = 19.838, p < .001] were also found. Posthoc t-tests (Bonferroni correction applied for determining significance level) revealed no significant within-group difference for the Quiet vs. SNR 20 comparison where both groups performed near ceiling, nor were there significant between-group differences for the Quiet and SNR 20 conditions. Both within- and between-group differences were found when the SNR -5 condition was considered (SNR -5 vs. Quiet, p < .001 for both groups; SNR -5 vs. SNR 20, p < .001 for both groups; Older vs. Younger (SNR -5), p < .001).
Figure 3.
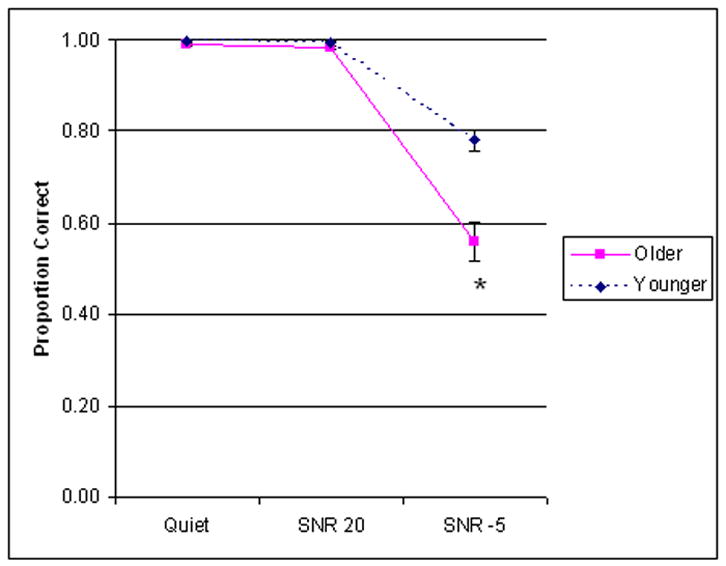
Spoken word processing in noise behavioral performance (inside scanner); error bars indicate standard error of the mean.
In terms of reaction time, a main effect of condition [F (2, 44) = 245.049, p < .001] was found, driven by slower performance on the SNR -5 condition relative to the other two conditions for both groups (no significant within-group difference was found for the Quiet vs. SNR 20 comparison for both groups). No main effect of group [F (1, 22) = .944, p = .342], nor a significant interaction [F (2, 44) = .418, p = .661] was found. Notably, no significant between-group differences were found for any conditions.
Imaging Results
We report three types of analyses: voxel-wise ANOVA, inter-regional correlations, and brain-behavioral correlations.
Voxel-wise ANOVA
Normalized beta values from each condition from each subject were entered into a three-dimensional mixed effects ANOVA (using the “3dANOVA” program in AFNI) with subject as a random factor and condition as a within-subject fixed factor. We focus our report here on brain regions showing a main effect of group and a significant group × condition interaction, as the key focus here is how younger and older subjects differ in brain activation, and how they differ in different listening conditions. We determined our statistical threshold by first creating a mask based on the main effect of condition from the three-dimensional ANOVA and an arbitrary and liberal single-voxel p value of .005 without a spatial extent constraint. This mask was used in a Monte Carlo simulation (family-wise alpha was set at .05), which resulted in a single-voxel p value of .005 extending at least 370 cubic-mm. Because the key question concerns how patterns of brain activation differed across conditions when the two subject groups are compared, using a mask based on condition is justified. More conservatively, we also performed another Monte Carlo simulation without a mask to estimate the single-voxel p value and spatial extent threshold corresponding to a whole-brain alpha level of less than .05, which resulted in a single-voxel p value of .005 extending at least 620 cubic-mm. Although we report and discuss results based on a less conservative threshold (with a mask from the main effect of condition), it is noteworthy that results based on the less conservative threshold are a subset of the conservative results differing only in the spatial extent cutoff (370 vs. 620 cubic-mm).
To illustrate the nature of the main effect and significant interaction, group × condition repeated measures ANOVAs and posthoc t-tests were performed on each region (cluster) that met the statistical threshold discussed above. These offline cluster-specific statistical analyses are reported in Table 1 (for main effect) and Table 2 (for interaction).
Table 1.
Brain regions showing a main effect of group based on a 3-dimensional voxel-wise mixed effects ANOVA (p < .05 corrected)
| Region | Peak Voxel Coordinate | Spatial Extent (cubic-mm) | Peak Voxel Intensity (%) | Cluster-Specific Statistics | ||
|---|---|---|---|---|---|---|
| R Dorsal MFG/PrecentG | 29 | −9 | 66 | 1597 | 1.3605 | Condition: F(2, 44) = 3.210, p=0.05 |
| Group: F(1,22) = 26.970, p<0.001 (Old > Young) | ||||||
| Interaction: F(2,44) = 0.162, p=0.851 | ||||||
| R aSTG/22/Insula | 44 | −4 | −3 | 418 | 1.4258 | Condition: F(2,44) = 0.672, p=0.516 |
| Group: (F1,22) = 16.617, p<0.001 (Young > Old) | ||||||
| Interaction: F(2,44) = 0.075, p=.928 | ||||||
| R Insula/HG/13/41 | 37 | −23 | 15 | 620 | 1.1835 | Condition: F(2,44) = 6.100, p=0.005 |
| Group: F(1,22) =22.583, p<0.001 (Young > Old) | ||||||
| Interaction: F(2,44) = 2.489, p=0.095 | ||||||
| R PrecentG/MFG/6 | 30 | −14 | 49 | 1126 | 1.1933 | Condition: F(2,44) = 7.950, p<0.001 |
| Group: F(1,22) = 17.739, p<0.001 (Old > Young) | ||||||
| Interaction: F(2,44) = 0.325, p=0.724 | ||||||
| R PrecentG/MFG/6 | 47 | −4 | 44 | 399 | 1.1218 | Condition: F(2,44) = 16.185, p<0.001 |
| Group: (F1,22) = 15.29, p<0.001 (Old > Young) | ||||||
| Interaction: F(2,44) = 0.100, p=.905 | ||||||
| R Precun/7 | 6 | −75 | 49 | 529 | 3.6458 | Condition: F(2,44) = 12.333, p<0.001 |
| Group: (F1,22) = 15.391, p<0.001 (Old > Young) | ||||||
| Interaction: F(2,44) = 0.144, p=0.867 | ||||||
| L PrecentG/6/MFG | −27 | −10 | 48 | 812 | 1.4609 | Condition: F(2,44) = 6.529, p=0.003 |
| Group: F(1,22) = 18.714, p<0.001 (Old > Young) | ||||||
| Interaction: F(2,44) = 0.791, p=0.460 | ||||||
L = Left, R = Right, PrecentG = Precentral Gyrus, MFG = Middle Frontal Gyrus, HG = Heschl’s Gyrus, Precun = Precuneus, a = Anterior, and number indicates Brodmann’s Area.
Table 2.
Brain regions showing a significant group × condition interaction based on a 3-dimensional voxel-wise mixed effects ANOVA (p < .05 corrected).
| Region | Peak Voxel Coordinate | Spatial Extent (cubic-mm) | Peak Voxel Intensity (%) | Cluster-Specific Statistics | ||
|---|---|---|---|---|---|---|
| R STG/22/42 | 66 | −30 | 10 | 2708 | 0.379 | Condition: F(2,44)=9.214, p<0.001 |
| Group: F(1,22)=0.607, p=0.444 | ||||||
| Interaction: F(2,44)=16.509, p<0.001 | ||||||
| SNR -5: Young>Old, p=.005 | ||||||
| R MeFG/6 | 2 | −23 | 55 | 1851 | 0.277 | Condition: F(2,44)=4.330, p=0.019 |
| Group: F(1,22)=1.643, p=0.213 | ||||||
| Interaction: F(2,44)=11.557, p<0.001 | ||||||
| SNR -5: Young>Old, p=0.015 | ||||||
| R IPL/40/Precun/7 | 32 | −51 | 55 | 1590 | 0.2911 | Condition: F(2,44)=12.509, p<0.001 |
| Group: F(1,22)=1.302, p=0.266 | ||||||
| Interaction: F(2,44)=12.974, p<0.001 | ||||||
| Quiet: Old>Young, p=0.0482 | ||||||
| SNR 20: Old>Young, p=0.017 | ||||||
| R MTG/ITG (extending from anterior-middle portion) | 63 | −10 | −4 | 792 | 0.3387 | Condition: F(2,44)=2.346, p=.108 |
| Group: F(1,22)=0.736, p<.400 | ||||||
| Interaction: F(2,44)=18.420,p<0.001 | ||||||
| SNR -5: Old > Young, p=0.028 | ||||||
| L STG/42/22/Postcent | −61 | −22 | 16 | 1229 | 0.6034 | Condition: F(2,44)=16.192, p<0.001 |
| Group: F(1,22)=2.552, p=.124 | ||||||
| G | Interaction: F(2,44)=16.714, p<0.001 | |||||
| SNR -5: Young>Old, p=0.004 | ||||||
| L IPL/7/Precun | −42 | −64 | 45 | 1108 | 0.5839 | Condition: F(2,44)=14.184, p<0.001 |
| Group: F(1,22)=.315, p=.580 | ||||||
| Interaction: F(2,44)=14.155, p<0.001 | ||||||
| Quiet: Young>Old, p=0.038 | ||||||
| SNR 20: Young>Old, p=0.013 | ||||||
| L MeFG/AntCing | 0 55 | 3 | 1005 | 1.1217 | Condition: F(2,44)=12.748, p<0.001 | |
| Group: F(1,22)=.013, p=.912 | ||||||
| Interaction: F(2,44)=10.226, p<0.001 | ||||||
| SNR -5: Old>Young, p=0.022 | ||||||
| L Supramarg/40/7 | −30 | −48 | 38 | 839 | 0.2651 | Condition: F(2,44)=28.053, p<0.001 |
| Group: F(1,22)=4.707, p=0.041 | ||||||
| Interaction: F(2,44)=12.237, p<0.001 | ||||||
| Quiet: Old>Young, p=0.011 | ||||||
| SNR 20: Old>Young, p=0.004 | ||||||
| L MTG (middle portion) | −62 | −35 | −7.0 | 654 | 0.4302 | Condition: F(2,44)=1.859, p=.168 |
| Group: F(1,22)=0.015, p=.904 | ||||||
| Interaction: F(2,44)=13.642, p<0.001 | ||||||
| SNR -5: Old>Young, p=0.050 | ||||||
| L IFG/47* | −40 | 33 | −8 | 311 | 0.3905 | Condition: F(2,44)=.040, p=0.961 |
| Group: F(1,22)=1.326, p=0.262 | ||||||
| Interaction: F(2,44)=11.895, p<0.001 | ||||||
| SNR 20: Young>Old, p=0.050 | ||||||
| L IFG/47* | −31 | 13 | −11 | 292 | 0.3793 | Condition: F(2,44)=1.437, p=0.249 |
| Group: F(1,22)=5.735, p=0.026 | ||||||
| Interaction: F(2,44)=11.207, p<0.001 | ||||||
| Quiet: Young>Old, p=0.011 | ||||||
| SNR 20: Young>Old, p=0.003 | ||||||
In addition to those abbreviations listed on Table 1, MeFG = Medial Frontal Gyrus, IPL = Inferior Parietal Lobule, AntCing = Anterior Cingulate, Supramarg = Supramarginal Gyrus, ITG = Inferior Temporal Gyrus, IFG = Inferior Frontal Gyrus.
Two clusters did not exceed spatial threshold in isolation, but they are adjacent to each other and when combined exceeded such threshold.
Main Effect of Group
Table 1 summarizes the regions which showed a main effect of group from our voxel-wise ANOVA and the associated cluster statistics. Generally speaking, in terms of sensory area, older subjects showed a reduced activity in the right superior temporal region. However, for posterior parietal (precuneus) and prefrontal (dorsal medial) areas, older subjects generally showed increased activation. For illustrative purposes, Figure 4 shows voxel-wise group comparisons for each for the condition based on independent-sample t-tests (p < .05 corrected). These results provide an initial support for the decline-compensation hypothesis in the auditory domain.
Figure 4.

Between-group differences in Quiet (left), SNR 20 (middle), and SNR -5 (right) conditions based on independent-sample t-tests (p < .05 corrected). A saggital view is shown x = 41 (right hemisphere). PP = posterior parietal region including precuneus; PFC = prefrontal cortex, the spatial extent could include postcentral gyrus; and STR = superior temporal region (medial to lateral, could include the insular cortex). Blue and red indicates stronger activation in younger and older group, respectively.
Group × Condition Interaction
Table 2 summarizes the regions which showed a significant group × condition interaction from our voxel-wise ANOVA and the associated cluster statistics. In terms of sensory areas, bilateral superior temporal regions showed increased activation as noise increases in younger subjects, while an overall lower level of activation and activation undifferentiated by condition was seen in the older group; Figure 5 (top panel) shows activation in the left STG cluster. Even though older subjects had an overall elevated activation compared to the younger group, their activation was again undifferentiated by condition in the bilateral posterior parietal region, while younger subjects showed increases in the SNR -5 condition; Figure 5 (middle panel) shows the right precuneus results. In the anterior cingulate, again older subjects did not differentiate activation across conditions, while a decrease in activation was found in the younger subjects in the SNR -5 condition (Figure 5 bottom panel). In the dorsal medial frontal region (Figure 6 top panel), older and younger subjects did not differ in the Quiet and SNR 20 conditions, but younger adults showed greater activation than the older adults in the SNR -5 condition. In the middle temporal gyrus, older subjects showed increased bilateral activation in the SNR -5 condition while the younger subjects showed decreased activation; Figure 6 (middle panel) shows the results in the left MTG. Although these differences did not survive cluster size threshold, there are two clusters in the left inferior frontal gyrus/BA 47 (Figure 6 bottom panel) that showed significant group × condition interaction. While the two groups differed in the Quiet and SNR 20 conditions (younger > older), they did not differ in the SNR -5 condition (decreasing activation for younger adults and increasing activation for older adults). Taken together, these results provide additional support for the decline-compensation hypothesis. In particular, the greatest relative decrease in sensory areas (STG) was seen in the SNR -5 condition in the older listeners, while a high level of activation was maintained across conditions in the attention and working-memory related areas.
Figure 5.

Left brain regions showing significant group × condition interaction based on a mixed effects three-dimensional ANOVA (p < .05 corrected). Saggital (left) and axial (middle) views are shown. The right panel shows the corresponding bar graph (error bar indicates standard error of the mean). Left STG, left MTG, and left IFG (BA 47) are shown (from top to bottom), with arrows indicating the areas of interest.
Figure 6.

Right and midline brain regions showing significant group × condition interaction based on a mixed effects three-dimensional ANOVA (p < .05 corrected). Saggital (left) and axial (middle) views are shown. The right panel shows the corresponding bar graph (error bar indicates standard error of the mean). Right medial frontal, right precuneus, and the anterior cingulate are shown (from top to bottom), with arrows indicating the areas of interest.
Inter-regional Correlations
To examine the relationships of activation among cortical regions and to assess differences between the older and younger groups, we performed a voxel-wise inter-regional correlation analysis for each group of subjects and quantitatively compared differences in correlations between the two groups. Because the three-dimensional ANOVA results above revealed that the greatest group differences were in the SNR -5 condition, and because we were concerned with how sensory and cognitive areas interact, we focused our analysis on the SNR -5 condition and used a seed voxel from the auditory cortex. We first identified the highest activating voxel in the left STG based on the main effect of condition (irrespective of group) from the voxel-wise ANOVA discussed above. This voxel is located posterior to HG near planum temporale/BA 42 [−61, 31, 10]. Using this as the seed voxel, we performed a whole-brain 3-dimensional cross-correlation for the SNR -5 condition for each group of subjects. Differences (z) between the Fisher-z transformed correlation coefficients of the two groups were then calculated by using the following formula (Fisher, 1921):
where r1 and r2 correspond to the absolute correlation coefficients for the older and younger group, respectively; and n1 and n2 correspond to the number of subjects in each group.
While the older group shows increased correlation between the left STG seed voxel and numerous other brain regions (Table 3), especially in the frontal lobe including PFC (Figure 7 top panel), the younger subjects showed only correlation with the right STG (but at subthreshold, i.e., the original spatial extent criterion of 370 cubic-mm established based on our Monte Carlo simulation was relaxed) as revealed in Figure 7 (middle panel). Figure 7 (bottom panel) shows a voxel-wise statistical comparison between the two groups, which confirmed that inter-regional correlation was stronger from left STG to PFC and from left STG to right STG for the older and younger groups, respectively.
Table 3.
Brain regions showing significant inter-regional correlation with a seed voxel in the left STG (see text for explanation) in the SNR -5 condition
| Region | Peak Voxel Coordinate | Spatial Extent (cubic-mm) | |||
|---|---|---|---|---|---|
| Older Group | Correlations | ||||
| L STG [seed voxel] | 61.0 | 31.0 | 10.0 | 1262 | 1 |
| R aMTG | −64.0 | 16.0 | −3.0 | 943 | 0.9566 |
| R PrecentG/6 | −23.0 | 18.0 | 63.0 | 560 | 0.9445 |
| R IFG/6 | −46.0 | −2.0 | 25.0 | 529 | 0.9391 |
| L PrecentG/6 | 55.0 | 4.0 | 26.0 | 417 | 0.9516 |
| Younger Group | |||||
| L STG [seed voxel] | 61.0 | 31.0 | 10.0 | 672 | 1 |
| R STG* | −48.0 | 37.0 | 10.0 | 84 | 0.859 |
| Significant Difference | |||||
| Old > Young | Z Difference | ||||
| R PrecentG/6 | −23.0 | 18.0 | 63.0 | 175 | 3.29 |
| R IFG/6* | −47.0 | −2.0 | 25.0 | 156 | 3.5551 |
| L PrecenG/6* | 55.0 | 4.0 | 26.0 | 124 | 3.6891 |
| Younger > Old | |||||
| R STG* | −49.0 | 38.0 | 11.0 | 162 | −2.5269 |
Unless noted with an asterisk (*), the regions are significant at a corrected p < .05.
Regions did not meet the spatial extent cutoff of 370 cubic-mm but met the single p value cutoff of .005.
Figure 7.

Brain regions showing significant inter-regional correlation with a seed voxel in the left STG (see text for explanation) in the SNR -5 condition. Saggital slices (right panels) show regions in the right prefrontal cortex (p < .05 corrected), and axial slices (left panels) show the right STG (p < .005 uncorrected). Top and middle panels show inter-regional correlation for the older and younger groups. Bottom panel (“Diff”) shows differences (z) between the Fisher-z transformed correlation coefficients of the two groups, with red and blue clusters showing more significant correlations for older and younger subjects, respectively.
Brain-Behavior Correlations
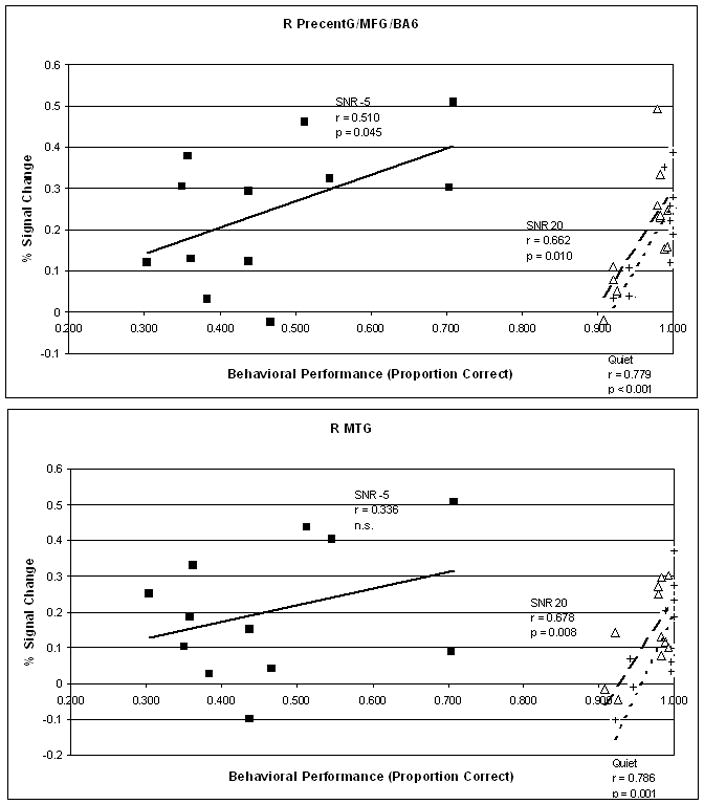
An important question pertaining to increased activation in the older subjects is whether such increases are beneficial to behavioral performance. To assess this, we performed a series of correlations between brain activation and behavioral accuracy. Percent signal change within the clusters reported in the voxel-wise ANOVA above were averaged for each subject for each condition. Only clusters that showed higher activation in the older subjects in at least one condition were included, which means clusters from bilateral precentral gyrus, right precuneus, and bilateral MTG were analyzed. Only voxels exceeding a single voxel p threshold of .005 were averaged. Because of the number of comparisons involved, only significant results are discussed here. Behavioral accuracy was arcsine transformed to improve normality. All p values reported are uncorrected. For right precentral gyrus (extending to middle frontal gyrus and BA 6) [peak voxel at 30, −14 49; 1126 cubic-mm], a significant positive correlation was found between brain activation and behavioral accuracy across all three conditions [Quiet: Pearson’s r = .779, p < .001; SNR 20: r= .662, p =.010; SNR =5: r = .510, p = .045] (Figure 8, top panel). Similar results were found for the right precuneus (BA 7) [6 −72 49; 529 cubic-mm] across three conditions [Quiet: Pearson’s r = .539, p = .035; SNR 20: r= .460, p =.066; SNR =5: r = .541, p = .035]. Thus, generally speaking, for general cognitive and association areas, increased activation is beneficial to behavioral performance for older subjects. Interestingly, for the bilateral MTG, areas that are generally attributed to sound-to-meaning mapping (G. Hickok & Poeppel, 2007), a positive correlation was only found between brain activation in behavioral performance in the two conditions where the older subjects performed well (Quiet and SNR 20 conditions). For the right MTG [63 −10 −4; 792 cubic-mm], a significant positive correlation was found in the Quiet [r = .786, p < .001] and SNR 20 [r = .678, p = .008] conditions but not the SNR -5 condition [r = .336, p = .143]. Similarly, for the left MTG [−62 −35 −7; 654 cubic-mm], a (marginally) significant positive correlation was found in the Quiet [r = .552, p = .031] and SNR 20 [r = .492, p = .052] conditions but not the SNR -5 condition [r = .328, p = .149] (Figure 8, bottom panel). In other words, increasing the engagement of a word-meaning area did not result in successful performance in a condition where noise is severely detrimental.
Figure 8.
Correlation between brain activation and behavioral performance (accuracy) in the scanner. Top and bottom panels show correlations in right precentral gyrus and left MTG, respectively. Results from the Quiet, SNR 20, and SNR -5 conditions are indicated by plus symbol and short dashes, triangle symbol and thick dashes, and filled square symbol and solid line, respectively.
DISCUSSION
The present study provides the first demonstration of the interplay between cognitive and sensory cortical activities pertaining to spoken word processing in noise in the elderly, as far as we are aware. Although much research on cognitive aging has been conducted, the primary focus has been on memory, attention, executive functions, visual perception, and language processing (for review see R. Cabeza & Dennis, 2007). Furthermore, although much research on the aging auditory system has been performed, their primary concerns were in peripheral hearing loss (for review see Gordon-Salant, 2005). It is worth noting that although a highly informative recent fMRI study on listening to speech in noise in older subjects was conducted (Hwang, Li, Wu, Chen, & Liu, 2007), it fell short in considering active spoken word/semantic processing in ecologically realistic noise, which would inevitably evoke cognitive and sensory processes (Rajan & Cainer, 2008). In Hwang et al., subjects were asked to count the number of sentences they heard that were presented in white noise as opposed to active word processing in multi-talker babble. Not surprisingly, their results were only confined to the auditory cortex without observing the interplay between cognitive and sensory regions as we observed in the present study.
Our study tested the decline-compensation hypothesis, which postulates that the neurophysiological characteristics of an aging brain as pertained to sensory-cognitive demanding tasks include a reduction and increase in activation in sensory and general cognitive (association) areas, respectively. Our findings support this hypothesis. While the bilateral superior temporal regions (see Figure 5 top panel for left STG results) show decreased activation in the older group, regions around prefrontal cortex (Figure 4) and precuneus (Figure 4 and Figure 5 middle panel) show relatively increased activity in the older group compared to the younger group. It is important to note that this hypothesis is only true if indeed increased activation in areas that are associated with attention and working memory is associated with performance. Our findings confirm such a compensation claim. Correlation analysis revealed that activation in frontal regions around PFC and precuneus (Figure 8 top panel) regions is positively correlated with behavioral performance across all listening conditions in the older group. These results provide support for the notion that the decline-compensation hypothesis can be generalized to the auditory domain. It is worth noting that the decline-compensation pattern of results was true regardless of listening conditions and regardless of the older and younger subjects’ behavioral performance, although there was a tendency of equal contribution of the precuneus in the most difficult listening condition for the two groups (increased activation in younger subjects).
We did not find global decline in the older subjects as predicted by the common cause hypothesis. Although cerebral decline could be viewed as decreases in cerebral hemodynamic deactivation, it could also be conceived as neural inefficiency or disintegrations of neuronal excitation/inhibition that cause increases in the overall hemodynamic response. But regardless of the underlying neuronal mechanism of the common cause, we did not find group differences that are general to both cognitive and sensory brain areas, rather we found increases in some and decreases in others. The pattern of results we found is therefore inconsistent with the common cause hypothesis.
We also found signatures of a more diffused cortical network in the elderly subjects. Inter-regional correlations revealed that while younger subjects focused on bilateral auditory regions in performing the most difficult spoken word processing in noise task, the older subjects used a broader network that included frontal regions (IFG/BA 6) and MTG (see Figure 7 and Table 3, respectively). Previous research has found cortical streamlining, including a decrease in usage of attentional network (e.g.`, Kelly & Garavan, 2005), to be associated with successful performance. For example, Booth et al. (2001) found that while children tend to show activation of overlapped brain regions in processing both written and spoken words, adults tend to use unimodal areas depending on the modality in which words are presented (STG for auditory and fusiform gyrus for visual) (Booth, 2001). Wong et al. (2007) found that while less successful spoken language learners showed increased activation in a broad network of right lateral and medial frontal regions, anterior cingulate, and right STG, successful learners showed a more focused activation in the left posterior STG. Furthermore, Kelly and Garavan in their review found that successful performance and efficiency is usually accompanied by decreases in activation in PFC and precuneus. It is interesting to note that unlike Cabeza et al. (2004), we found a positive, rather than a negative correlation between activation in the sensory and frontal regions. Although a positive correlation could be interpreted as supportive of the common cause hypothesis of aging, it is important to note that in order for increased activation to be truly compensatory, activation must be linked to behavioral performance, as we found. Therefore, we believe that our results, which found positive correlations between brain activation and behavioral performance, are consistent with a compensatory view. The discrepancy between the present study and Cabeza et al. is perhaps due to differences in task demands and sensory modalities.
An important part of spoken word processing is sound-to-meaning mapping (including semantic processing). It has been proposed that the ventral auditory pathway (superior to middle temporal regions), likely bilaterally, involves such processing (G. Hickok & Poeppel, 2007). As in previous studies which found age-related increase in ventral temporal areas during language processing (e.g.`, Grossman et al., 2002), we found group differences in the MTG in the present study. In terms of absolute activation, the two groups did not differ in the Quiet and SNR 20 conditions in which no significant word identification differences were found. However, the older listeners showed increased MTG activation in the SNR -5 condition in which they performed worse behaviorally (Figure 6 middle panel). Our inter-regional correlation analysis showed significant STG-MTG correlation in the older group only, suggesting that MTG was recruited in conjunction with auditory areas in processing spoken words in severely loud noise. Surprisingly, MTG activation was only correlated with behavioral performance in the Quiet and SNR 20 conditions, but not the SNR -5 condition. Taken together, these results suggest that although older subjects recruited MTG in spoken word processing, they were only successful when the listening condition was not severely compromised. Further effort in recruiting MTG when much of the speech signal was masked by noise did not serve as a beneficial strategy. It is interesting to see that for the younger subjects, there was a decrease in absolute MTG activation in the SNR -5 condition. As that was also the condition where the least semantic processing occurred (as words were not comprehended), the pattern of results was consistent with the commonly accepted role of the MTG.
We also found results in several regions to be surprising. For example, in the left IFG and anterior cingulate (Figure 5 and 6 bottom panels), we saw disengagements by the younger subjects in the SNR -5 condition. As this condition was the most difficult even for the younger subjects, we expected to find increases rather than decreases. Similarly in the medial frontal gyrus (Figure 6 top panel), we saw a decrease in activation in the older subjects. It is unclear at this point why such cortical decreases were found; however, they could be related to the fact that in this condition, certain words were completely masked by the noise and subjects were habituated into a state where word processing and attention was not needed in some of the trials. Future research is needed to disentangle activation and deactivation in these areas across listening condition and listener groups.
A hallmark of our auditory and language neural systems is the ability to accomplish information processing in the presence of noise, which involves acoustic analysis, signal-noise separation, phoneme mapping, and sound-to-word mapping. Such processing has been found to be affected by aging, even when the peripheral auditory system might be intact. Here we reported a study examining the sensory and cognitive interplays during spoken word processing in the aging brain. Consistent with the decline-compensation hypothesis, we found reduced activation in auditory regions in older compared to younger subjects, while increased activation in frontal and posterior parietal working memory and attention network was found. Increased activation in these frontal and posterior parietal regions were positively correlated with behavioral performance in older subjects, suggesting their compensatory role in aiding older subjects to achieve accurate spoken word processing in noise.
Acknowledgments
We thank Allison Barr, Salvia Lee, Bharath Chandrasekaran, Todd Parrish, Nondas Leloudas, and Lauren Calandruccio for their assistance in this research. This research is supported by grants from the National Institutes of Health (R01DC008333, R21DC007468, & R03HD051827), Northwestern University School of Communication, and Alumnae of Northwestern Association to P.W., and a Northwestern University Undergraduate Research Council grant to E.L. A portion of this work was presented at the Acoustical Society of America meeting (Paris, 2008).
Footnotes
Publisher's Disclaimer: This is a PDF file of an unedited manuscript that has been accepted for publication. As a service to our customers we are providing this early version of the manuscript. The manuscript will undergo copyediting, typesetting, and review of the resulting proof before it is published in its final citable form. Please note that during the production process errors may be discovered which could affect the content, and all legal disclaimers that apply to the journal pertain.
References
- American National Standards Institute. Specification for Audiometers. ANSI S3.6-2004. New York: ANSI; 2004. [Google Scholar]
- Baddeley A. Working memory. Science. 1992;255(5044):556–559. doi: 10.1126/science.1736359. [DOI] [PubMed] [Google Scholar]
- Belin P, Zatorre RJ, Hoge R, Evans AC, Pike B. Event-related fMRI of the auditory cortex. NeuroImage. 1999;10:417–429. doi: 10.1006/nimg.1999.0480. [DOI] [PubMed] [Google Scholar]
- Bilger RC, Nuetzel JM, Rabinowitz WM, Rzeczkowski C. Standardization of a test of speech perception in noise. Journal of Speech and Hearing Research. 1984;27:32–48. doi: 10.1044/jshr.2701.32. [DOI] [PubMed] [Google Scholar]
- Boemio A, Fromm S, Braun A, Poeppel D. Hierarchical and asymmetric temporal sensitivity in human auditory cortices. Nat Neurosci. 2005;8(3):389–395. doi: 10.1038/nn1409. [DOI] [PubMed] [Google Scholar]
- Booth JR, Burman DD, Van Santen FW, Harasaki Y, Gitelman DR, Parrish TB, Mesulam MM. The development of specialized brain systems for reading and oral-language. Child Neuropsychology. 2001;7:119–141. doi: 10.1076/chin.7.3.119.8740. [DOI] [PubMed] [Google Scholar]
- Cabeza R. Hemispheric asymmetry reduction in older adults: the HAROLD model. Psychology and Aging. 2002;17(1):85–100. doi: 10.1037//0882-7974.17.1.85. [DOI] [PubMed] [Google Scholar]
- Cabeza R, Kingstone A. Handbook of Functional Neuroimaging of Cognition. Cambridge, MA: The MIT Press; 2001. [Google Scholar]
- Cabeza R, Daselaar SM, Dolcos F, Prince SE, Budde M, Nyberg L. Task-independent and task-specific age effects on brain activity during working memory, visual attention and episodic retrieval. Cereb Cortex. 2004;14(4):364–375. doi: 10.1093/cercor/bhg133. [DOI] [PubMed] [Google Scholar]
- Cabeza R, Dennis NA. Neuroimaging of Healthy Cognitive Aging. In: Craik FIM, Salthouse TA, editors. The Handbook of Aging and Cognition. 3. Psychology Press; 2007. [Google Scholar]
- Cabeza R, Grady CL, Nyberg L, McIntosh AR, Tulving E, Kapur S, Jennings JM, Houle S, Craik FIM. Age-related differences in neural activity during memory encoding and retrieval: a positron emission tomography study. The Journal of Neuroscience. 1997;17(1):391–400. doi: 10.1523/JNEUROSCI.17-01-00391.1997. [DOI] [PMC free article] [PubMed] [Google Scholar]
- Carpenter PA, Just MA, Keller TA, Eddy W, Thulborn K. Graded functional activation in visuospatial system with the amount of task demand. Journal of Cognitive Neuroscience. 1999;11(1):9–24. doi: 10.1162/089892999563210. [DOI] [PubMed] [Google Scholar]
- Cooper JC, Gates GA. Hearing in the elderly-the Framingham cohort, 1983–1985: Part II: Prevalence of central auditory processing disorders. Ear and Hearing. 1991;12:304–311. doi: 10.1097/00003446-199110000-00002. [DOI] [PubMed] [Google Scholar]
- Cox RW. AFNI: Software for analysis and visualization of functional magnetic resonance neuroimages. Computers in Biomedical Research. 1996;29:162–173. doi: 10.1006/cbmr.1996.0014. [DOI] [PubMed] [Google Scholar]
- Cox RW, Hyde JS. Software tools for analysis and visualization of fMRI data. NMR Biomed. 1997;10(4–5):171–178. doi: 10.1002/(sici)1099-1492(199706/08)10:4/5<171::aid-nbm453>3.0.co;2-l. [DOI] [PubMed] [Google Scholar]
- Fischer H, Sandblom J, Gavazzeni G, Fransson P, Wright C, Baeckman K. Age-differential patterns of brain activation during perception of angry faces. Neuroscience Letters. 2005;386(2):99–104. doi: 10.1016/j.neulet.2005.06.002. [DOI] [PubMed] [Google Scholar]
- Fisher RA. On the probable error of a coefficient of correlation deduced from a small sample. Metron. 1921;1:3–32. [Google Scholar]
- Frisina DR, Frisina RD. Speech recognition in noise and presycusis: relations to possible neural mechanisms. Hearing Research. 1997;106:95–104. doi: 10.1016/s0378-5955(97)00006-3. [DOI] [PubMed] [Google Scholar]
- Gaab N, Schlaug G. The effect of musicianship on pitch memory in performance matched groups. NeuroReport. 2003;14:2291–2295. doi: 10.1097/00001756-200312190-00001. [DOI] [PubMed] [Google Scholar]
- Golob E, Starr A. Age-related qualitative differences in auditory cortical responses during short-term memory. Clinical Neurophysiology. 2000;111(12):2234–2244. doi: 10.1016/s1388-2457(00)00468-5. [DOI] [PubMed] [Google Scholar]
- Gordon-Salant S. Hearing loss and aging: new research findings and clinical implications. J Rehabil Res Dev. 2005;42(4 Suppl 2):9–24. doi: 10.1682/jrrd.2005.01.0006. [DOI] [PubMed] [Google Scholar]
- Grady C, Maisog J, Horwitz B, Ungerleider L, Mentis M, Salerno J, et al. Age-related changes in cortical blood flow activation during visual processing of faces and location. Journal of Neuroscience. 1994;4(3 pt 2):1450–1462. doi: 10.1523/JNEUROSCI.14-03-01450.1994. [DOI] [PMC free article] [PubMed] [Google Scholar]
- Grossman M, Smith EE, Koenig P, Glosser G, DeVita C, Moore P, et al. The neural basis for categorization in semantic memory. NeuroImage. 2002;17(3):1549–1561. doi: 10.1006/nimg.2002.1273. [DOI] [PubMed] [Google Scholar]
- Hall DA, Haggard MP, Akeroyd MA, Palmer AR, Summerfield AQ, Elliott MR, Gurney EM, Bowtell RW. Sparse temporal sampling in auditory fMRI. Human Brain Mapping. 1999;7:213–223. doi: 10.1002/(SICI)1097-0193(1999)7:3<213::AID-HBM5>3.0.CO;2-N. [DOI] [PMC free article] [PubMed] [Google Scholar]
- Helfer KS, Freyman RL. Aging and speech-on-speech masking. Ear Hear. 2008;29(1):87–98. doi: 10.1097/AUD.0b013e31815d638b. [DOI] [PMC free article] [PubMed] [Google Scholar]
- Hickok G, Buchsbaum B, Humphries C, Muftuler T. Auditory-motor interaction revealed by fMRI: speech, music, and working memory in area Spt. Journal of Cognitive Neuroscience. 2003;15(5):673–682. doi: 10.1162/089892903322307393. [DOI] [PubMed] [Google Scholar]
- Hickok G, Poeppel D. The cortical organization of speech processing. Nat Rev Neurosci. 2007;8(5):393–402. doi: 10.1038/nrn2113. [DOI] [PubMed] [Google Scholar]
- Hickok GPD. Dorsal and ventral streams: a framework for understanding aspects of the functional anatomy of language. Cognition. 2004;92:67–99. doi: 10.1016/j.cognition.2003.10.011. [DOI] [PubMed] [Google Scholar]
- Humes LE. Factors underlying the speech-recognition performance of elderly hearing-aid wearers. Journal of the Acoustical Society of America. 2002;112(3):1112–1132. doi: 10.1121/1.1499132. [DOI] [PubMed] [Google Scholar]
- Humes LE, Christopherson L. Speech identification difficulties of hearing-impaired elderly persons: the contributions of auditory processing deficits. Journal of Speech and Hearing Research. 1991;34:686–693. doi: 10.1044/jshr.3403.686. [DOI] [PubMed] [Google Scholar]
- Hwang JH, Li CW, Wu CW, Chen JH, Liu TC. Aging effects on the activation of the auditory cortex during binaural speech listening in white noise: an fMRI study. Audiol Neurootol. 2007;12:285–294. doi: 10.1159/000103209. [DOI] [PubMed] [Google Scholar]
- Jonides J, Marshuetz C, Smith EE, Reuter-Lorenz PA, Koeppe RA, Hartley A. Age differences in behavior and PET activation reveal differences in interference resolution in verbal working memory. J Cogn Neurosci. 2000;12(1):188–196. doi: 10.1162/089892900561823. [DOI] [PubMed] [Google Scholar]
- Kelly AMC, Garavan H. Human functional neuroimaging of brain changes associated with practice. Cerebral Cortex. 2005;15:1089–1102. doi: 10.1093/cercor/bhi005. [DOI] [PubMed] [Google Scholar]
- Langenecker SA, Nielson KA, Rao SM. fMRI of healthy older adults during Stroop interference. NeuroImage. 2004;21(1):192–200. doi: 10.1016/j.neuroimage.2003.08.027. [DOI] [PubMed] [Google Scholar]
- Li KZH, Lindenberger U. Relations between aging sensory/sensorimotor and cognitive functions. Neuroscience and Biobehavioral Reviews. 2002;26:777–783. doi: 10.1016/s0149-7634(02)00073-8. [DOI] [PubMed] [Google Scholar]
- Madden DJ, Whiting WL, Provenzale JM, Huettel SA. Age-related changes in neural activity during visual target detection measured by fMRI. Cereb Cortex. 2004;14(2):143–155. doi: 10.1093/cercor/bhg113. [DOI] [PubMed] [Google Scholar]
- Margulis EH, Mlsna LM, Uppunda AK, Parrish TB, Wong PCM. Selective Neurophysiologic Responses to Music in Instrumentalists with Different Listening Biographies. Human Brain Mapping. doi: 10.1002/hbm.20503. in press. [DOI] [PMC free article] [PubMed] [Google Scholar]
- Mazziotta J, Toga A, Evans A, Fox P, Lancaster J, Zilles K, et al. A probabilistic atlas and reference system for the human brain: International Consortium for Brain Mapping (ICBM) Philos Trans R Soc Lond B Biol Sci. 2001b;356(1412):1293–1322. doi: 10.1098/rstb.2001.0915. [DOI] [PMC free article] [PubMed] [Google Scholar]
- Mazziotta J, Toga A, Evans A, Fox P, Lancaster J, Zilles K, et al. A four-dimensional probabilistic atlas of the human brain. J Am Med Inform Assoc. 2001a;8(5):401–430. doi: 10.1136/jamia.2001.0080401. [DOI] [PMC free article] [PubMed] [Google Scholar]
- Mazziotta JC, Toga AW, Evans A, Fox P, Lancaster J. A probabilistic atlas of the human brain: theory and rationale for its development. The International Consortium for Brain Mapping (ICBM) Neuroimage. 1995;2(2):89–101. doi: 10.1006/nimg.1995.1012. [DOI] [PubMed] [Google Scholar]
- Oldfield RC. The assessment and analysis of handedness: The Edinburgh Inventory. Neuropsychologia. 1971;9:97–113. doi: 10.1016/0028-3932(71)90067-4. [DOI] [PubMed] [Google Scholar]
- Ostroff JM, McDonald KL, Schneider BA, Alain C. Aging and the processing of sound duration in human auditory cortex. Hearing Research. 2003;181:1–7. doi: 10.1016/s0378-5955(03)00113-8. [DOI] [PubMed] [Google Scholar]
- Poeppel D, Idsardi WJ, van Wassenhove V. Speech perception at the interface of neurobiology and linguistics. Philos Trans R Soc Lond B Biol Sci. 2008;363(1493):1071–1086. doi: 10.1098/rstb.2007.2160. [DOI] [PMC free article] [PubMed] [Google Scholar]
- Powers RE. Neurobiology of aging. In: Coffey C, Cummings J, editors. Textbook of Geriatric Neuropsychiatry. 2. Washington, DC: American Psychiatric Press; 2000. pp. 33–79. [Google Scholar]
- Rajan R, Cainer KE. Ageing without hearing loss or cognitive impairment causes a decrease in speech intelligibility only in informational maskers. Neuroscience. 2008;154:784–495. doi: 10.1016/j.neuroscience.2008.03.067. [DOI] [PubMed] [Google Scholar]
- Rypma B, Prabhakaran V, Desmond JE, Gabrieli JD. Age differences in prefrontal cortical activity in working memory. Psychology and Aging. 2001;16(3):371–384. doi: 10.1037//0882-7974.16.3.371. [DOI] [PubMed] [Google Scholar]
- Salvi RJ, Lockwood AH, Frisina RD, Coad ML, Wack DS, Frisina DR. PET imaging of the normal human auditory system: responses to speech in quiet and in background noise. Hearing Research. 2002;170(1–2):96–106. doi: 10.1016/s0378-5955(02)00386-6. [DOI] [PubMed] [Google Scholar]
- Scott SK, Rosen S, Wickham L, Wise RJ. A positron emission tomography study of the neural basis of informational and energetic masking effects in speech perception. J Acoust Soc Am. 2004;115(2):813–821. doi: 10.1121/1.1639336. [DOI] [PubMed] [Google Scholar]
- Sigalovsky IS, Melcher JR. Effects of sound level on fMRI activation in human brainstem, thalamic and cortical centers. Hearing Research. 2006;215:67–76. doi: 10.1016/j.heares.2006.03.002. [DOI] [PMC free article] [PubMed] [Google Scholar]
- Snyder JS, Alain C. Age-related changes in neural activity associated with concurrent vowel segregation. Cognitive Brain Research. 2005;24:492–499. doi: 10.1016/j.cogbrainres.2005.03.002. [DOI] [PubMed] [Google Scholar]
- Tice B, Carrell T. Tone. University of Nebraska; 1997. [Google Scholar]
- Walton J, Simon H, Frisina RD. Age-related alterations in the neural coding of envelope periodicities. Journal of Neurophysiology. 2002;88:565–578. doi: 10.1152/jn.2002.88.2.565. [DOI] [PubMed] [Google Scholar]
- Wong PC, Perrachione TK, Parrish TB. Neural characteristics of successful and less successful speech and word learning in adults. Hum Brain Mapp. 2007;28(10):995–1006. doi: 10.1002/hbm.20330. [DOI] [PMC free article] [PubMed] [Google Scholar]
- Wong PCM, Nusbaum HC, Small SL. Neural Bases of Talker Normalization. Journal of Cognitive Neuroscience. 2004;16:1173–1184. doi: 10.1162/0898929041920522. [DOI] [PubMed] [Google Scholar]
- Wong PCM, Perrachione TK. Learning pitch patterns in lexical identification by native English-speaking adults. Applied Psycholinguistics. 2007;28:565–585. [Google Scholar]
- Wong PCM, Uppunda AK, Parrish TB, Dhar S. Cortical mechanisms of speech perception in noise. J Speech Lang Hear Res. 2008;51(4):1026–1041. doi: 10.1044/1092-4388(2008/075). [DOI] [PubMed] [Google Scholar]
- Woodcock R, Johnson M. Woodcock-Johnson Psycho-Education Battery-3rd Edition: Tests of Cognitive Abilities. Itasca, IL: Riverside Publishing; 2001. [Google Scholar]