

Abstract
The μ-opioid receptor (OPRM1) is the principal receptor target for both endogenous and exogenous opioid analgesics. There are substantial individual differences in human responses to painful stimuli and to opiate drugs that are attributed to genetic variations in OPRM1. In searching for new functional variants, we employed comparative genome analysis and obtained evidence for the existence of an expanded human OPRM1 gene locus with new promoters, alternative exons and regulatory elements. Examination of polymorphisms within the human OPRM1 gene locus identified strong association between single nucleotide polymorphism (SNP) rs563649 and individual variations in pain perception. SNP rs563649 is located within a structurally conserved internal ribosome entry site (IRES) in the 5′-UTR of a novel exon 13-containing OPRM1 isoforms (MOR-1K) and affects both mRNA levels and translation efficiency of these variants. Furthermore, rs563649 exhibits very strong linkage disequilibrium throughout the entire OPRM1 gene locus and thus affects the functional contribution of the corresponding haplotype that includes other functional OPRM1 SNPs. Our results provide evidence for an essential role for MOR-1K isoforms in nociceptive signaling and suggest that genetic variations in alternative OPRM1 isoforms may contribute to individual differences in opiate responses.
INTRODUCTION
Opioid analgesics are the most widely used drugs to treat moderate to severe pain, yet in addition to profound analgesia, these agents also produce significant side-effects consisting of miosis, sedation, nausea and vomiting, cognitive impairment, constipation, rapid-onset hypotension and on occasion life-threatening respiratory depression (1–4). There is considerable inter-individual variability in the clinical response to opioid analgesics (5,6). For example, the minimal effective analgesic concentration for opioids, such as morphine, pethidine, alfentanil and sufentanil, varies among patients by factors of 5–10 (7–9). Furthermore, despite the fact that most clinically used opioids are selective for μ-opioid receptors (OPRM1), as defined by their selectivity in receptor-binding assays, patients may respond far better to one μ-opioid than another, both with respect to analgesic responsiveness and side-effects (10–12). As such, there is a substantial need to understand biological and genetic basis for inter-individual variability and develop new biological markers that will provide valid and reliable predictions of individual responses to opioid therapy.
Although environmental factors influence the responses to opioids, genetic background plays a significant role (13–16). OPRM1 is the major target of both endogenous and exogenous opiate and has been shown to mediate both baseline nociception and response to OPRM1 agonists (17,18). Both animal and human studies have indicated that reduced basal nociceptive sensitivity is associated with greater opioid analgesia (19–21) and suggested genetic polymorphisms in the human OPRM1 gene is the primary candidate source of clinically relevant variability in opiate sensitivity and baseline nociception (13–16).
An extensive search for functional OPRM1 polymorphisms has identified a few alternative loci with a relatively high allelic frequency, which can mediate a significant degree of the variable clinical effects observed in a population (reviewed in 16). These alternative loci were found in the promoter, coding and intron regions of the gene, which are associated with the diverse pharmacological and physiological effects mediated by OPRM1 stimulation. However, among SNPs with a relatively high reported allelic frequency, which can mediate a significant degree of the variable clinical effects observed in a population, only the A118G OPRM1 SNP (Asp40Asn) has been repeatedly shown to have functional consequences. This missense SNP changes the N-terminal region amino acid asparagine to aspartic acid, which decreases the number of sites for N-linked glycosylation of the MOR receptor from five to four, providing strong rational for association studies. Several studies have demonstrated a relationship between the frequencies of the A118G OPRM1 genomic polymorphisms and OPRM1-dependent phenotypes, including responses to opiates (22–25) and variations in pressure pain thresholds (26). However, only a small percentage of the variability of related phenotypes has been explained and conflicting and/or inconsistent results have been reported (27). Furthermore, investigations of the functional properties of the 40Asn variant have produced inconsistent results. First, the minor G allele has been reported to increase the affinity of OPRM1 receptor variant for β-endorphin by 3-fold in AV-12 cells and Xenopus oocytes (28). Other studies have shown no differences in agonist binding, functional coupling and internalization between transiently expressed receptor variants and wild-type receptors in COS and HEK293 cells (29,30). Additionally, even though the original findings demonstrated greater functional activity of the G allele receptor variant, a substantial reduction in the expression of the variant allele at both RNA levels in human autopsy brain tissues and RNA and protein levels in the stably transfected cell lines has also been reported (30,31). Collectively, our current understanding of the genetic basis for individual variations in opioids responses suggests a strong contribution of other untested variables that may include genetic variants outside of the OPRM1 locus or/and the existence of the other functional SNPs within the OPRM1 gene locus and possibly within other yet undiscovered functional elements of the gene.
There is a growing body of evidence from rodent studies that demonstrates an important role of alternatively spliced forms of OPRM1 in mediating opiate analgesia (32–34). The synergistic activities of these splice variants have been proposed to explain the complex pharmacology of μ-opioids (35). Still, it is unclear whether the findings from rodent studies are applicable to human opioid responses because of a striking discrepancy between the genomic organizations of the mouse and human OPRM1. According to the NCBI database, the mouse OPRM1 gene consists of 20 exons and codes for 39 alternative-spliced forms. In contrast, the human OPRM1 gene consists of only nine exons and codes for only 19 alternative-spliced forms (Unigene database).
Here we show that almost all of the known mouse exons have corresponding orthologs within the human OPRM1 gene locus and can be subject to genetic variability, which modifies receptor function and associated phenotypes. Association analysis of human allelic variations within these new exons with quantitative measures of pain sensitivity and responses to morphine identified a novel and potentially functional SNPs in the human OPRM1 gene. Furthermore, we cloned new human MOR-1K isoforms that carry SNP rs563649, which is strongly associated with pain-sensitivity phenotypes. We demonstrated that SNP rs563649 is located within a structurally conserved internal ribosome entry site (IRES) in the 5′-UTR of these novel isoforms and affects translational efficiency of these variants. Our results substantially extend our knowledge of the OPRM1 gene locus and introduce new targets for the development of genetic markers, which may lead to individualized opioid-based therapies.
RESULTS
Gene architecture of the human OPRM1
To identify human orthologs of mouse OPRM1 exons, we confirmed the synteny within the full-length sequences of the human and mouse OPRM1 genes and analyzed patterns of similarity in inter-species comparisons using detailed pairwise alignments (36). We used mRNA sequences of known alternatively spliced isoforms of mouse OPRM1 and GenBank annotations to refine locations of the initial and terminal exons and to identify unknown human orthologous exons (37). In addition, we performed an extensive search for regulatory sites, structural elements and splicing signals (38–42) to reveal putative sites of initiation and termination of transcription and to refine exon/intron boundaries.
Results of our analysis suggest that most exons of the OPRM1 gene annotated in the mouse also exist in primates (Fig. 1A). Our results also predict new exon–intron boundaries (see Fig. 1B for exon 13 example), an alternative transcription start site and conserved promoter (43,44) upstream from the predicted primate exon 11 with conserved putative transcription factor binding sites in primates and rodents (Supplementary Material, Fig. S1). These data support the existence of a larger and more complex human OPRM1 gene (Fig. 1).
Figure 1.

The structure of the human and mouse OPRM1 gene. (A) Conventional structures of the mouse (upper panel) and human (middle panel) OPRM1 genes are shown in accordance with the NCBI database, UCSC genome browser and published data (43,76,77). Our version of the structure of the human OPRM1 gene (lower panel) is based on multispecies genome alignments created by OWEN (36) and comparative genomes analysis. Exons and introns are shown by vertical and horizontal boxes, respectively. Shaded boxes represent constitutive exons. Maximal sizes of human exons (for lower panel) are shown in parentheses (nt): exon 11 (206), exon 1 (580), exon T (117), exon 14 (105), exon 13 (1200), exon 2 (353), exon 3 (521), exon R (488), exon Y (109), exon 16 (314), exon X (1271), exon 17 (128), exon 5 (1013), exon 4 (304), exon 18 (412), exon 6 (124), exon 7 (89), exon 9 (393). (B) Alignment of human (1), chimpanzee (2), macaca (3), rat (4) and mouse (5) exon 13 and its conserved vicinity regions. Splicing boundaries are indicated by vertical bars. Enhancers of splicing (39) near exon–intron boundaries are marked in yellow. SNP rs563649 is highlighted in red. Conserved nucleotides for all species are marked by stars. Structurally conserved IRES in the human sequence is marked by green. Predicted uORFs in the human sequence are marked by arrows.
To delineate the exact boundaries of the newly identified human exons, pairwise comparisons and evolutionary rate estimation were performed for different functional domains of the gene using OWEN alignments (19). Evolutionary divergence was estimated in separate pairwise alignments for different functional domains of the OPRM1 gene (Ks, Ka, Ku for exons and Ki for introns) for closely related rodent (mouse and rat) and primate (human and macaca) species, and for distantly related species (human and mouse). Both flanking (50 nucleotides) and core regions of functional domains were considered (Table 1). The analysis revealed significant selective pressure associated with exonic regions and their vicinities further supporting the existence of the expanded human OPRM1 gene locus, which is ∼90 kb longer than was thought previously. Analysis of evolutionary divergence and conservation of regulatory splicing sites suggest that some of the new exons in primates are extended or shortened relative to rodent exons. These data are consistent with the generally low conservation of exonic boundaries in alternative splicing patterns in the human and mouse genomes (45).
Table 1.
Divergence in exons and introns of rodent and primate OPRM1 genes*
| CDSs/UTRs |
Upstream intron |
Downstream intron |
||||
|---|---|---|---|---|---|---|
| Ka | Ks or Ku | 3′_50 | Central | 5′_50 | Central | |
| Mouse–rat | ||||||
| Exon 11 | — | 0.116 | — | — | 0.131 | 0.199 |
| Exon 1 | 0.031 | 0.118 | 0.110 | 0.173 | 0.114 | 0.136 |
| Exon 13 | — | 0.146 | 0.109 | 0.177 | 0.063 | 0.171 |
| Exon 2 | 0.004 | 0.317 | 0.134 | 0.171 | 0.041 | 0.129 |
| Exon 3 | 0.005 | 0.316 | 0.131 | 0.129 | 0.185 | 0.173 |
| Exon 18 | 0.079a | 0.176/0.113a | 0.161 | 0.187 | 0.087 | 0.165 |
| Human–Macaca | ||||||
| Exon 11 | — | 0.040 | — | — | — | 0.068 |
| Exon 1 | 0.014 | 0.014 | 0.020 | 0.068 | 0.064 | 0.062 |
| Exon 13 | — | 0.071 | 0.109 | 0.064 | 0.064 | 0.074 |
| Exon 2 | 0.004 | 0.051 | 0.085 | 0.074 | 0.041 | 0.057 |
| Exon 3 | 0.005 | 0.069 | 0.042 | 0.057 | 0.054 | |
| Exon 18 | — | 0.063 | 0.041 | 0.069 | 0.020 | 0.065 |
| Mouse–human | ||||||
| Exon 11 | — | 0.378 | — | — | 0.458 | 0.632 |
| Exon 1 | 0.100 | 0.465 | 0.218 | 0.632 | 0.579 | 0.773 |
| Exon 13 | — | 0.433 | 0.352 | 0.502 | 0.667 | 0.608 |
| Exon 2 | 0.007 | 0.563 | 0.517 | 0.608 | 0.420 | 0.481 |
| Exon 3 | 0.011 | 0.903 | 0.240 | 0.481 | 0.574 | 0.530 |
| Exon 18 | — | 0.847 | 0.134 | 0.535 | 0.383 | 0.579 |
Evolutionary rates at non-synonymous (Ka) and synonymous (Ks) sites were calculated for coding exons by PAML (69). Evolutionary rates at non-coding exons (Ku) and for intronic sequences (Ki) were calculated using Kimura’s two-parameter model (70). The Ki values for central parts and for the end 50 nucleotide regions (3′_50 and 5′_50) of introns were calculated separately, because ∼50 nucleotide sequences at each end of an intron are thought to be subject to weak purifying selection that stems from the involvement of these sequences in splicing (39,78).
aFor partially coding exons, Ka and Ks were calculated for cording parts and Ku was calculated for non-coding sequences.
Association analysis between selected SNPs and pain sensitivity
Having established the areas of exonic conservation within the OPRM1 gene locus, we selected a set of 30 candidate SNPs that potentially cover the functional allelic diversity of the gene, with an emphasis on the newly identified exons and promoter regions. Genotyping data were collected from 196 healthy Caucasian female volunteers, characterized for their sensitivity to noxious stimuli by calculating a summary pain-sensitivity score. From the examined 30 SNPs, five (rs1323040, rs7775848, rs1799972, rs1042753 and 12205732) were found to be monomorphic. The remaining 25 SNPs were analyzed. All markers were found to conform to Hardy–Weinberg equilibrium, with the exception of the rs1294094 and rs6912029, which were removed from the association analysis (Table 2).
Table 2.
Candidate polymorphism in OPRM1 gene locus
| Number | NSBI SNP ID | Variation | SNP locationa | Specific for mouse OPRM1 slice variant | Specific for human OPRM1 slice variant | Potential functional significanceb | Minor allele frequency |
|---|---|---|---|---|---|---|---|
| 1 | rs1319339 | T > C | 5′ intragenic | mMOR-1G-N | N/A | 700 nt upstream of conservation for exon 11 | 0.16 |
| 2 | rs7776341 | A > C | 5′ intragenic | mMOR-1J | N/A | Within human analog of mouse exon 12 | 0.042 |
| 3 | rs1074287 | A > G | 5′ intragenic | mMOR-1J | N/A | Within human analog of mouse exon 12 | 0.264 |
| 4 | rs1799971 | Asp40Ans A > G | First exon | all exc mMOR1-K-L | all exp mu3 | Non-synonymous | 0.131 |
| 5 | rs524731 | C > A | First intron | 0.17 | |||
| 6 | rs495491 | A > G | First intron | 0.267 | |||
| 7 | rs1381376 | C > T | First intron | 0.174 | |||
| 8 | rs3798678 | A > G | First intron | mMOR1-L | N/A | Within human analog of mouse exon 14 | 0.16 |
| 9 | rs563649 | C > T | First intron | mMOR1-K | hMOR1-K1, hMOR1-K2 | Within extended human analog of mouse exon 13 | 0.078 |
| 10 | rs9322446 | G > A | First intron | mMOR1-K | N/A | Within human analog of mouse exon 13 | 0.169 |
| 11 | rs2075572 | G > C | Second intron | 0.386 | |||
| 12 | rs533586 | T > C | Third intron | mMOR1-E-F | N/A | 0.238 | |
| 13 | rs540825 | His464Gln A > T | Exon X | N/A | hMOR1-X | Non-synonymous | 0.238 |
| 14 | rs675026 | Gly503Gly G > A | Exon X | N/A | hMOR1-X | Synonymous | 0.341 |
| 15 | rs660756 | T > G | Exon Y | mMOR1-C,F,M,N,S | hMOR1-Y | 3′-UTR | 0.352 |
| 16 | rs677830 | stop388Gln C > T | Exon 5 | mMOR1-B | hMOR-1B | Non-synonymous | 0.236 |
| 17 | rs650245 | G > A | Exon 5 | mMOR1-B | hMOR-1B | 3′-UTR | 0.103 |
| 18 | rs623956 | A > G | Exon 5 | mMOR1-B | hMOR-1B | 3′-UTR | 0.414 |
| 19 | rs609148 | G > A | Exon 5 | mMOR1-B | hMOR-1B,Y | 3′-UTR | 0.233 |
| 20 | rs497332 | C > G | Exon 5 | mMOR1-B | hMOR-1B,Y | 3′-UTR | 0.089 |
| 21 | rs648893 | A > G | Third intron | 0.229 | |||
| 22 | rs7759388 | G > A | Exon 7 | mMOR1-C,E,F,M,O,Q | hMOR-1O | 20 nt upstream of exon O | 0.141 |
| 23 | rs9322453 | G > C | Exon 7 | mMOR1-C,E,F,M,O,Q | hMOR-1O | 150 nt downstream of exon O | 0.402 |
aIn accordance with current NCBI human OPRM1 locus.
bIn accordance with our prediction of extended OPRM1 locus.
The pain-sensitivity score was calculated as follows. Each participant in the analyzed cohort was quantified for responsiveness to a number of noxious modalities (thermal, mechanical and ischemic) applied to various anatomical sites (46,47). Because opioids such as morphine modify the perceptual responses to all of the assessed noxious modalities (48–51), we derived a unitary quantitative measure of pain sensitivity for the quantitative analyses. To accomplish this, each of 16 measures of pain sensitivity was normalized to a mean of zero and standard deviation of one, producing a unit normal deviate (z-score) for each test procedure. A sum of these 16 scores produced a normalized single score of pain sensitivity (summary z-score) for each individual (see Supplementary Material for details). We thus hypothesized that population variations in the constructed global measures of pain sensitivity would be associated with functional genetic polymorphisms in OPRM1.
The relationships between OPRM1 genetic variants and pain scores were first examined using overall tests for haplotypic associations with the composite haplotype method (CHM) (52) in sliding windows of one to 12 SNPs (Table 3). The CHM is designed for determining associations due to multiple interacting SNPs and is applicable regardless of the linkage disequilibrium (LD) between the tested SNPs. CHM is a flexible extension of our earlier approach, termed the haplotype trend regression (HTR) (53). The difference between the two approaches lies in that the HTR considers joint frequencies of alleles that reside on the same haplotype, whereas the CHM considers the sum of joint frequencies that reside on the same as well as on two different haplotypes within individuals. Thus, the CHM is readily applicable to sets of SNPs that span separate haplotype blocks. Moreover, while the CHM can be used to detect haplotypic effects, it is also able to capture epistatic effects due to interactions between two haplotypes in a diplotype. We conducted two types of haplotype association analysis. ‘Overall’ CHM tests in sliding windows of varying size provide a single P-value for a set of SNPs in a given window. Next, given the overall significance, tests for individual haplotypes were conducted to determine specific haplotypes to which the overall association was due. The individual tests were carried out using the CHM as well as a likelihood-based haplotype association method by Shibata et al. (54,55). To make a comparison of the overall CHM tests with the HTR, we replicated the analysis using the HTR. The CHM appeared to have provided greater evidence of association, which is possibly due to non-additive epistatic interactions (data not shown).
Table 3.
P-values of the association between 23 OPRM1 SNPs and pain scores
| Mar-ker no. | NSBI SNP Id | SNP location | sw1 | sw2 | sw3 | sw4 | sw5 | sw6 | sw7 | sw8 | sw9 | sw10 | sw11 | sw12 |
|---|---|---|---|---|---|---|---|---|---|---|---|---|---|---|
| 1 | rs1319339 | 700 nt upstream of conservation for exon 11 | 0.0984 | 0.1651 | 0.3228 | 0.5066 | 0.3036 | 0.4252 | 0.1758 | 0.1077 | 0.0722 | 0.0211 | 0.0059 | 0.0111 |
| 2 | rs7776341 | Within human ortholog of mouse exon 12th | 0.3297 | 0.3512 | 0.5331 | 0.4185 | 0.4960 | 0.1421 | 0.0695 | 0.0609 | 0.0239 | 0.0190 | 0.0057 | 0.0050 |
| 3 | rs1074287 | In human ortholog of mouse exon 12th | 0.2038 | 0.3817 | 0.3682 | 0.6145 | 0.2332 | 0.1182 | 0.1322 | 0.0490 | 0.0212 | 0.0056 | 0.0075 | 0.0124 |
| 4 | rs1799971 | Exon 1, non-synonymous | 0.4577 | 0.6893 | 0.5157 | 0.2327 | 0.0936 | 0.1175 | 0.0529 | 0.0473 | 0.0029 | 0.0078 | 0.0081 | 0.0101 |
| 5 | rs524731 | 0.5582 | 0.6553 | 0.0926 | 0.0302 | 0.0563 | 0.0571 | 0.0826 | 0.0090 | 0.0086 | 0.0119 | 0.0558 | 0.0872 | |
| 6 | rs495491 | 0.2120 | 0.0246 | 0.0107 | 0.0249 | 0.0307 | 0.0463 | 0.0004 | 0.0057 | 0.0050 | 0.0256 | 0.0196 | 0.0130 | |
| 7 | rs1381376 | 0.2787 | 0.4471 | 0.0025 | 0.0189 | 0.1155 | 0.0036 | 0.0057 | 0.0064 | 0.0061 | 0.0061 | 0.0033 | 0.0058 | |
| 8 | rs3798678 | Within human ortholog of mouse exon 14th | 0.3433 | 0.0028 | 0.0045 | 0.0455 | 0.0125 | 0.0050 | 0.0057 | 0.0139 | 0.0057 | 0.0033 | 0.0038 | 0.0034 |
| 9 | rs563649 | In human ortholog of mouse exon 13th | 0.0007 | 0.0018 | 0.0083 | 0.0053 | 0.0080 | 0.0065 | 0.0126 | 0.0084 | 0.0021 | 0.0024 | 0.0014 | 0.0022 |
| 10 | rs9322446 | Within human ortholog of mouse exon 13th | 0.0941 | 0.1515 | 0.0036 | 0.0058 | 0.0066 | 0.0057 | 0.0044 | 0.0029 | 0.0034 | 0.0009 | 0.0013 | 0.0099 |
| 11 | rs2075572 | 0.2957 | 0.0007 | 0.0005 | 0.0013 | 0.0019 | 0.0024 | 0.0010 | 0.0013 | 0.0003 | 0.0005 | 0.0068 | 0.0269 | |
| 12 | rs533586 | 0.7037 | 0.9993 | 0.5884 | 0.5452 | 0.5848 | 0.8374 | 0.9692 | 0.2263 | 0.3518 | 0.9986 | 0.4128 | 0.9421 | |
| 13 | rs540825 | Exon X, non-synonymous | 0.8171 | 0.9956 | 0.4866 | 0.5395 | 0.9051 | 0.9633 | 0.2268 | 0.3038 | 0.2340 | 0.0839 | 0.7335 | |
| 14 | rs675026 | Exon X, synonymous | 0.8012 | 0.4568 | 0.5673 | 0.5888 | 0.8847 | 0.5151 | 0.4278 | 0.4571 | 0.1147 | 0.8005 | ||
| 15 | rs660756 | Exon Y, 3′-UTR | 0.5745 | 0.9027 | 0.5625 | 0.8062 | 0.9616 | 0.9239 | 0.3289 | 0.0853 | 0.3573 | |||
| 16 | rs677830 | Exon 5, non-synonymous | 0.9891 | 0.7803 | 0.8374 | 0.9662 | 0.9242 | 0.9131 | 0.3746 | 0.8369 | ||||
| 17 | rs650245 | Exon 5, 3′-UTR | 0.3723 | 0.7961 | 0.9525 | 0.8791 | 0.3508 | 0.3916 | 0.7837 | |||||
| 18 | rs623956 | Exon 5, 3′-UTR | 0.8308 | 0.9267 | 0.9286 | 0.9808 | 0.4276 | 0.4391 | ||||||
| 19 | rs609148 | Exon 5, 3′-UTR | 0.8208 | 0.6893 | 0.9664 | 0.2838 | 0.5825 | |||||||
| 20 | rs497332 | Exon, 3′-UTR | 0.3139 | 0.7817 | 0.1362 | 0.3025 | ||||||||
| 21 | rs648893 | 0.5043 | 0.4306 | 0.6341 | ||||||||||
| 22 | rs7759388 | 20 nt before exon O | 0.5425 | 0.7773 | ||||||||||
| 23 | rs9322453 | 150 nt after exon O | 0.9195 |
sw, sliding window; P-value reflects associations between pain phenotype and haplotype that starts from the indicated SNP within the corresponding window size. Values marked in italic represent the potential effect of SNP rs563649. For example, P = 0.0722 marked in italic in the first row represents a 9-SNP haplotype that includes rs563649 as its ninth SNP. Similarly, values marked in bold represent potential combined effects of SNPs rs2075572 and rs533586; and values marked in italic and bold represent potential effects of both functional sites—SNPs rs563649 and rs2075572–rs533586. The association has replicated in all of the fixed-size windows (Supplementary Material, Fig.1S). Even though the tests in the sliding windows of different sizes are not independent, the association results were consistent across all graphs, reinforcing the evidence for association in the region.
Statistically significant association was found between the pain-sensitivity score and SNP rs563649 in the sliding window of size 1 (SW1), where the CHM becomes an allelic trend test (P = 0.0007). When SW2 was applied, three significant associations were observed (Table 3). The associations of the pain score with the haplotypes rs3798678–rs563649 (P = 0.0028) and rs563649–rs9322446 (P = 0.0018) most likely reflect the effect of SNP rs563649 identified with SW1. Significant associations of the pain score with the haplotype rs2075572–rs533586 (P = 0.0007) identified a new potentially functional genetic variant of OPRM1. In each of the following SW approaches, associations between the pain score and haplotypes were significant for each haplotype containing SNPs rs563649, or haplotype rs2075572–rs533586, or both. The associations for haplotypes starting with either SNP rs563649 or SNP rs2075572 remained significant after the Bonferroni correction for multiple testing within each window size (P = 0.0022 for the highest number of tests for SW1 (Supplementary Material, Fig. S2).
Association analysis in the second cohort
The association between pain responses and SNP rs563649 was tested in an independent cohort of healthy Caucasian subjects recruited at the University of Florida. Because of the smaller cohort size (n = 133) and necessity to control for gender in this cohort, limited genetic analyses were conducted. Only SNP rs563649 was chosen for an exploratory analysis because it exhibits the strongest individual contribution to the associations and can be considered as a marker of a functional haplotype. Analysis of covariance was used to examine the association of the rs563649 SNP with the summed z-pain scores. This analysis determined whether summed pain scores for individuals with one or two copies of minor alleles (n = 21) differed from those of individual homozygous for the major allele (n = 112), after controlling for age and gender. In agreement with association in the first cohort, the minor allele group had higher z-scores than the major allele group [0.63 (1.19) versus −0.95 (0.52)], (Supplementary Material, Table S2), although this difference did not reach statistical significance.
Furthermore, in a subset (n = 68) of this cohort, the analgesic effect of morphine on experimental pain sensitivity was assessed, which allowed us to examine associations between OPRM1 SNPs and µ-opioid analgesia. Subjects reported ischemic pain threshold, and then at 1 min intervals, subjects rated the intensity and unpleasantness of ischemic arm pain, induced via the submaximal effort tourniquet procedure, before and after the intravenous administration of 0.08 mg/kg of intravenous morphine. The submaximal effort tourniquet procedure was chosen for analgesic assessment because it is among the most sensitive to OPRM1-mediated analgesia (56) when compared with other experimental pain assays. First, the difference in ischemic threshold before and after drug administration was assessed. Then, as described previously (50), summed scores for ratings of pain intensity and unpleasantness across the duration of the tourniquet procedure were computed before and after drug administration. Change scores for summed pain intensity ratings were computed by subtracting the post-drug summed score from the pre-drug summed score, such that larger values indicate a greater reduction in pain following morphine administration, thus greater analgesia. Subjects with one or two rare alleles T of rs563649 showed less analgesia than homozygotes for the major allele C, with P-values approaching statistical significance, ranging from 0.054 to 0.09 (Supplementary Material, Table S2).
The direction of effects was the same for both cohorts and the effect sizes was quite similar for basal pain sensitivity, although the association results in the second cohort did not reach significance. Furthermore, carriers of the minor T allele showed poor responses to morphine, consistent with higher sensitivity to pain demonstrated by these subjects and further suggesting functional significance of SNP rs563649.
Reconstruction of functional haplotypes
We then hypothesized that different SNPs may belong to the same functional haplotype associated with increased pain sensitivity. The analysis of the constructed LD matrix using the Haploview program showed that the 23 analyzed SNPs were located in two separate haplotype blocks (Supplementary Material, Fig. S3). SNPs rs7776341–rs3798678 are in Block I and SNPs rs563649–rs497332 are in Block II, which is consistent with previously published reports (57). rs563649 (C/T) is situated on the border of two haploblocks, displaying very high LD with SNPs in both haploblocks (Supplementary Material, Fig. S3).
We first evaluated the haplotypes containing SNPs rs563649 (C/T), rs2075572 (G/C) and rs533586 (C/T), which appear to be the minimal functional units. The sampling LD values between these SNPs can be determined directly from the haplotype frequencies, which were estimated with the expectation-maximization (EM) algorithm, and are given in Table 4. The three D′ values in this case are all very high (0.8, 1, −0.92) (Supplementary Material, Fig. S3). The haplotype T-C-T in this 3-loci set was significantly associated with pain sensitivity, as shown by a conservative P-value estimate calculated under different models (52) (Table 4). This haplotype was associated with significantly higher pain ratings (z = 4.83) and was observed in ∼6% of the subjects. We next examined whether SNPs within the OPRM1 gene locus, which have been previously reported to be associated with pain, analgesia or other pain-related phenotypes, are related to the pain-sensitivity haplotype established by our analysis. SNP rs1799971 (A118G) has been repeatedly shown to produce functional effects. Carriers of the minor 118G allele show decreased analgesic responses to morphine and M6G (22–25) and significantly higher pressure pain thresholds (26). In our dataset, homozygotes for the G allele tended to have the lower mean pain scores, whereas homozygotes for the A allele tended to have the higher mean pain scores (data not shown), but this difference did not achieve significance. We also considered rs495491, which has been associated with pain-related mood scores (58), and rs609148, which along with rs495491 has been shown to be associated with substance dependence, including opioid dependence (57). We evaluated the 6-loci haplotypes consisting of the three core SNPs established by our analysis and three SNPs described in the literature: rs1799971 (A/G), rs495491 (A/G), rs563649 (C/T), rs2075572 (G/C), rs533586 (C/T) and rs609148 (G/A). The D′ values between rs563649 and this set of SNPs are also very high (1, 1, 0.81, 1, 1, 1) (Supplementary Material, Fig. S3). The 6-loci haplotype A-G-T-C-T-G was also found to be significantly associated with higher pain scores (z = 4.83) and was also observed in 6% of the subjects (Table 4). Importantly, the most significant haplotypic test in Table 4 is flagged by both the EM-based method and the CHM.
Table 4.
Results for the haplotype association tests
| Haplotype | Frequencya | Meanb | P-values (EM; dominantc) | P-values (EM; diplotypec) | P-values (EM; additivec) | P-values (CHM) |
|---|---|---|---|---|---|---|
| Three loci haplotypesd | ||||||
| T-C-T | 0.0618 | 4.8352 | 0.0091412 | 0.0015397 | 0.0019992 | 0.000434 |
| T-G-T | 0.0086 | 9.1966 | 0.063606 | 0.17987 | 0.06579 | 0.003562 |
| C-C-T | 0.0029 | 11.4524 | 0.17837 | 0.40429 | 0.17976 | 0.01999 |
| C-C-C | 0.3036 | −0.2021 | 0.76821 | 0.41499 | 0.3979 | 0.317572 |
| C-G-T | 0.6077 | 0.1275 | 0.66807 | 0.011332 | 0.10761 | 0.038788 |
| C-G-C | 0.0154 | 6.491 | 0.072587 | 0.19909 | 0.0760661 | 0.155424 |
| Overall P-value (CHM): 0.00085 | ||||||
| Six loci haplotypese | ||||||
| A-A-C-G-T-G | 0.3933 | −0.1934 | 0.69931 | 0.70015 | 0.4836 | 0.142904 |
| A-A-C-C-C-A | 0.2117 | −0.1473 | 0.86488 | 0.89225 | 0.99428 | 0.772462 |
| G-A-C-G-T-G | 0.1413 | −0.7922 | 0.45275 | 0.74980 | 0.4836 | 0.208048 |
| A-G-C-C-C-G | 0.0709 | −0.9320 | 0.57531 | 0.85486 | 0.8878 | 0.66288 |
| A-G-C-G-T-G | 0.0700 | −0.8657 | 0.61306 | 0.27691 | 0.4191 | 0.467318 |
| A-G-T-C-T-G | 0.0620 | 4.8228 | 0.0092318 | 0.0015490 | 0.0020254 | 0.000724 |
| A-G-C-C-C-A | 0.0138 | −2.5697 | 0.49803 | 0.79497 | 0.9430 | 0.196706 |
| A-A-C-G-C-A | 0.0123 | 6.6722 | 0.099676 | 0.25788 | 0.8648 | 0.1029 |
| A-G-T-G-T-G | 0.0087 | 9.0049 | 0.066064 | 0.18471 | 0.8711 | 0.013182 |
| A-G-C-G-C-G | 0.0062 | 1.5232 | 0.77968 | 0.96253 | 0.9851 | 0.391084 |
| A-A-C-C-C-G | 0.0059 | −14.462 | 0.016594 | 0.056738 | 0.86036 | 0.091284 |
| A-A-C-C-T-G | 0.0030 | 11.2606 | 0.18682 | 0.41846 | 0.1881 | 0.128432 |
| G-G-C-G-C-G | 0.0007 | 4.0258 | 0.75442 | 0.95227 | 0.9936 | 0.794988 |
| Overall P-value (CHM): 0.005692 | ||||||
aFrequency, sample haplotype frequency.
bMean, the estimated mean effect value for the presence of one or two copies of a given haplotype.
cDominant, diplotype, additive, haplotype analysis models.
drs563649, rs2075572 and rs533586.
ers1799971, rs495491, rs563649, rs2075572, rs533586 and rs609148.
Identification of human MOR-1K isoforms
To identify molecular biological mechanisms whereby associated SNPs may affect OPRM1 function, we first examined its position relative to newly identified OPRM1 structural elements. SNP rs563649, the strongest contributor to the pain-sensitivity phenotype, was located in the evolutionarily conserved footprint of the OPRM1 gene downstream from the predicted human exon 13, which is not represented in known human and mouse transcripts. Comparative sequence analysis showed the absence of conserved 3′-splicing sites and intronic/exonic enhancers in the vicinity of predicted human exon 13 region, suggesting that rs563649 may be situated within a novel human exon that extends downstream in primate lineages relative to rodents (Fig. 1B, Table 1). To test this hypothesis, we performed RT–PCR using RNA isolated from the human brain tissues (Supplementary Material, Table S3), which express high levels of OPRM1 and are known to respond to opioid treatment. The forward primers were designed to predicted exon 13 and reverse primers to exon 2 (Fig. 2A–C; Supplementary Material, Table S4). RT–PCR results showed that the human exon 13 is ∼0.8 kb longer than the mouse exon 13 and carries alternative acceptor sites of splicing (Supplementary Material, Fig. S4) similar to OPRM1 exons 1, 3 and 5 (35,43). The sequencing results of the RT–PCR product amplified from the frontal lobe, nucleus accumbens, medulla oblongata and spinal cord identified a 5′-UTR and a partial coding region of novel OPRM1 splicing isoforms, MOR-1K1 and MOR-1K2 (GenBank accession nos EU362990 and EU360599). A longer MOR-1K1 variant is preferentially expressed in the medulla oblongata, while a shorter MOR-1K2 variant preferentially expressed in the spinal cord. Both these variants are present in the frontal lobe and in nucleus accumbens (Supplementary Material, Table S5). We found no evidence of the expression of an isoform containing a short exon 13 in humans or an isoform with a long exon 13 in mouse.
Figure 2.

Expression pattern of exon 13 containing OPRM1 gene splice variant in human and mouse. (A) The schematic diagram illustrates relative positions of PCR primers designed to amplify the new alternative MOR-1K variants in mouse and human. The arrow indicates the relative position of SNP rs563649. (B) RT–PCR was performed on total RNA samples from the human brain regions known to express OPRM1 with hU2 and hL5 primers specific for exons 13 and exon 2, respectively. The exon 13 containing OPRM1 gene splice variant MOR-1K was detected in CNS but not in peripheral leukocytes even after a secondary PCR round with nested PCR primers. The PCR product size was 1229 nt, which was three times longer than the predicted 385 nt based on homology with the mouse genome. (C) RT–PCR analysis of mouse spinal cord with primer pairs mU2-mL3 and mU2-mL1 yielded PCR products of predicted size. A longer mouse isoform orthologous to human exon 13 was below the level of detection even by secondary PCR with the nested PCR primers mU3-mL3, mU3-mL1 or mU3-mL2. (D) The schematic diagram illustrates the exonic composition and relative positions of PCR primers designed to amplify the major MOR-1 variant and the newly identified alternative MOR-1K variant. The arrows indicate relative positions of translation initiation start codons and stop codons. (E) The predicted protein structure of MOR-1 and MOR-1K isoforms. Translation of the MOR-1K variants results in a 6 transmembrane domain (6TM) receptor, truncated at the N-terminus. (F) RT–PCR results demonstrate the relative expression pattern of human MOR-1 (primers hU1-L3) and MOR-1K (primers hU5-L3) variants. GAP3DH was used as a control for cDNA loading. All major PCR products shown in this figure were sequenced and aligned with human or mouse genomes.
To establish the complete coding region of MOR-1K isoforms, we performed RT–PCR reactions with the forward primer situated at exon 13 and reverse primers located at exons 4, 7, 8 or X. Only the form containing exons 13, 2, 3 and 4 was amplified (Fig. 2D), consistent with the mouse MOR-1K form (43). Again, consistent with the mouse MOR-1K, translation of these new isoforms seems to be initiated at the first AUG in exon 2, as all upstream reading frames code for short peptides. Consequently, both human MOR-1K1 and MOR-1K2 isoforms encode a truncated version of OPRM1 that lacks an extracellular N-terminal domain and transmembrane domain I. To identify the transcriptional start site of MOR-1K isoforms, we performed 5′RACE PCR. The 5′ start site has been mapped to a novel OPMR1 promoter region that is located upstream of exon 13 (Supplementary Material, Fig. S5), unlike the mouse MOR-1K isoform where transcription is initiated from an alternative promoter upstream to exon 11 (43).
Effect of rs563649 on MOR-1K expression
To understand how SNP rs563649 can affect the expression or function of the MOR-1K isoforms, we searched for functional regulatory elements within the 5′-UTR of MOR-1K transcripts. We found that this functional variation is located within a structurally conserved IRES in the 5′-UTR of MOR-1K transcripts (Fig. 3A). This IRES is conserved in human and chimpanzee, but absent in rodents. Stems II and III in IRESs can participate in coaxial stacking within a common Y-type structure and are likely required for ribosome binding to IRES (41). Nucleotides in loops II and III may interact with each other (‘kissing hairpins’) or with ribosomal proteins, which can result in altered binding of ribosome to IRES and, consequently, affect translation through a ‘zipper’ mechanism (41). It has been shown that precise secondary structure is important for the function of IRESs. A single nucleotide substitution producing structural changes in the c-myc IRES resulted in increased translation initiation by internal ribosome entry and was associated with oncogenesis (59). SNP rs563649 is located in the IRES loop II, where the major allele C likely allows a better base pairing between loops II and III (AAC:GUU) than the minor allele T (AAU:GUU) (Fig. 3A). To examine effects of rs563649 allelic variants on translation efficiency, we transiently transfected human neuroblastoma BE2C cells with reporter constructs that carried allelic variants of MOR-1K IRES inserted between transcription and translation start sites (Fig. 3B). Similar to the published report (59), the T allelic variant of MOR-1K IRES showed significantly higher translational activity than the C allelic variant (Fig. 3). As the T allelic variant also produced lower mRNA levels (Fig. 3C), these results suggest reciprocal allelic regulation of MOR-1K at the RNA and protein levels, where the T allele leads to increased translational activity, through the increased ribosome binding and the C allele provides higher RNA levels, probably due to decreased accessibility for nucleases.
Figure 3.

Allelic variants of structurally conserved IRES in exon 13 of human OPRM1. (A) The local stem-loop structure associated with putative IRES within the 5′-UTR of OPRM-1K isoform. The major allele C of SNP rs563649 is shown in red. Translation start codon of downstream uORF is shown in blue. (B) A cloning of putative IRES allelic variants into secreted alkaline phoshatase (SEAP) reporter vector and associated translation detection experiments. (C and D) The expression of IRES-SEAP constructs transiently transfected into human neuroblastoma BE2C cells. Relative mRNA (C) and SEAP activity (D) levels were measured 8, 24 and 48 h after transfection. Reporter construct with the T allele showed significantly higher SEAP activity than reporter construct with the C allele, although mRNA levels of construct with the C allele were significantly higher than those with the T allele (P < 0.05, n = 4), suggesting higher translation activity of the IRES T allelic variant.
DISCUSSION
In this study, we performed an extensive search for functional SNPs within the OPRM1 gene locus and made several fundamental observations. First, we identified several novel and potentially functional SNPs. Particularly, a novel SNP rs563649, which is situated within the newly identified exon 13, was the strongest independent contributor to measured pain-sensitivity responses (Table 3). In contrast to SNP rs563649, the SNPs that have been previously associated with OPRM1-dependent phenotypes displayed rather modest effects. Specifically, the non-synonymous SNP variant A118G (Asp40Asn), which has been shown to be associated with human pressure pain thresholds (26), showed much smaller differences. In agreement with previous findings, in our cohorts homozygotes for the G allele displayed the highest mean values for mechanical pain thresholds, whereas homozygotes for the A allele displayed the lowest mean values for mechanical pain thresholds; however, this difference did not reach significance (data not shown). Importantly, the previously published association achieved statistical significance only among males (26), whereas our cohort tested for experimental pressure pain consisted of females only.
Further, we have identified a potentially functional haplotype associated with high pain sensitivity (Table 4), which is tagged by the minor allele T of rs563649. The frequency of this haplotype corresponded to the frequency of the minor T allele and the SNP rs563649 was the strongest individual contributor to the association, suggesting that the minor T allele of this newly identified SNP is a strong candidate for the functional site of the haplotype. This haplotype spans over the OPRM1 gene locus and consists of all the alleles that have previously been shown to be associated with lower pain thresholds (rs1799971, A allele) (26), negative mood (rs495491, G allele) (58) and increased substance dependency, including opioid dependence (rs609148, G allele and rs495491, G allele) (57), all of which are consistent with a low level of opioid receptor activity. On the other hand, whereas the T allele of rs563649 in our cohort is associated with a decreased analgesic response to opioids, again consistent with low levels of receptor activity (21), the A allele of rs1799971, which is situated on the haplotype tagged by the T allele of rs563649, is associated with an increased analgesic response to opioids (16).
Together, our data give rise to the possibility that some of the previously reported positive associations can be explained, at least in part, by the high LD between the reported markers and the SNP rs563649 identified in this study (57,58). Furthermore, it is likely that several functional SNPs co-exist within the haplotype, where alternative alleles play specific roles in distinct but related pain phenotypes, are carefully balanced and thus transmitted jointly. This haplotype was observed in 6% of the subjects, thus representing a substantial proportion of the human population and is of clinical significance.
It should be noted that our association analysis has been conducted on two moderately sized cohorts. The primary results were obtained in the larger UNC cohort that consisted of a homogeneous sub-sample of Caucasian females. The second UF cohort is smaller and consists of both genders. Although the association tests were highly significant in the first cohort only, and it is important to replicate our results in larger cohorts, the direction of effects was the same for both cohorts with respect to pain sensitivity, and associations with morphine response phenotypes were in the expected direction, suggesting that the T allele codes for a low-efficiency receptor variant. Furthermore, the validity of our findings is supported by molecular biology experiments presented here, which demonstrate the existence of human exon 13 and a functional effect of the identified SNP rs563649.
To understand how the newly identified SNP may produce functional effects, we constructed a reporter vector that includes the entire predicted IRES element. Although the exact molecular mechanism by which rs563649 regulates OPRM1 function and pain signaling requires further studies, out data suggest that the presence of minor T allele should lead to higher expression levels of corresponding MOR-1K isoforms. Furthermore, the localization of a strong functional SNP within the human analog of mouse exon 13 provides evidence for the biological significance of MOR-1K isoforms. We showed that MOR-1K isoforms with variable exon 13–exon 2 junctions are expressed in a tissue-specific manner and likely contribute to tissue-specific post-transcriptional regulation. Because the T allele of rs563649 is associated with higher translation efficiency and higher pain sensitivity, we suggest that the truncated MOR-1K form contributes to hyperalgesic-like rather than analgesic states and plausibly represents one of the molecular mechanisms underlying the excitatory effect of opiods, contributing to tolerance, drug dependence and opioid-induced hyperalgesia (60–62). Furthermore, similarities in the tissue-specific expression patterns between MOR-1 and MOR-1K, with lower abundance of MOR-1K relative to MOR-1 isoforms, support the possibility of a regulatory function for MOR1-K. To date, no systematic studies involving the genetics, molecular and cell biology of this form of OPRM1 receptor have been reported; and its biological function clearly warrants further research.
We also have shown that almost all of the known mouse exons have corresponding orthologs within the human OPRM1 gene locus and thus the genetic structure of human OPRM1 is much more complex than is currently appreciated. According to recent studies, at least 50% or more of human genome is expressed in alternatively spliced isoforms (63). There is a number of both computational and molecular biological difficulties that make computational predictions and cloning of the genetic variants of OPRM1 highly challenging. The novel approaches used in this study overcame these difficulties. The discovery of a much more complicated receptor structure makes possible new interpretations of existing results and permits the generation of novel testable hypotheses in diverse disciplines that have interest in studying the OPRM1 function.
Genomic organization of the expanded human OPRM1 locus is highly similar to the organization of the mouse OPRM1 locus. However, alternative splicing events within this locus display some substantial differences between human and mouse, and thus findings from rodent studies should be considered with caution when applied to the function of human opioid receptor. Specifically, our RT–PCR and 5′RACE data suggest that exon 13 containing OPRM1 mRNA variants in human and mouse are highly divergent (Fig. 2A–C; Supplementary Material, Fig. S5). New tissue-specific alternative splice isoforms increase functional diversity of the gene and create additional options for regulation, as demonstrated by the strong effect of SNP rs563649 on pain sensitivity (64). Importantly, location of this functional SNP in a region of variable inter-species conservation shows that biological function does not always correlate with sequence conservation.
Our results also suggest that newly discovered alternative exons, rather than constitutive exons, may represent targets for genetic variability which modifies OPRM1 receptor function. Since modifications of the function of the main receptor form may have dramatic consequences on fitness and may not reach significant frequency in the general population, genetic variations in alternative exons that are expressed at low levels or only under specific conditions may lead to more subtle phenotypic differences that underlie the observed variation in OPRM1-dependent phenotypes. Furthermore, our data and methodological approaches are of relevance to genome-wide association studies when SNPs associated with clinical phenotypes are located in genomic areas that are devoid of known structural genetic elements (65).
In summary, the identification of a potentially new functional SNP with a substantial minor allele frequency within alternative exons of OPRM1 is of considerable importance to the field of pain genetics. Although the association of SNPs rs563649 with sensitivity to noxious stimuli and morphine responses requires further confirmation in larger cohorts, our results provide strong evidence that this SNP has a far greater effect on receptor function than other currently known OPRM1 polymorphisms. Collectively, our data open conceptually new approaches to examining the structure and function of the OPRM1 gene.
MATERIALS AND METHODS
First cohort description
One hundred ninety six (196) healthy European American pain-free females with an age range of 18–34 years were genotyped and phenotyped. Demographic characteristics of the cohort at the time of recruitment were previously described (47). This study was nested within a larger prospective study conducted at the University of North Carolina at Chapel Hill, which was designed to examine whether pain sensitivity is a risk factor for the development of TMJD (47). Subjects were phenotyped with respect to their sensitivity to pressure pain, heat pain and ischemic pain. Indices of the temporal summation of heat-evoked pain were also examined. The detailed description of phenotypic procedures can be found in Supplementary Materials. Each enrollee in the analyzed cohort was quantified for responsiveness to a set of 16 noxious stimuli applied to various anatomical sites.
Second cohort description
The second cohort was recruited at the University of Florida at Gainesville. Subjects included 133 healthy European American volunteers (80 females, 53 males) recruited by posted advertisements from the local community. In a subset of this cohort (n = 68, 40 females, 28 males), the analgesic effect of morphine on experimental pain sensitivity was also assessed. The experimental pain procedures were similar to those described for the UNC cohort and can be found in the Supplementary Material.
Computer analyses of genomic sequences
We used known alternatively spliced forms of mouse OPRM1 (MOR-1B, MOR-1F, MOR-1I, MOR-1J, MOR-1K and MOR-1L, MOR-1Q, MOR-1S, MOR-1T, MOR-1R, MOR-1P, MOR-1V and MOR-1W) from GenBank annotations (http://www.ncbi.nlm.nih.gov/) to locate unidentified human orthologous exons. Annotated alternative mouse and human variants from altervative splice database (http://www.ebi.ac.uk/asd) and UCSC database (http://genome.ucsc.edu/) were also used in the analysis. BLAST (66) and BLAT (http://genome.ucsc.edu/) were used to confirm the synteny of aligned full-length sequences of the human and mouse OPRM1 genes. Detailed alignments of orthologous pairs of the human and mouse OPRM1 genomic and mRNA sequences were produced using OWEN (36). For the CDS, the alignment of the nucleotide sequences was guided by the amino acid sequence alignment (67). Multiple alignments of nucleotide sequences were constructed using the CLUSTALW program with default parameters (68) and edited to take into account results of pairwise comparisons, which was done using the OWEN program (36). In all cases, our alignments contained putative exons presented in GenBank. We masked sequences using RepeatMasker (http://humangen.med.ub.es/tools/RepeatMasker.html), because numerous low-complexity and repetitive regions in long intronic sequences obscured the pattern of orthology. All predicted primate transcripts were analyzed by GENSCAN (http://gnomic.stanford.edu/ http://CCR-081.mit.edu/GENSCAN.html). Modified UNCOVER (42) approaches for the recognition of unknown conserved alternatively spliced exons were used for extensive search of regulatory sites and splicing signals. Two alternative approaches for treating gaps (indels) in pairwise sequence alignments were employed: (i) whenever a gap was introduced in one of the sequences, the respective position in another sequence was treated as a non-conserved one (a mismatch) and (ii) positions containing one or more gaps were excluded from the analysis (40). Evolutionary rates at non-synonymous (Ka) and synonymous (Ks) sites were calculated for coding exons using program PALM (69). Evolutionary rates at non-coding exons (Ku) and for intronic sequences (Ki) were calculated using Kimura’s two-parameter model (70). We performed a search for regulatory sites and splicing signals using the TRANSFAC database (http://www.biobaseinternational.com/pages/index.php? id=transfacdatabases). Rodent and primate 5′-UTRs were computationally folded by program Afold (71) to predict potential IRES stable structures. The predicted minimum free secondary structure energy was calculated using our implementation of the dynamic programming algorithm described by Zuker (72), which employs nearest neighbor parameters for the evaluation of free energy.
SNPs genotyping
The algorithm for the selection of new candidate SNPs and full SNP description are presented in the Supplementary Material. Briefly, we concentrated on the SNPs with relatively high minor allele frequencies that are situated within potentially functional sites relative to known constitutive and predicted alternative exons (Table 2). Genomic DNA was purified using QIAampTM 96 DNA Blood Kit (Qiagen, Valencia, CA, USA). The primers and probes for genotyping were from Applied Biosystems (ABI, Foster City, CA, USA) (Supplementary Material, Table S1). The genotyping error rate was directly determined and was <0.005. Genotype completion rate was 95%.
Statistical analyses
We constructed summary statistics quantifying aspects of the four pain modalities. Standardized z-scores for each pain measure at each test site were computed by subtracting the sample mean of the site-specific pain measure from the subject’s observed value, and dividing by the sample standard deviation. The summary score was obtained by adding up standardized z-scores.
Haplotype association methods
An overall test for association of a set of haplotypes with the phenotype involves a specific set of k SNPs. The null hypothesis of such a test is that none of the haplotypes defined by the k SNPs is associated with the phenotype. When the haplotype phase is unobserved, current methods incorporate specific assumptions about the degree of deviation from Hardy–Weinberg equilibrium. Here we employ a method that does not depend on the HWE assumption. The approach is termed the ‘composite haplotype method’, CHM (52). The idea behind the CHM approach is best explained for the case of a binary (e.g. case/control) phenotype. For two loci with alleles (A, a) and (B, b), the ‘composite frequency’ is the sum of intra-gametic, or haplotypic (PAB) and inter-gametic (PA/B) frequencies (73). The advantage in considering the composite sum is that unlike the haplotypic frequency, this sum is directly estimated by counting from the unphased data. Thus, the HWE assumption is not required, and furthermore, the uncertainty in estimation of the composite frequencies is confined to just the sampling variation and does not involve an error related to the missing haplotype phase. This composite frequency (QAB = [PAB+PA/B]/2) also forms the basis for the LD inference by the composite disequilibrium approach (51). Instead of comparing the haplotype frequencies themselves, as dh = PAB (case) − PAB (control), the comparison in the CHM is based on the composite difference, dc = QAB (case) − QAB (control). Both differences are similarly expressed in terms of the population frequencies (fi) and the susceptibilities (gi) for the 10 possible di-locus genotypes (AB/AB, … , AB/ab, Ab/aB, … , ab/ab). Denote the population prevalence by g. Then the population frequency differences of interest are
 |
Note the similarity of the two equations. The terms of dc would add up to dh exactly, if the term f6 (g6−g)/2 that corresponds to the cis-heterozygote, Ab/aB, was replaced by the trans-heterozygote (AB/ab) term, f5 (g5−g)/2. When AB is a susceptibility haplotype, the term dh is positive, and so is dc. In other words, the haplotypic and the composite frequency differences are in the same direction for the ‘haplotype-driven’ models. We define haplotype-driven models to include recessive, dominant, as well as intermediate models, notably the additive model, where susceptibilities of AB heterozygotes are between those for the genotypes with 0 and 2 copies of AB. Whether the sign of dc is in the same direction as that for dh is determined by the magnitude of the terms that corresponds to the cis- and trans-genotypes, Ab/aB and AB/ab. The condition that the dc is non-negative is satisfied for the ‘haplotype-driven’ models because of the constraints on the population frequencies and the model susceptibilities. Consider the recessive model: g1 > g2; g2 = g3 … = g10. Under this model, the difference that defines the sign,
 |
is always non-negative, therefore, the signs of dh and dc are in the same direction. This difference is similarly non-negative for other haplotype-driven models. Thus, the composite difference can be used as a basis for testing haplotypic associations. More generally, the composite difference provides a direct test of association between sets of alleles across genetic loci and the phenotype, without assuming HWE. Multilocus, multiallelic composite extension is obtained very simply. There are as many composite frequencies as there are haplotypes, and the notation for the composite classes is the same as that for the haplotypes, e.g. ‘A2B1C1D1' may refer to either a haplotypic or a composite set of alleles (A2, B1, C1, D1) at four loci. Denote a particular set of alleles such as this by Sk. The composite sample frequency of this four loci allele set is
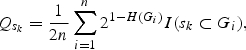 |
where H(Gi) is the number of single-locus heterozygotes in the multilocus genotype Gi of the ith individual, i=1, … ,n, and I(·) is the indicator function that is equal to 1 if the ith individual has alleles (Sk), and 0 otherwise.
For a continuous phenotype, the overall and the individual test statistics for association are F-statistics in a linear regression with the design matrix where columns indicate all haplotype classes of interest, rows correspond to the individuals and entries are 1/H(Gi), the reciprocals of the individual’s heterozygosity, or 0 if the genotype is incompatible with the allele set corresponding to the column. For one locus, the test reduces to the allelic trend test (53). As an association test for joint frequencies of alleles across multiple loci, the CHM is a valid test to detect allelic interactions between loci that are involved in an association with the studied trait. The CHM does not rely on LD between the loci and in fact can be used to detect interactions among multiple loci with weak or no LD. Moreover, Morris and Kaplan (74) showed that usage of haplotype association methods might be advantageous under weak LD, because single-locus-based approaches tend to provide high power when the LD is strong. Further details of the CHM will be described elsewhere.
Although CHM provides a robust test when haplotypic association is present in a region, we are also concerned with an unbiased estimation of effects for particular haplotypes. Shibata et al. (54) suggested a parametric method that provides estimates of haplotype effects as well as haplotype-specific P-values based on a likelihood ratio test. A particular model (diplotypic, additive, recessive, dominant or overdominant) needs to be specified prior to the analysis. A haplotype would be flagged as an ‘associated’ if the significance persists across all methods. When the same haplotype is tested by the different methods, there is no need for a strict correction for multiple testing, because the same hypothesis is being tested. In this case, a conservative overall P-value for a particular haplotype is given by the maximum of the P-values (diplotypic, dominant, additive and CHM). In fact, this gives the upper bound for Simes’s adjustment/combination test (75), which is applicable under positive dependence among P-values, such as expected here. Haplotype frequencies were estimated using a program described by Shibata et al. (54,55), which implements the estimation via the EM algorithm.
The flow of the haplotypic analysis was as follows: CHM was used in a sliding window fashion, using window sizes from one to 12 SNPs (W = 1, … ,12), with the maximum size pre-chosen to be equal to one-half of the number of markers. Window size of one corresponds to the test of an additive effect of an SNP (‘allelic trend test’). The permutation-based overall test (100 000 permutations) of composite allelic association was computed for each window, the –ln(P-value) plotted and compared with the conservative Bonferroni threshold that accommodates the number of tests in each window. The tests involving the different W are not independent, because they contain and share linked markers in LD. Nevertheless, if significance of association persists across windows of different sizes (as we indeed observed), the overall confidence in the association should be increased.
Overall tests that showed a significant association were followed by a more detailed analysis of individual haplotypes comprising SNPs involved in the overall test. P-values were computed by both the method of Shibata et al. and the CHM (with 500 000 permutations) to investigate the correspondence between P-values obtained by these two methods. Haplotype effects were computed by the method of Shibata et al. (54), as the mean phenotypic values among individuals carrying one or two copies of the haplotype of interest.
LD matrices were produced by Haploview version 3.32 (Whitehead Institute for Biomedical Research, USA).
Reverse transcriptase–polymerase chain reaction
RNA samples were purchased from Takara Bio (Palo Alto, CA, USA; Supplementary Material, Table S3). The cDNAs were synthesized using 2–5 µg of total RNA with either cDNA Archive reverse transcription kit (ABI) or Superscript III reverse transcription kit (Invitrogen, Carlsbad, CA, USA), using random primer. cDNA samples were amplified using the GeneAmp XL (rTth DNA polymerase) PCR kit (ABI). The sequences of the human and mouse primers and amplification conditions are listed in the Supplementary Material, Table S4. The DNA sequence was determined by UNC-CH Genome Analysis Facility and compared with the predicted sequence of the 13th exon of the human OPRM1 and human genomic DNA (UCSC database).
Cloning and expression of the putative IRES element
The C and T allelic variants of putative IRES were cloned into an NF-kB-SEAP reporter vector (Takara Bio) using unique HindIII and NruI restriction sites between transcription and translation start sites of the SEAP reporter (Supplementary Material, Fig. S6). Human neuroblastoma BE2C cells (ATCC, Manassas, VA, USA) were grown to 90% confluency in 12- well plates and transiently transfected using Lipofectamine-2000 (Invitrogen) with a mixture of either 0.3 µg of pNF-kB-SEAP-IRES(C/T) constructs or original pNF-kB-SEAP reporter vector and 0.03 µg of pCMC-Luc (CLONTECH) vector per well. The levels of SEAP mRNA and enzymatic activity were determined at 8, 24 and 48 h after transfection, by real-time PCR using SYBRGreen PCR kit (ABI) and by luminometry using a Great Escape kit (Takara Bio). Data were normalized for transfection efficiency by measuring the mRNA levels of Luc for each experimental point, measured by real-time PCR using SYBRGreen PCR kit (ABI). Total RNA was isolated using the RNeasy Mini kit (Qiagen). The isolated RNA was treated with TURBO DNA-free kit (Ambion, Austin, TX, USA) and reverse transcribed by SuperScript III reverse transcriptase (Invitrogen). The cDNA for SEAP and Luc was amplified using forward and reverse PCR primers (AGAGATACGCCCTGGTTCCT and CCAACACCGGCATAAAGAAT, respectively, for Luc and GCCGACCACTCCCA-CGTCTT and CCCGCTCTCGCTCTCGGTAA, respectively, for SEAP). ABI 7900 Real-Time Fluorescence Detection System (ABI) was used for measuring fluorescence.
SUPPLEMENTARY MATERIAL
Supplementary Material is available at HMG online.
Conflict of Interest statement. None declared.
FUNDING
This work was supported in part by NIDCR and NINDS grants RO1-DE16558, UO1-DE017018, NS41670 and PO1 NS045685, and the Intramural Research Programs of NIEHS, NCBI/NLM and NIDRC. Funding to pay the Open Access Charge was provided by Intramural Research Program of the National Institutes of Health, National Library of Medicine.
Supplementary Material
REFERENCES
- 1.Ready L.B. In: Anesthesia. Miller R.D., editor. Livingstone: Churchill; 2000. pp. 2323–2350. [Google Scholar]
- 2.Rowlingson J.C., Murphy T.M. In: Anesthesia. Miller R.D., editor. Livingston: Churchill; 2000. pp. 7752–7755. [Google Scholar]
- 3.Inturrisi C.E. Clinical pharmacology of opioids for pain. Clin. J. Pain. 2002;18:S3–S13. doi: 10.1097/00002508-200207001-00002. [DOI] [PubMed] [Google Scholar]
- 4.Goldstein F.J. Adjuncts to opioid therapy. J. Am. Osteopath. Assoc. 2002;102:S15–S21. [PubMed] [Google Scholar]
- 5.Polomano R.C., Gelnett C.M., Heffner S.M., Lindenmuth J., Brehm B.A., French D., Reck D.L. Evidence for opioid variability, Part 1: a biological perspective. Semin. Perioper. Nurs. 2001;10:3–16. [PubMed] [Google Scholar]
- 6.Polomano R.C., Heffner S.M., Reck D.L., Gelnett C.M., French D. Evidence for opioid variability, Part 2: psychosocial influences. Semin. Perioper. Nurs. 2001;10:159–166. [PubMed] [Google Scholar]
- 7.Mather L.E., Glynn C.J. The minimum effective analgetic blood concentration of pethidine in patients with intractable pain. Br. J. Clin. Pharmacol. 1982;14:385–390. doi: 10.1111/j.1365-2125.1982.tb01995.x. [DOI] [PMC free article] [PubMed] [Google Scholar]
- 8.Camu F., Vanlersberghe C. Pharmacology of systemic analgesics. Best. Pract. Res. Clin. Anaesthesiol. 2002;16:475–488. doi: 10.1053/bean.2002.0262. [DOI] [PubMed] [Google Scholar]
- 9.Glass P.S.A. In: Anesthesia. Miller R.D., editor. Livingston: Churchill; 2000. pp. 377–411. [Google Scholar]
- 10.Galer B.S., Coyle N., Pasternak G.W., Portenoy R.K. Individual variability in the response to different opioids: report of five cases. Pain. 1992;49:87–91. doi: 10.1016/0304-3959(92)90192-E. [DOI] [PubMed] [Google Scholar]
- 11.Mercadante S., Casuccio A., Fulfaro F., Groff L., Boffi R., Villari P., Gebbia V., Ripamonti C. Switching from morphine to methadone to improve analgesia and tolerability in cancer patients: a prospective study. J. Clin. Oncol. 2001;19:2898–2904. doi: 10.1200/JCO.2001.19.11.2898. [DOI] [PubMed] [Google Scholar]
- 12.Cherny N., Ripamonti C., Pereira J., Davis C., Fallon M., McQuay H., Mercadante S., Pasternak G., Ventafridda V. Strategies to manage the adverse effects of oral morphine: an evidence-based report. J. Clin. Oncol. 2001;19:2542–2554. doi: 10.1200/JCO.2001.19.9.2542. [DOI] [PubMed] [Google Scholar]
- 13.Uhl G.R., Sora I., Wang Z. The mu opiate receptor as a candidate gene for pain: polymorphisms, variations in expression, nociception, and opiate responses. Proc. Natl Acad. Sci. USA. 1999;96:7752–7755. doi: 10.1073/pnas.96.14.7752. [DOI] [PMC free article] [PubMed] [Google Scholar]
- 14.Han W., Ide S., Sora I., Yamamoto H., Ikeda K. A possible genetic mechanism underlying individual and interstrain differences in opioid actions: focus on the mu opioid receptor gene. Ann. N.Y. Acad. Sci. 2004;1025:370–375. doi: 10.1196/annals.1307.045. [DOI] [PubMed] [Google Scholar]
- 15.Mogil J.S. The genetic mediation of individual differences in sensitivity to pain and its inhibition. Proc. Natl Acad. Sci. USA. 1999;96:7744–7751. doi: 10.1073/pnas.96.14.7744. [DOI] [PMC free article] [PubMed] [Google Scholar]
- 16.Lotsch J., Geisslinger G. Are mu-opioid receptor polymorphisms important for clinical opioid therapy? Trends Mol. Med. 2005;11:82–89. doi: 10.1016/j.molmed.2004.12.006. [DOI] [PubMed] [Google Scholar]
- 17.Matthes H.W., Maldonado R., Simonin F., Valverde O., Slowe S., Kitchen I., Befort K., Dierich A., Le Meur M., Dolle P., et al. Loss of morphine-induced analgesia, reward effect and withdrawal symptoms in mice lacking the mu-opioid-receptor gene. Nature. 1996;383:819–823. doi: 10.1038/383819a0. [DOI] [PubMed] [Google Scholar]
- 18.Sora I., Takahashi N., Funada M., Ujike H., Revay R.S., Donovan D.M., Miner L.L., Uhl G.R. Opiate receptor knockout mice define mu receptor roles in endogenous nociceptive responses and morphine-induced analgesia. Proc. Natl Acad. Sci. USA. 1997;94:1544–1549. doi: 10.1073/pnas.94.4.1544. [DOI] [PMC free article] [PubMed] [Google Scholar]
- 19.Edwards R.R., Haythornthwaite J.A., Tella P., Max M.B., Raja S. Basal heat pain thresholds predict opioid analgesia in patients with postherpetic neuralgia. Anesthesiology. 2006;104:1243–1248. doi: 10.1097/00000542-200606000-00020. [DOI] [PubMed] [Google Scholar]
- 20.Pan P.H., Coghill R., Houle T.T., Seid M.H., Lindel W.M., Parker R.L., Washburn S.A., Harris L., Eisenach J.C. Multifactorial preoperative predictors for postcesarean section pain and analgesic requirement. Anesthesiology. 2006;104:417–425. doi: 10.1097/00000542-200603000-00007. [DOI] [PubMed] [Google Scholar]
- 21.Mogil J.S., Wilson S.G., Bon K., Lee S.E., Chung K., Raber P., Pieper J.O., Hain H.S., Belknap J.K., Hubert L., et al. Heritability of nociception I: responses of 11 inbred mouse strains on 12 measures of nociception. Pain. 1999;80:67–82. doi: 10.1016/s0304-3959(98)00197-3. [DOI] [PubMed] [Google Scholar]
- 22.Klepstad P., Rakvag T.T., Kaasa S., Holthe M., Dale O., Borchgrevink P.C., Baar C., Vikan T., Krokan H.E., Skorpen F. The 118 A > G polymorphism in the human micro-opioid receptor gene may increase morphine requirements in patients with pain caused by malignant disease. Acta Anaesthesiol. Scand. 2004;48:1232–1239. doi: 10.1111/j.1399-6576.2004.00517.x. [DOI] [PubMed] [Google Scholar]
- 23.Rakvag T.T., Klepstad P., Baar C., Kvam T.M., Dale O., Kaasa S., Krokan H.E., Skorpen F. The Val158Met polymorphism of the human catechol-O-methyltransferase (COMT) gene may influence morphine requirements in cancer pain patients. Pain. 2005;116:73–78. doi: 10.1016/j.pain.2005.03.032. [DOI] [PubMed] [Google Scholar]
- 24.Chou W.Y., Yang L.C., Lu H.F., Ko J.Y., Wang C.H., Lin S.H., Lee T.H., Concejero A., Hsu C.J. Association of mu-opioid receptor gene polymorphism (A118G) with variations in morphine consumption for analgesia after total knee arthroplasty. Acta Anaesthesiol. Scand. 2006;50:787–792. doi: 10.1111/j.1399-6576.2006.01058.x. [DOI] [PubMed] [Google Scholar]
- 25.Skarke C., Darimont J., Schmidt H., Geisslinger G., Lotsch J. Analgesic effects of morphine and morphine-6-glucuronide in a transcutaneous electrical pain model in healthy volunteers. Clin. Pharmacol. Ther. 2003;73:107–121. doi: 10.1067/mcp.2003.5. [DOI] [PubMed] [Google Scholar]
- 26.Fillingim R.B., Kaplan L., Staud R., Ness T.J., Glover T.L., Campbell C.M., Mogil J.S., Wallace M.R. The A118G single nucleotide polymorphism of the mu-opioid receptor gene (OPRM1) is associated with pressure pain sensitivity in humans. J. Pain. 2005;6:159–167. doi: 10.1016/j.jpain.2004.11.008. [DOI] [PubMed] [Google Scholar]
- 27.Ikeda K., Ide S., Han W., Hayashida M., Uhl G.R., Sora I. How individual sensitivity to opiates can be predicted by gene analyses. Trends Pharmacol. Sci. 2005;26:311–317. doi: 10.1016/j.tips.2005.04.001. [DOI] [PubMed] [Google Scholar]
- 28.Bond C., LaForge K.S., Tian M., Melia D., Zhang S., Borg L., Gong J., Schluger J., Strong J.A., Leal S.M., et al. Single-nucleotide polymorphism in the human mu opioid receptor gene alters beta-endorphin binding and activity: possible implications for opiate addiction. Proc. Natl Acad. Sci. USA. 1998;95:9608–9613. doi: 10.1073/pnas.95.16.9608. [DOI] [PMC free article] [PubMed] [Google Scholar]
- 29.Befort K., Filliol D., Decaillot F.M., Gaveriaux-Ruff C., Hoehe M.R., Kieffer B.L. A single nucleotide polymorphic mutation in the human mu-opioid receptor severely impairs receptor signaling. J. Biol. Chem. 2001;276:3130–3137. doi: 10.1074/jbc.M006352200. [DOI] [PubMed] [Google Scholar]
- 30.Beyer A., Koch T., Schroder H., Schulz S., Hollt V. Effect of the A118G polymorphism on binding affinity, potency and agonist-mediated endocytosis, desensitization, and resensitization of the human mu-opioid receptor. J. Neurochem. 2004;89:553–560. doi: 10.1111/j.1471-4159.2004.02340.x. [DOI] [PubMed] [Google Scholar]
- 31.Zhang Y., Wang D., Johnson A.D., Papp A.C., Sadee W. Allelic expression imbalance of human mu opioid receptor (OPRM1) caused by variant A118G. J. Biol. Chem. 2005;280:32618–32624. doi: 10.1074/jbc.M504942200. [DOI] [PubMed] [Google Scholar]
- 32.Narita M., Nishigami N., Narita N., Yamaguti K., Okado N., Watanabe Y., Kuratsune H. Association between serotonin transporter gene polymorphism and chronic fatigue syndrome. Biochem. Biophys. Res. Commun. 2003;311:264–266. doi: 10.1016/j.bbrc.2003.09.207. [DOI] [PubMed] [Google Scholar]
- 33.Pasternak D.A., Pan L., Xu J., Yu R., Xu M.M., Pasternak G.W., Pan Y.X. Identification of three new alternatively spliced variants of the rat mu opioid receptor gene: dissociation of affinity and efficacy. J. Neurochem. 2004;91:881–890. doi: 10.1111/j.1471-4159.2004.02767.x. [DOI] [PubMed] [Google Scholar]
- 34.Schuller A.G., King M.A., Zhang J., Bolan E., Pan Y.X., Morgan D.J., Chang A., Czick M.E., Unterwald E.M., Pasternak G.W., Pintar J.E. Retention of heroin and morphine-6 beta-glucuronide analgesia in a new line of mice lacking exon 1 of MOR-1. Nat. Neurosci. 1999;2:151–156. doi: 10.1038/5706. [DOI] [PubMed] [Google Scholar]
- 35.Pasternak G.W. Multiple opiate receptors: deja vu all over again. Neuropharmacology. 2004;47(Suppl. 1):312–323. doi: 10.1016/j.neuropharm.2004.07.004. [DOI] [PubMed] [Google Scholar]
- 36.Ogurtsov A.Y., Roytberg M.A., Shabalina S.A., Kondrashov A.S. OWEN: aligning long collinear regions of genomes. Bioinformatics. 2002;18:1703–1704. doi: 10.1093/bioinformatics/18.12.1703. [DOI] [PubMed] [Google Scholar]
- 37.Shabalina S.A., Ogurtsov A.Y., Kondrashov V.A., Kondrashov A.S. Selective constraint in intergenic regions of human and mouse genomes. Trends Genet. 2001;17:373–376. doi: 10.1016/s0168-9525(01)02344-7. [DOI] [PubMed] [Google Scholar]
- 38.Kondrashov A.S., Shabalina S.A. Classification of common conserved sequences in mammalian intergenic regions. Hum. Mol. Genet. 2002;11:669–674. doi: 10.1093/hmg/11.6.669. [DOI] [PubMed] [Google Scholar]
- 39.Yeo G., Hoon S., Venkatesh B., Burge C.B. Variation in sequence and organization of splicing regulatory elements in vertebrate genes. Proc. Natl Acad. Sci. USA. 2004;101:15700–15705. doi: 10.1073/pnas.0404901101. [DOI] [PMC free article] [PubMed] [Google Scholar]
- 40.Shabalina S.A., Ogurtsov A.Y., Rogozin I.B., Koonin E.V., Lipman D.J. Comparative analysis of orthologous eukaryotic mRNAs: potential hidden functional signals. Nucleic Acids Res. 2004;32:1774–1782. doi: 10.1093/nar/gkh313. [DOI] [PMC free article] [PubMed] [Google Scholar]
- 41.Le S.Y., Maizel J.V., Jr A common RNA structural motif involved in the internal initiation of translation of cellular mRNAs. Nucleic Acids Res. 1997;25:362–369. doi: 10.1093/nar/25.2.362. [DOI] [PMC free article] [PubMed] [Google Scholar]
- 42.Ohler U., Shomron N., Burge C.B. Recognition of unknown conserved alternatively spliced exons. PLoS Comput. Biol. 2005;1:113–122. doi: 10.1371/journal.pcbi.0010015. [DOI] [PMC free article] [PubMed] [Google Scholar]
- 43.Pan Y.X. Diversity and complexity of the mu opioid receptor gene: alternative pre-mRNA splicing and promoters. DNA Cell Biol. 2005;24:736–750. doi: 10.1089/dna.2005.24.736. [DOI] [PubMed] [Google Scholar]
- 44.Xu J., Xu M., Pan Y.X. Characterizing exons 11 and 1 promoters of the mu opioid receptor (Oprm) gene in transgenic mice. BMC Mol. Biol. 2006;7:41. doi: 10.1186/1471-2199-7-41. [DOI] [PMC free article] [PubMed] [Google Scholar]
- 45.Nurtdinov R.N., Artamonova I.I., Mironov A.A., Gelfand M.S. Low conservation of alternative splicing patterns in the human and mouse genomes. Hum. Mol. Genet. 2003;12:1313–1320. doi: 10.1093/hmg/ddg137. [DOI] [PubMed] [Google Scholar]
- 46.Bhalang K., Sigurdsson A., Slade G.D., Maixner W. Associations among four modalities of experimental pain in women. J. Pain. 2005;6:604–611. doi: 10.1016/j.jpain.2005.04.006. [DOI] [PubMed] [Google Scholar]
- 47.Diatchenko L., Slade G.D., Nackley A.G., Bhalang K., Sigurdsson A., Belfer I., Goldman D., Xu K., Shabalina S.A., Shagin D., et al. Genetic basis for individual variations in pain perception and the development of a chronic pain condition. Hum. Mol. Genet. 2005;14:135–143. doi: 10.1093/hmg/ddi013. [DOI] [PubMed] [Google Scholar]
- 48.Smith G.M., Egbert L.D., Markowitz R.A., Mosteller F., Beecher H.K. An experimental pain method sensitive to morphine in man: the submaximum effort tourniquet technique. J. Pharmacol. Exp. Ther. 1966;154:324–332. [PubMed] [Google Scholar]
- 49.Price D.D., Von der G.A., Miller J., Rafii A., Price C. A psychophysical analysis of morphine analgesia. Pain. 1985;22:261–269. doi: 10.1016/0304-3959(85)90026-0. [DOI] [PubMed] [Google Scholar]
- 50.Fillingim R.B., Ness T.J., Glover T.L., Campbell C.M., Hastie B.A., Price D.D., Staud R. Morphine responses and experimental pain: sex differences in side effects and cardiovascular responses but not analgesia. J. Pain. 2005;6:116–124. doi: 10.1016/j.jpain.2004.11.005. [DOI] [PubMed] [Google Scholar]
- 51.Staahl C., Upton R., Foster D.J., Christrup L.L., Kristensen K., Hansen S.H., Arendt-Nielsen L., Drewes A.M. Pharmacokinetic-pharmacodynamic modeling of morphine and oxycodone concentrations and analgesic effect in a multimodal experimental pain model. J. Clin. Pharmacol. 2008;48:619–631. doi: 10.1177/0091270008314465. [DOI] [PubMed] [Google Scholar]
- 52.Zaykin D.V., Ehm M.G., Weir B.S. Determining success of haplotyping algorithms using densely mapped genomic regions. Am. J. Hum. Genet. 2001;69:116. [Google Scholar]
- 53.Zaykin D.V., Westfall P.H., Young S.S., Karnoub M.A., Wagner M.J., Ehm M.G. Testing association of statistically inferred haplotypes with discrete and continuous traits in samples of unrelated individuals. Hum Hered. 2002;53:79–91. doi: 10.1159/000057986. [DOI] [PubMed] [Google Scholar]
- 54.Shibata K., Ito T., Kitamura Y., Iwasaki N., Tanaka H., Kamatani N. Simultaneous estimation of haplotype frequencies and quantitative trait parameters: applications to the test of association between phenotype and diplotype configuration. Genetics. 2004;168:525–539. doi: 10.1534/genetics.104.029751. [DOI] [PMC free article] [PubMed] [Google Scholar]
- 55.Shibata K., Diatchenko L., Zaykin D.V. Haplotype associations with quantitative traits in the presence of complex multilocus and heterogeneous effects. Genet Epidemiol. 2008;33:63–78. doi: 10.1002/gepi.20358. [DOI] [PMC free article] [PubMed] [Google Scholar]
- 56.Smith G.M., Egbert L.D., Markowtiz R.A., Mosteller F., Beecher H.K. An experimental pain method sensitive to morphine in man: the submaximum effort tourniquet technique. J. Pharmacol. Exp. Therap. 1966;154:324–332. [PubMed] [Google Scholar]
- 57.Zhang H.P., Luo X.G., Kranzler H.R., Lappalainen J., Yang B.Z., Krupitsky E., Zvartau E., Gelernter J. Association between two mu-opioid receptor gene (OPRM1) haplotype blocks and drug or alcohol dependence. Hum. Mol. Genet. 2006;15:807–819. doi: 10.1093/hmg/ddl024. [DOI] [PMC free article] [PubMed] [Google Scholar]
- 58.Max M.B., Wu T., Atlas S.J., Edwards R.R., Haythornthwaite J.A., Bollettina A.F., Hipp H.S., McKnight C.D., Osman I.A., Crawford E.N., Pao M., et al. A clinical genetic method to identify mechanisms by which pain causes depression and anxiety. Mol. Pain. 2006;2:14. doi: 10.1186/1744-8069-2-14. [DOI] [PMC free article] [PubMed] [Google Scholar]
- 59.Chappell S.A., LeQuesne J.P., Paulin F.E., deSchoolmeester M.L., Stoneley M., Soutar R.L., Ralston S.H., Helfrich M.H., Willis A.E. A mutation in the c-myc-IRES leads to enhanced internal ribosome entry in multiple myeloma: a novel mechanism of oncogene de-regulation. Oncogene. 2000;19:4437–4440. doi: 10.1038/sj.onc.1203791. [DOI] [PubMed] [Google Scholar]
- 60.Crain S.M., Shen K.F. Antagonists of excitatory opioid receptor functions enhance morphine’s analgesic potency and attenuate opioid tolerance/dependence liability. Pain. 2000;84:121–131. doi: 10.1016/s0304-3959(99)00223-7. [DOI] [PubMed] [Google Scholar]
- 61.Galeotti N., Stefano G.B., Guarna M., Bianchi E., Ghelardini C. Signaling pathway of morphine induced acute thermal hyperalgesia in mice. Pain. 2006;123:294–305. doi: 10.1016/j.pain.2006.03.008. [DOI] [PubMed] [Google Scholar]
- 62.Sarne Y., Rubovitch V., Fields A., Gafni M. Dissociation between the inhibitory and stimulatory effects of opioid peptides on cAMP formation in SK-N-SH neuroblastoma cells. Biochem. Biophys. Res. Commun. 1998;246:128–131. doi: 10.1006/bbrc.1998.8582. [DOI] [PubMed] [Google Scholar]
- 63.Birney E., Stamatoyannopoulos J.A., Dutta A., Guigo R., Gingeras T.R., Margulies E.H., Weng Z., Snyder M., Dermitzakis E.T., Thurman R.E., et al. Identification and analysis of functional elements in 1% of the human genome by the ENCODE pilot project. Nature. 2007;447:799–816. doi: 10.1038/nature05874. [DOI] [PMC free article] [PubMed] [Google Scholar]
- 64.Kriventseva E.V., Koch I., Apweiler R., Vingron M., Bork P., Gelfand M.S., Sunyaev S. Increase of functional diversity by alternative splicing. Trends Genet. 2003;19:124–128. doi: 10.1016/S0168-9525(03)00023-4. [DOI] [PubMed] [Google Scholar]
- 65.Wellcome Trust Case Control Consortium. Genome-wide association study of 14,000 cases of seven common diseases and 3,000 shared controls. Nature. 2007;447:661–678. doi: 10.1038/nature05911. [DOI] [PMC free article] [PubMed] [Google Scholar]
- 66.Altschul S.F., Madden T.L., Schaffer A.A., Zhang J., Zhang Z., Miller W., Lipman D.J. Gapped BLAST and PSI-BLAST: a new generation of protein database search programs. Nucleic Acids Res. 1997;25:3389–3402. doi: 10.1093/nar/25.17.3389. [DOI] [PMC free article] [PubMed] [Google Scholar]
- 67.Shabalina S.A., Ogurtsov A.Y., Lipman D.J., Kondrashov A.S. Patterns in interspecies similarity correlate with nucleotide composition in mammalian 3′-UTRs. Nucleic Acids Res. 2003;31:5433–5439. doi: 10.1093/nar/gkg751. [DOI] [PMC free article] [PubMed] [Google Scholar]
- 68.Thompson J.D., Higgins D.G., Gibson T.J. CLUSTAL W: improving the sensitivity of progressive multiple sequence alignment through sequence weighting, position-specific gap penalties and weight matrix choice. Nucleic Acids Res. 1994;22:4673–4680. doi: 10.1093/nar/22.22.4673. [DOI] [PMC free article] [PubMed] [Google Scholar]
- 69.Yang Z. PAML: a program package for phylogenetic analysis by maximum likelihood. Comput. Appl. Biosci. 1997;13:555–556. doi: 10.1093/bioinformatics/13.5.555. [DOI] [PubMed] [Google Scholar]
- 70.Kimura M. A simple method for estimating evolutionary rates of base substitutions through comparative studies of nucleotide sequences. J. Mol. Evol. 1980;16:111–120. doi: 10.1007/BF01731581. [DOI] [PubMed] [Google Scholar]
- 71.Ogurtsov A.Y., Shabalina S.A., Kondrashov A.S., Roytberg M.A. Analysis of internal loops within the RNA secondary structure in almost quadratic time. Bioinformatics. 2006;22:1317–1324. doi: 10.1093/bioinformatics/btl083. [DOI] [PubMed] [Google Scholar]
- 72.Zuker M. Mfold web server for nucleic acid folding and hybridization prediction. Nucleic Acids Res. 2003;31:3406–3415. doi: 10.1093/nar/gkg595. [DOI] [PMC free article] [PubMed] [Google Scholar]
- 73.Weir B.S. Genetic Data Analysis II. Sunderland: Sinauer Associates; 2006. [Google Scholar]
- 74.Morris R.W., Kaplan N.L. On the advantage of haplotype analysis in the presence of multiple disease susceptibility alleles. Genet. Epidemiol. 2002;23:221–233. doi: 10.1002/gepi.10200. [DOI] [PubMed] [Google Scholar]
- 75.Simes R.J. An improved Bonferroni procedure for multiple tests of signi_cance. Biometrika. 1986;73:751–754. [Google Scholar]
- 76.Kvam T.M., Baar C., Rakvag T.T., Kaasa S., Krokan H.E., Skorpen F. Genetic analysis of the murine mu opioid receptor: increased complexity of Oprm gene splicing. J. Mol. Med. 2004;82:250–255. doi: 10.1007/s00109-003-0514-z. [DOI] [PubMed] [Google Scholar]
- 77.Doyle G.A., Rebecca S.X., Lin S.S., Press D.M., Grice D.E., Buono R.J., Ferraro T.N., Berrettini W.H. Identification of three mouse mu-opioid receptor (MOR) gene (Oprm1) splice variants containing a newly identified alternatively spliced exon. Gene. 2007;388:135–147. doi: 10.1016/j.gene.2006.10.017. [DOI] [PubMed] [Google Scholar]
- 78.Louie E., Ott J., Majewski J. Nucleotide frequency variation across human genes. Genome Res. 2003;13:2594–2601. doi: 10.1101/gr.1317703. [DOI] [PMC free article] [PubMed] [Google Scholar]
Associated Data
This section collects any data citations, data availability statements, or supplementary materials included in this article.