

Abstract
We propose detectors for a laboratory positron emission tomography (PET) scanner specific for mouse imaging that utilizes fewer detectors and channels of electronics compared with existing designs. The detectors are based on lutetium oxyorthosilicate (LSO) arrays, read out by orthogonal optical fibers placed on the top and bottom of the arrays. Depth of interaction (DOI) information is obtained from the ratio of the signals at either end of the array. Four different detector modules were evaluated, using different reflector materials and two types of optical fibers (wavelength shifting (WLS) fibers and clear optical fibers). The modules were compared in terms of flood histograms, energy resolution, DOI resolution and timing resolution. Energy resolution for single crystals at one irradiation depth was around 65% full-width-half-maximum (FWHM). A DOI resolution of ∼6 mm was obtained for the modules. Timing resolution was in the range of 5.1 ∼ 7.8 ns. An array assembled in the laboratory and coupled with WLS fibers had the best DOI resolution; the same array with clear fibers had the best timing resolution and a commercially manufactured array and coupled with WLS fibers had the best energy resolution.
Keywords: PET, detectors, small animal imaging, wavelength shifting (WLS) fibers
1. Introduction
We have proposed the design of a laboratory PET scanner specific to mouse imaging that can be used for routine biological applications (Du et al., 2007). This scanner is intended to be easy to use, compact (benchtop) and low in cost, with resolution and sensitivity performance that is competitive with commercial state-of-art animal PET scanners. Because of the small cross-sectional dimensions of laboratory mice (2-3 cm), the transaxial field of view (FOV) of this scanner is planned to only be ∼ 5 cm. Thus the volume of detector material required can be significantly reduced for a given sensitivity. However, with a small ring diameter, spatial resolution degrades in the radial direction as the offset from the center of FOV increases. This problem, also called the parallax error (Budinger et al., 1991), is the major challenge in reducing the ring diameter. Many approaches have been investigated to acquire depth-of-interaction (DOI) information to solve the parallax error. Some utilize multiple layers of scintillators (Seidel et al., 1999; Orita et al., 2005) and some use dual photodetectors to read out both ends of an array (Burr et al., 2003; Yang et al., 2006). We are investigating a method originally proposed by Worstell (Worstell et al., 1994), in which wavelength-shifting (WLS) optical fibers are placed orthogonally on the top and bottom of the scintillator array for signal read-out (Figure 1). 511 keV annihilation photons are first absorbed in the scintillator crystals, where visible light is emitted isotropically. The core of a WLS fiber is doped with a photofluorescent compound that absorbs incident light photons and re-emits photons isotropically at a longer wavelength. Some of the LSO scintillation photons are absorbed within the WLS fibers and are re-emitted at a longer wavelength. Some fraction of these re-emitted photons will propagate along the WLS fibers. Photon absorption and re-emission in the WLS fibers are used to channel the light signals such that X and Y locations can be determined. The Z location (depth) of interaction can, in principle, be determined by taking the ratio of the X and Y signals. This configuration enables the 3-D estimation of gamma interaction position for a PET detector. In addition to providing DOI information, the advantage of the WLS read out with respect to this project is that it allows N2 crystals in a scintillator array to be decoded with just 2N channels on an MC-PMT (multi-channel photomultiplier tube). This dramatically reduces the channel and PMT requirements and would allow, for example, a 16 × 16 scintillator array to be decoded using just 32 channels on an MC-PMT. Previous data from single crystal experiments was encouraging (Du et al, 2007) and the purpose of the present study was to extend this to full detector modules to assess performance in a more realistic setting.
Figure 1.

Schematic of detector approach using WLS fibers to read out scintillator arrays. The scintillation light of LSO (shown in blue) has an emission peak at 420 nm while the re-emitted photons from the wavelength shifting fibers (shown in green) is peaks 494 nm.
Some animal PET scanners have used clear optical fibers as waveguides for scintillation light read-out (Cherry et al., 1997; Tai et al., 2003). In these cases, the fibers are coupled parallel to the long-axis of the scintillator elements. The geometry of the present design is different, however, as the fibers are coupled perpendicular to the long-axis of the crystal to permit multiple crystals to be read out by each fiber. In this paper we also evaluate the use of optical clear fiber for orthogonal read-out and compare this with the results obtained using WLS fibers. By using reflectors around the clear fibers, together with the internal reflection properties of the fiber, some LSO light is propagated along the read-out fibers. We first performed single-crystal-single-fiber experiments to ensure that clear optical fibers coupled perpendicular to the long axis of the crystals could collect sufficient scintillation light to make this approach worthwhile investigating. Light collection efficiencies using WLS fiber and optical clear fiber read-out were compared for different fiber lengths.
Our previous paper (Du et al., 2007) studied how to maximize the light output from the ends of the WLS fibers and how to minimize the optical crosstalk between adjacent detector rows and columns. In order to trap more light inside the fiber and then increase the signal amplitude from the fiber read-out, it was helpful to choose appropriate material to couple the fibers and scintillators, and to wrap the fibers sides and ends with reflectors. The light yield from 2 × 2 × 10 mm3 LSO crystals collected from the end of a 2 × 2 × 30 mm3 WLS fiber was up to 24% (typical values 16-20%) of that obtained by direct coupling of the LSO crystal to a PMT. This number drops to around 12% when using a 1.5 × 1.5 × 30 mm3 long WLS fiber coupled to a 1.5 × 1.5 × 20 mm3 LSO crystal. These single-crystal-single-fiber experiments showed that the light collection efficiency could be sufficient for decoding interaction positions in these detectors. It was also found that to minimize the optical crosstalk, it was necessary to place thicker, or several layers of reflector between crystals when manufacturing LSO arrays. The ends of the WLS fibers coupled to the PMT also needed to be separated sufficiently for better fiber identification in the flood histograms. In this work, we assemble and test complete detector modules based on this knowledge from previous experiments.
Three different LSO arrays were used to construct complete detector modules. Two of them were made commercially with different reflectors – a diffuse reflector, WRF (white reflective film) and a specular reflector, ESR (enhanced specular reflector). The third array was constructed from individual LSO elements in the laboratory with a combination of WRF and Teflon tape as the reflectors. These LSO arrays were combined with either WLS or clear optical fiber readout. In total, four different detector modules were constructed and compared in terms of flood histograms, energy resolution, DOI resolution and timing resolution.
2. Materials and Methods
2.1 Materials
2.1.1 LSO Arrays
LSO was chosen as the scintillator material due to its combination of high stopping power for 511 keV annihilation photons and high light output. Two LSO arrays were manufactured (Shanghai SICCAS High Technology Corporation, China) using the following procedure: A whole LSO block was cut into slabs with a thickness equal to the desired pixel size (1.5 mm) in one direction. A layer of reflector was glued between each slab. The stack of LSO slabs was then rotated 90° and cut into slabs orthogonal to the original direction. Again, reflectors were inserted between each slab, and the slabs glued back together to form the finished LSO arrays (Andreaco et al., 2004). Both arrays had 5 × 5 LSO crystals with a crystal size of 1.5 × 1.5 × 20 mm3. The side surfaces of the crystals were left unpolished. The inter-crystal reflector in one array was TORAY Lumirror® E60L WRF, a white, diffuse polyester film with a thickness of 188 μm. The other array used Vikuiti™ ESR as the inter-crystal reflector. ESR is an ultra-high reflectivity, mirror-like optical enhancement film with a thickness of 65 μm. A third LSO array was assembled from individual crystals prepared by 3D Precision Optics (Ravenna, OH). The fabrication process was as follows: First, WRF was cut into small pieces as shown in Figure 2(a-1). Combining six such pieces and an outer shell, a grid was made as shown in Figure 2(a-2). Each LSO unpolished crystal was wrapped in two layers of Teflon tape and then inserted into the grid to make a 4 × 4 array. The crystal elements had a size of 1.5 × 1.5 × 20 mm3. A photograph of these three arrays is shown in Figure 2(b). For the arrays manufactured by SICCAS, the top and bottom surfaces that are to be coupled to the optical fibers are polished. For the laboratory fabricated array, the top and bottom surfaces are unpolished.
Figure 2.

(a) Use of WRF to make a grid for a 4 by 4 LSO array: (1) white reflective film was cut into small pieces; (2) combining six such pieces and an outer shell, a grid was made; (3) The extra length of reflector works as a reflector and optical isolator between adjacent fibers. (b) Photograph of the three arrays being tested. From left to right: 5 by 5 array manufactured by SICCAS with ESR reflectors; 5 by 5 array manufactured by SICCAS with WRF reflectors; homemade 4 by 4 array with WRF and two layers of Teflon tape as inter-crystal reflector. (c) Photograph of a complete detector module (LAB+WLS) made of a 4×4 LSO array with WLS fibers on both ends. It also shows an individual LSO element (1.5×1.5×20mm3, unpolished crystal) and an individual WLS fiber (1.5mm square cross-section).
2.1.2 Optical Fibers
The WLS fiber used was BCF-91AMC (Saint-Gobain, Newbury, OH) fiber which has an absorption peak at 420 nm and an emission peak at 494 nm. The polystyrene core of BCF-91AMC has a refractive index of 1.60. The fiber has two layers of acrylic cladding. The first layer has a refractive index of 1.49 and the second cladding layer has an index of refraction of 1.42. The density of the fiber is 1.05 g/cm3 and the decay time of the photofluorescent dopant is 12 ns.
The clear optical fiber used was BCF-98 (Saint-Gobain Crystals, Newbury, OH). It is made of the same material as the BCF-91AMC only without the wavelength shifter dopant. It has two layers of cladding and the refractive indexes and density are the same as BCF-91AMC.
In the clear optical fiber, the scintillation light is propagated only by internal reflection. The light detected from the end of the fibers is still the LSO scintillation light with a peak at 420 nm. For the WLS fibers, some of the LSO scintillation light has been converted through interactions with the photofluorescent core to a longer wavelength.
2.1.3 Multi-Channel Photomultiplier (MC-PMT)
The MC-PMT used in these experiments to read out the optical fibers was the Hamamatsu H7546-M64. Its spectral response has a range of 300 nm ∼ 650 nm with a maximum response (20% quantum efficiency) at 420 nm. The quantum efficiency was about 15% at 500 nm at the peak of the WLS emission spectrum. This PMT has 8 × 8 pixels with an effective area of 2 × 2 mm2 each. The center-to-center distance between pixels is 2.3 mm.
2.2 Light Collection Efficiency for WLS and Clear Optical Fiber Read Out
Light collection efficiencies were compared between LSO crystals read out by a multi-clad clear optical fiber and a multi-clad WLS fiber for the configuration shown in Figure 3(a). The LSO crystals had a dimension of 2 × 2 × 10 mm3 with all surfaces polished. The crystals were wrapped in two layers of Teflon tape. The clear fibers and WLS fibers both had a 2 mm square cross-section. The fibers were wrapped with ESR reflector along the fiber sides and with Teflon tape reflector at one end, and to the MC-PMT at the other end. The fibers were coupled to the LSO crystals with optical grease (Bicron BC-630, Saint-Gobain, Newbury, OH), which is a temporary coupling method allowing for easy repetition of a study.
Figure 3.
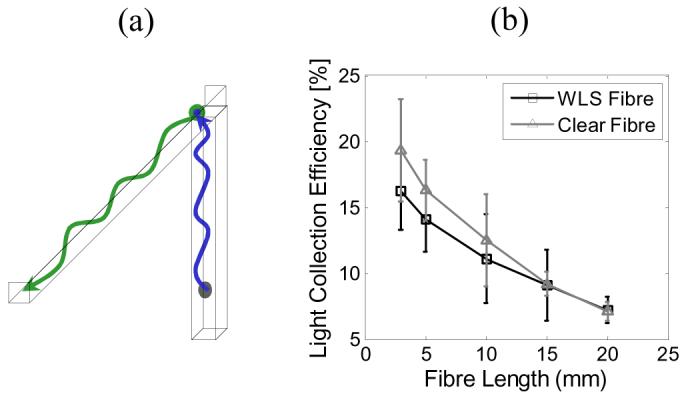
(a) Geometry for a single crystal coupled to a single square cross-section fiber. (b) Light collection efficiency of two different types of fibers coupled to an LSO crystal.
The data acquisition system has been described previously (Figure 2 in (Du et al., 2007)). The MC-PMT entrance window was covered by black tape and a single pixel was left uncovered for signal input. The bias voltage for the PMT was fixed at −800V. For each experiment, the 2 × 2 × 10 mm3 LSO crystal was first directly coupled to the PMT, and the photopeak signal in the energy spectrum was measured and recorded as ELSO. After the fiber was placed on the top of the crystal, the energy spectrum from the end of the fiber was measured. The photopeak signal was recorded as Efiber. The relative light collection efficiency (%) compared with a directly coupled LSO crystal was calculated as Efiber/ELSO×100%.
The light collection efficiency at different fiber lengths (3 cm, 5 cm, 10 cm, 15 cm, and 20 cm) was measured. The fibers were cut progressively and repolished at each length using a sequence of lapping films (3M Corp, St. Paul, MN) with grades of 12, 3 and 1 microns. The measurements were repeated four times with different fibers and crystals to account for any crystal-to-crystal and fiber-to-fiber variability.
2.3 Performance of Four Detector Modules
2.3.1 Detector Module Assembly
Four detector modules were fabricated for performance evaluation. They were: (1) WRF reflector array coupled with WLS fiber (denoted as WRF+WLS); (2) ESR reflector array coupled with WLS fibers (denoted as ESR+WLS); (3) the laboratory array coupled with WLS fibers (LAB+WLS); and (4) the same laboratory array coupled with optical clear fiber (LAB+CLE).
The optical fibers coupled to the arrays were all 1.5 mm square in cross-section and 50 mm in length. The fibers were wrapped with two layers of Teflon tape and had both ends polished. The fiber ends connected to the PMT entrance window were bent so that the fiber ends were equally spaced at 2.3 mm, which corresponds to the center-to-center distance between pixels in the MC-PMT. The fibers were coupled to both ends of the LSO arrays with optical grease. A strip of WRF was placed on the far (unconnected) ends of the fibers to reflect more light towards the PMT. For the LAB+WLS and LAB+CLE modules, the protruding parts of the homemade WRF grids (Figure 2 (a-3)) provided a guide for the fibers and worked as the “inter-fiber” reflectors. For WRF+WLS array, four 1.5 × 9 mm2 WRF strips were cut and inserted between the fibers at each end of the array. ESR strips were placed between fibers in the ESR+WLS module as well. All the other exposed parts were covered with Teflon tape. Teflon tape was also used to hold the fibers and the arrays together to assemble a complete module. Two MC-PMTs were coupled to the fiber ends to read out each module's X and Y fiber strips. The characteristics of these four modules are summarized in Table 1. Figure 2(c) is a photograph of the finished LAB+WLS module.
Table 1.
Characteristics of Four Detector Modules
| WRF+WLS | ESR+WLS | LAB+WLS | LAB+CLE | ||
|---|---|---|---|---|---|
| A | Crystal Material | LSO | LSO | LSO | LSO |
| R | Surface Condition | unpolished | unpolished | unpolished | unpolished |
| R | Crystal Size | 1.5×1.5×20mm3 | 1.5×1.5×20mm3 | 1.5×1.5×20mm3 | 1.5×1.5×20mm3 |
| A | Array Element | 5×5 | 5×5 | 4×4 | 4×4 |
| Y | Array Dimension | 8.7×8.7×20mm3 | 7.9×7.9×20mm3 | 8.6×8.6×20mm3 | 8.6×8.6×20mm3 |
| S | Inter-crystal Reflector | WRF | ESR | Teflon tape + WRF | Teflon tape + WRF |
| Reflector Thickness | 188 μm | 65 μm | ∼500 μm | ∼500 μm | |
| F | Fiber Type | WLS fibers (BCF-91MAC) |
WLS fibers (BCF-91MAC) |
WLS fibers (BCF-91MAC) |
Clear optical fibers (BC-98) |
| I | Fiber Dimension | 1.5×1.5×50mm3 | 1.5×1.5×50mm3 | 1.5×1.5×50mm3 | 1.5×1.5×50mm3 |
| B | Fiber end Reflector | WRF | WRF | WRF | WRF |
| E | Fiber side Reflector | Teflon tape | Teflon tape | Teflon tape | Teflon tape |
| R | Inter-fiber Reflector at fiber-array joint |
WRF | ESR | WRF | WRF |
| S | Fiber-Array Coupling | Optical grease | Optical grease | Optical grease | Optical grease |
2.3.2 Experimental Set-up
The experimental set-up for the detector module measurements is illustrated in Figure 4. A 16 × 16 × 2 mm3 LSO slab was connected to a single channel PMT and placed in coincidence with the detector module. A Na-22 point source (diameter 0.5 mm), with an activity of 35 μCi, was placed between the LSO slab and the module. The radiation source, the LSO slab and the single channel PMT were mounted on a translation table which was moved to irradiate different depths within the detector module. The signal from the single channel PMT was first amplified by a fast filter amplifier (Model 579, ORTEC, Oak Ridge, TN) and then sent to a constant fraction discriminator (CFD) (CF8000, ORTEC, Oak Ridge, TN). Signals from each 64-channel MC-PMT were multiplexed to four channels by charge-division readout (Siegel et al., 1996). The eight channels from the two MC-PMTs were passed through a pre-amplifier (NIM Model 778, Philips Scientific, Ramsey, NJ) and the signals split into a fast and slow circuit using a fan-in-fan-out (LeCroy 428F). For the fast trigger signal, the 8 signals were summed and sent to a second CFD. For the slow energy signals, the 8 individual channels were passed to a shaping amplifier (Model N568B C.A.E.N. Viareggio, Italy) for further amplification and pulse shaping (shaping time fixed to 200 ns). These 8 signals were digitized and stored in list mode. CFD2 for MC-PMTs was set to be ∼150 keV and CFD1 for the single channel PMT is set to just above noise level. The data acquisition set-up is shown in Figure 5.
Figure 4.

Experimental set-up for electronic collimation of source at different depths.
Figure 5.

Data acquisition scheme for single mode and coincidence mode. (Dotted lines and boxes are for timing measurements)
2.3.3 Flood Histograms and Energy Spectrum
Flood histograms and energy spectra were acquired in both singles mode and coincidence mode. In singles mode, the Na-22 source was placed about 3 cm away from the module to irradiate the LSO array uniformly. The signal from CFD2 was used as a trigger after appropriate delay (Model 416A, ORTEC, Oak Ridge, TN). The positions and energies were calculated from signals from the two PMTs using the following equations
where A1–D1 are the four signals from PMT1 and A2–D2 are from PMT2. E1, E2 is the energy measured by PMT1 and PMT2 respectively. Since each PMT was reading out a row of fibers coupled to one end of the LSO arrays, the flood histograms (e.g. histograms from x1 and y1) are the summation of all the detected events along one direction of the array (rows or columns). This is called the “1-D flood histogram” in this paper. Profiles were generated by summing these 1-D flood histograms and the peak-to-valley ratios were analyzed.
Using the signal from one PMT as the x direction position and the signal from the other PMT as the y direction position, a traditional 2-D flood histogram was calculated for each detector module using the following equations:
This flood histogram shows all N by N crystals in an array. The coordinate system is defined in (Yang et al., 2006). For any given interaction, signals x1 and x2 indicate which fiber the photons propagates from and thus give the X and Y position information respectively. Signals y1 and y2 do not provide any information in this instance as only one row of pixels is populated on each MC-PMT. The signals from both PMTs were summed up (Etotal) to form a histogram of total deposited energy and the full-width-half-maximum (FWHM) energy resolution was calculated. Flood histograms at each irradiation depth were segmented using a manually-defined look-up table to estimate the energy resolution for each individual crystal.
In coincidence mode, the Na-22 source was placed 1 cm away from the side of the LSO arrays and 5 cm from the LSO slab. This reduces the effect of source geometry. One LSO end was defined as 0 mm in depth and the other end as 20 mm (Figure 5). The LSO arrays were irradiated at depths from 2 mm to 18 mm with the translation table moving 1 mm per step. The CFD signals from the single channel PMT (CFD1) and the MC-PMTs (CFD2) were then fed into a quad-four-fold logic unit (Model 756, Philips Scientific, Ramsey, NJ) for electronic coincidence. The coincidence signal was used as a trigger after an appropriate delay (ORTEC Model 416A). 1-D flood histograms and 2-D flood histograms were plotted as the array was irradiated at different depths. The photopeak amplitudes in the energy spectra from each PMT, as well as from the sum of both PMTs, were measured at different irradiation depths.
2.3.4 DOI Resolution
DOI resolution was measured in coincidence mode with the data acquisition triggered by the coincidence signal of the LSO slab and the detector module. The DOI ratio was calculated by taking the ratio of energy signals from one end to the total energy, namely E2/Etotal. Histograms of the DOI ratio measured on an event by event basis at different depths were measured. The peaks of these histograms as a function of irradiation depth were plotted and fitted to a linear function for calibration of DOI ratio versus depth. This calibration was used to convert the full-width at half maximum (FWHM) of the DOI ratio histograms into a DOI resolution in mm.
2.3.5 Timing Resolution
Figure 5 (gray dotted lines) also shows the set-up used for timing measurements. CFD1 from the single channel PMT, was used as a “start” signal and fed into a time-amplitude-converter (TAC TC860, TENNELEC). CFD2 from the MC-PMTs was delayed and then fed into the same TAC as the “stop” signal. Using the coincidence signal as a trigger, the time difference between the single channel PMT signal and the MC-PMTs signals were acquired to plot a timing histogram. The timing resolution was calculated as the FWHM of the resulting distribution.
3. Results
3.1 Single-crystal, Single-fiber Experiment
The light collection efficiencies for the two types of fibers as a function of fiber lengths are shown in Figure 3(b). On average, the clear optical fiber had higher light collection efficiency than the WLS fibers when the fiber length was no more than 10 cm. For fiber lengths of 15 cm and 20 cm, the average light collection efficiencies were almost the same for two types of fibers. The reason for this surprising result may be because the quantum efficiency of H7546-M64 is much higher for the blue light emitted by LSO than the green light emitted by the WLS fibers. So while the absorption and re-emission mechanism of the WLS fiber is beneficial in directing more scintillation photons towards the PMT, this is counteracted by the low quantum efficiency of 15% of the PMT at the emission peak of WLS fiber at 494 nm. These results indicate that wavelength shifting dopant may not be necessary for the orthogonal fiber readout scheme shown in Figure 1.
3.2 Flood Histograms
3.2.1 Flood Histogram and 1-D Profile in Singles Mode
Figure 6 shows the flood histograms obtained when the detectors were irradiated uniformly. Each row of Figure 6 corresponds to one type of detector module. In every row, the images from left to right are: 1-D flood histogram from PMT1, 1-D flood histogram from PMT2, and 2-D flood histogram from both PMTs (“PMT1 + PMT2”). The other two columns are profiles obtained by vertically summing the 1-D flood histograms (“Profile1” was calculated from “PMT1” and “Profile2” was from “PMT2”). The average peak-to-valley ratios measured from the profiles for the WRF+WLS detector were 1.25 for Profile1 and 1.17 for Profile2. For LAB+WLS these ratios were 1.44 and 1.17 respectively. For LAB+CLE the ratios were 1.17 and 1.14.
Figure 6.

Left three columns: 1-D and 2-D flood histograms from different detector configurations. Right two columns: profiles from 1-D flood histograms.
The 2-D flood histogram from the ESR+WLS detector was very poor and the 5 × 5 crystals could not be identified. The crystals in this array are separated by a thin layer of ESR and it is known that the inter-crystal optical crosstalk was high, due both to some transmission through the reflector, and gaps at the corners where the reflector has been cut during array manufacture. Because of its poor crystal identification relative to the other detector modules, the ESR+WLS design was not further evaluated.
3.2.2 Flood Histograms in Coincidence Mode
In coincidence mode, the radiation source was translated to irradiate the array at different depths. Figure 7 shows the two 1-D flood histograms and the calculated 2-D flood images of the LAB+WLS module at different irradiation depths. As the radiation source was moved from 2 mm to 18 mm in depth, the 1-D flood histogram from PMT1 (Figure 7(a)) became increasingly ill-defined. Meanwhile, the 1-D flood histogram from PMT2 (Figure 7(b)) improved. This is due to the loss of light along the crystal length which is necessary to provide DOI information. As a consequence, in the 2-D histogram (Figure 7(c)), the crystal identification is good in the vertical direction for small depths, but bad in the horizontal direction, and this reverses for large depths. The same trend was observed in the flood histograms of all three detector modules.
Figure 7.

Flood histograms of the LAB+WLS module irradiated at different depths. (a), (b) 1-D flood histograms from each end, and (c) 2-D histograms calculated with signals from both ends.
3.3 Energy Spectrum and Energy Resolution
3.3.1 Energy Spectrum and Resolution in Coincidence Mode
Light collection for this orthogonal fiber read-out is relatively poor resulting in highly broadened energy spectra in which the photopeak is not readily resolved. The acquired spectra were fitted to a Gaussian function on a crystal-by-crystal basis to estimate the energy resolution. Averaged over all individual crystals and different irradiation depths, the energy resolution (FWHM) was 61±6%, 67±11%, 74±13%for WRF+WLS, LAB+WLS and LAB+CLE detectors respectively. The WRF+WLS detector had slightly better energy resolution than the other two. This detector also had a smaller standard deviation which is likely due to the better uniformity of manufactured array. This array was manufactured from one complete LSO block while the laboratory array was assembled from individual crystals. The energy resolution is poor for all three detector modules compared with direct coupling to a photodetector. However, for mouse imaging, animal PET scanners may be operated with wide-open energy windows (150 or 200-750 keV) (Yang and Cherry, 2006), therefore this is not likely a limiting factor in this application.
3.3.2 Photopeak Amplitude in Coincidence Mode
Figure 8 shows the normalized photopeak amplitudes for the three detector modules at different irradiation depths. The photopeak amplitudes show a strong depth dependence which is necessary for DOI information, but are not linear with depth. The total signal detected was higher when the array was irradiated at the ends and lower when the array was irradiated in the middle, thus the photopeak position is depth dependent. The decrease of photopeak amplitude from the middle to the ends of the array was 24% for WRF+WLS and about 35% for LAB+WLS and LAB+CLE. This would imply that energy windows may need to be set in a depth-dependent manner.
Figure 8.

Photopeak amplitudes measured at different depths for three modules
3.4 DOI Resolution
Figure 9 shows histograms of the DOI ratio of all events as a function of depth for the three detector modules. The dynamic range of the WRF+WLS detector was slightly smaller than the other two detectors. As shown in Figure 10(a), the peaks of the DOI histograms were approximately linear with irradiation depth for all three detector modules. Using a linear fit to the data in Figure 10(a), the measured DOI ratio can be converted to the depth of interaction in mm. Using this calibration, the FWHM DOI resolutions at different irradiation depths were calculated and are shown in Figure 10(b). Averaged over all irradiation depths, the FWHM DOI resolutions for WRF+WLS, LAB+WLS and LAB+CLE were 6.7 mm, 5.5 mm, and 6.0 mm respectively.
Figure 9.

DOI ratio histograms for three detector modules. Curves with different color are histograms with different irradiation depths (from 2 mm to 18 mm with 1mm per step).
Figure 10.

Measurements for three modules (a) peak positions of DOI histograms; (b) DOI resolutions at different depths
3.5 Timing Resolution
Using the signal from the LSO slab as the “start” signal and summation of the two PMTs as the “stop” signal, time differences were recorded and plotted into a timing histogram. TAC voltage signals were calibrated using known time delays. The timing resolution was measured as the FWHM of the timing histogram and found to be 7.8 ns, 7.3 ns, and 5.1 ns for WRF+WLS, LAB+WLS, and LAB+CLE detectors respectively. The clear fibers had no wavelength shifter dopant and thus no delay in the propagation of the light photons. The photons in WLS fibers underwent a re-emission process with a 12 ns decay time, thus broadening the arrival time of photons at the PMT. This may explain why the LAB+CLE module had the best timing performance.
4. Discussion
We compared four detector modules assembled from three different LSO arrays (WRF, ESR and LAB) and two types of optical fiber (WLS and CLE) read out. The performance of these four modules is summarized in Table 2. The detectors show some promise for small animal imaging applications, with acceptable timing and DOI resolution, but marginal crystal identification. Energy resolution of the modules with manufactured array (WRF+WLS) is slightly better than the module fabricated in the lab (LAB+WLS and LAB+CLE). However, the energy resolution is still poor for all three detector modules. Comparing to conventional detector designs in which the scintillator array is directly coupled to the photodetector, orthogonal fiber read-out has much more light loss and thus worse energy resolution. DOI resolution and timing resolution were calculated using all events above the CFD threshold and gave acceptable results. The laboratory array with either WLS fibers or clear fibers had better DOI resolution than WRF+WLS. The clear optical fibers, which are not normally used in an orthogonal configuration, were not significantly worse than WLS fibers, suggesting that clear optical fibers may be used for read out. However, different results would likely be achieved using a different photodetector (e.g. avalanche photodiode or silicon photomultiplier) that had more favorable quantum efficiency at the wavelength of the WLS fiber emission.
Table 2.
Performance of four detector modules. Peak-to-valley ratios are the average in 1-D flood histograms of two ends. Energy resolution is from single crystal averaged over different depths. DOI/timing resolution is overall value of all crystals.
| WRF+WLS | LAB+WLS | LAB+CLE | |
|---|---|---|---|
| Peak-to-Valley ratio | 1.25, 1.17 | 1.44, 1.17 | 1.17, 1.14 |
| Energy Resolution | 61±6% | 67±11% | 74±13% |
| DOI Resolution | 6.7 mm | 5.5 mm | 6.0 mm |
| Timing Resolution | 7.8 ns | 7.3 ns | 5.1 ns |
The performance of the detector modules is clearly limited by the collection of scintillation light, despite attempts to maximize this using different reflectors and array configurations. The best prospects for this detector approach may therefore be to move to a scintillator which significantly higher light output such as LaBr3 or LuI3. Another possible detector design is to directly couple one end of the LSO array to a MC-PMT while the other end is coupled to fibers that are read out by a single channel PMT. The direct MC-PMT read-out could improve the crystal encoding and timing, and the fiber read-out would be used only for DOI information. Worstell and colleagues (Worstell et al., 2004) have successfully developed a whole-body clinical scanner using a similar approach with a very bright scintillator (CsI(Na)) and relatively large crystals (3.75 × 7.5 × 36 mm3). In terms of the numbers of channels and number of PMT elements, this approach is not as efficient as the one proposed here, however it would lead to improved event positioning, energy and timing resolution.
Acknowledgments
The authors would like to thank PhotoDetection Systems Inc (Acton, MA) for providing the TORAY Lumirror® E60L white reflective film. This work was funded by NIH grant R24 CA110804.
Reference
- Andreaco MS, Williams CW, Moyers JC, Vaigneur K. United States Patent 6,749,761 Method for producing a high resolution detector array. 2004
- Budinger TF, Derenzo SE, Huesman RH, Jagust WJ, Valk PE. High resolution positron emission tomography for medical science studies. Acta Radiol. 1991;376:15–23. [PubMed] [Google Scholar]
- Burr KC, Ivan A, LeBlanc J, Zelakiewicz S, McDaniel DL, Kim CL, Ganin A, Shah KS, Grazioso R, Farrell R, Glodo J. Evaluation of a position sensitive avalanche photodiode for PET. IEEE Transactions on Nuclear Science. 2003;50:792–6. [Google Scholar]
- Cherry SR, Shao Y, Silverman RW, Meadors K, Siegel S, Chatziioannou AF, Young JW, Jones WF, Moyers JC, Newport D, Boutefnouchet A, Farquhar TH, Andreaco M, Paulus MJ, Binkley DM, Nutt R, Phelps ME. MicroPET: A High Resolution PET Scanner for Imaging Small Animals. IEEE Transactions on Nuclear Science. 1997;44:1161–6. [Google Scholar]
- Du H, Yang Y, Cherry SR. Measurements of wavelength shifting (WLS) fibre readout for a highly multiplexed, depth-encoding PET detector. Physics in Medicine and Biology. 2007;52:2499–514. doi: 10.1088/0031-9155/52/9/011. [DOI] [PubMed] [Google Scholar]
- Orita N, Murayama H, Kawai H, Inadama N, Tsuda T. Three-Dimensional Array of Scintillation Crystals with proper reflector arrangement for a depth of interaction detector. IEEE Transactions on Nuclear Science. 2005;52:8–14. [Google Scholar]
- Seidel J, Vaquero JJ, Siegel S, Gandler WR, Green MV. Depth identification accuracy of a three layer phoswich PET detector module. IEEE Transactions on Nuclear Science. 1999;46:485–90. [Google Scholar]
- Siegel S, Silverman RW, Cherry SR. Simple charge division readouts for imaging scintillator arrays using a multi-channel PMT. IEEE Transactions on Nuclear Science. 1996;43:1634–41. [Google Scholar]
- Tai YC, Chatziioannou AF, Yang Y, Silverman RW, Meadors K, Siegle S, Newport DF, Stickel JR, Cherry SR. MicroPET II: design, development and initial performance of an improved microPET scanner for small-animal imaging. Physics in Medicine and Biology. 2003;48:1519–37. doi: 10.1088/0031-9155/48/11/303. [DOI] [PubMed] [Google Scholar]
- Worstell W, Adler S, Domigan P, Johnson O, Kudrolli H, Lazuka D, Monteverde P, Nevin J, Rohatgi R, Romanov L, Starsja S. Design and performance of a prototype whole-body PET/CT scanner with fiber optic readout; Nuclear Science Symposium and Medical Imaging Conference; Rome, Italy. 2004. pp. 3280–4. [Google Scholar]
- Worstell W, Doulas S, Johnson O, Lin CJ. Scintillator crystal readout with wavelength-shifting optical fibers; Nuclear Science Symposium and Medical Imaging Conference; Norfolk, VA. 1994. pp. 1869–73. [Google Scholar]
- Yang Y, Cherry SR. Observations regarding scatter fraction and NEC measurements for small animal PET. Nuclear Science, IEEE Transactions on. 2006;53:127–32. [Google Scholar]
- Yang Y, Dokhale PA, Silverman RW, Shah KS, McClish MA, Farrell R, Entine G, Cherry SR. Depth of interaction resolution measurements for a high resolution PET detector using position sensitive avalanche photodiodes. Physics in Medicine and Biology. 2006;51:2131–42. doi: 10.1088/0031-9155/51/9/001. [DOI] [PubMed] [Google Scholar]